How to Use PPO for Trend and Aroon for Post-Correction Breakouts
Welcome to the Chart Fix!
Key Takeaways
- Try this simple strategy to identify the long-term uptrend and short-term breakouts after corrections.
- PPO can help identify long-term uptrends.
- The Aroon indicator can be used to identify short-term breakouts after corrections.
My bread-and-butter trading strategy is to look for consolidations within long-term uptrends and during bull markets. We are clearly in a bull market, with SPY, QQQ and IWM hitting new highs. Today's report will feature a simple strategy that uses the PPO to identify the long-term uptrend and Aroon to identify short-term breakouts after corrections.
PPO Trend and Aroon Signal in SPY
Developed by Tushar Chande, the Aroon indicator uses price and time to quantify trend strength and direction. Aroon Up (25) reflects the number of periods since a 25-day high, while Aroon Down (25) reflects the periods since a 25-day low. Aroon Up (25) hits 100 when the high marks a 25-day high, while Aroon Down (25) hits 100 when the low marks a 25-day low.
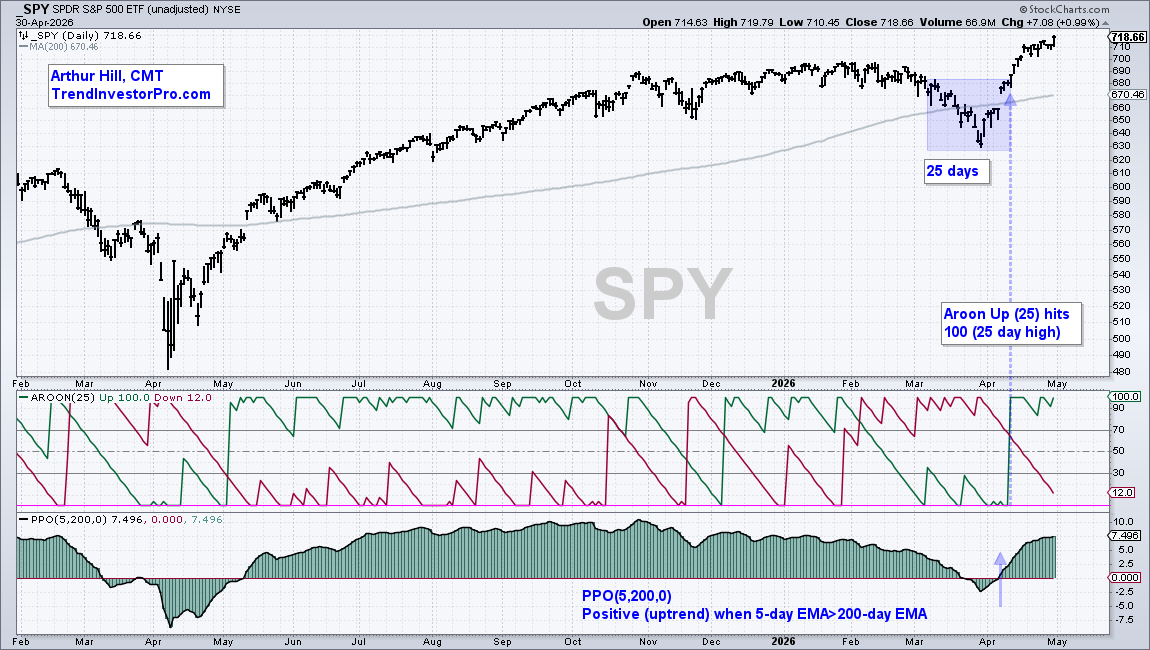
Overall, an upward bias is present when Aroon UP is above 50 and greater than Aroon Down. An Aroon Up (25) move to 100 signals a 25-day high and implies a breakout. Chartists can use these signals to confirm or time consolidation breakouts on the price chart. Keep in mind that 25 days is a relatively short time period, which means this is best suited for price patterns that extend 4-to-12 weeks.
Recent Reports and Videos on TrendInvestorPro
- Energy SPDR Breaks out after pullback.
- Three oversold Aerospace & Defense stocks.
- Ag and oil lead the commodity complex higher.
- Gold becomes oversold within uptrend.
- Master ChartList (297 ETFs Organized Top-Down)
Click here to get your ChartList and access all reports.
How to Use Aroon to Identify Breakouts Within Uptrends
The next chart shows a typical setup featured on TrendInvestorPro: a leading long-term uptrend and a bullish correction/consolidation. The Solar Energy ETF (TAN) meets the trend requirement and triggered a bullish Aroon signal. TAN has been in an uptrend since the PPO(5,200,0) turned positive on July 2nd and, just before this uptrend signal, Aroon Up (25) surged above 100 on July 1st. This breakout coincided with the long-term trend change. TrendInvestorPro featured on April 7th as the triangle took shape.
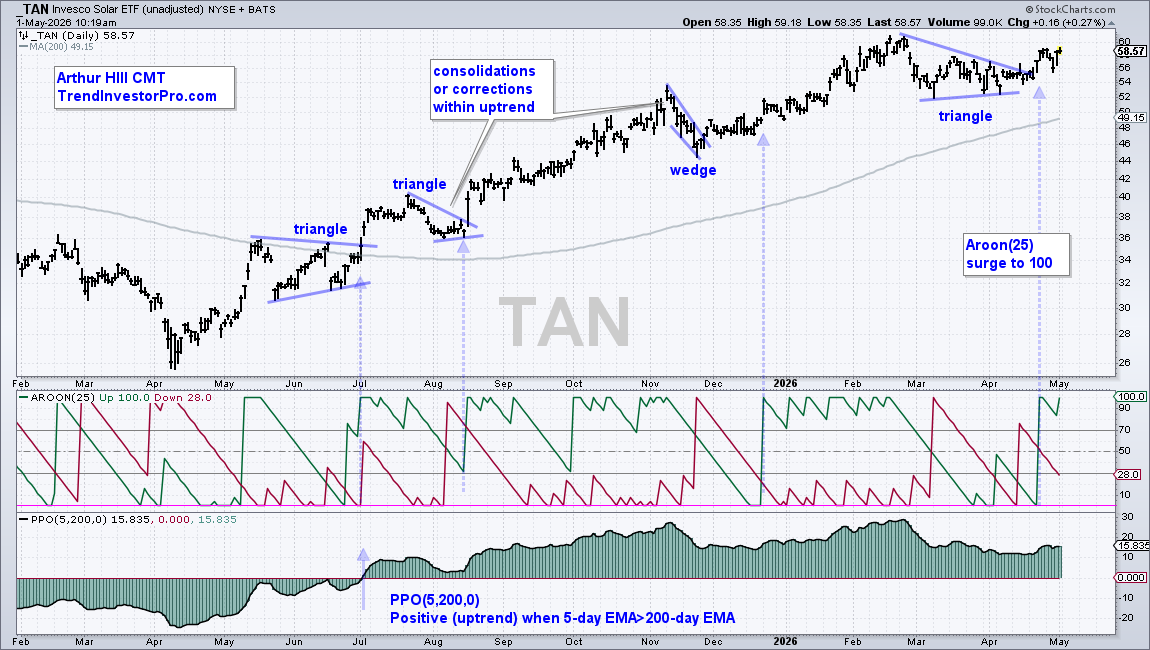
TAN continued higher with bullish consolidations forming in July–August (triangle), November (wedge) and March–April (triangle). In a long-term uptrend, consolidations are considered bullish continuation patterns that represent a rest along the way. The subsequent breakout signals an end to the consolidation and a resumption of the long-term uptrend.
The blue-dashed arrow lines show when Aroon Up (25) surges from below 50 to 100. The move below 50 means there was a consolidation or pullback, while the surge to 100 signals a 25-day high or a breakout.
Most recently, TAN consolidated with a triangle in March–April and broke out with a surge on April 22nd and 23rd. Also notice that Aroon (25) surged to 100 on April 22nd, which confirms the breakout. In general, I stick with these signals until the long-term trend turns down or a bear market signals.