The Best Five Sectors This Week #63
Key Takeaways
- Technology reclaims a top-five spot, significantly altering S&P 500 sector weightings and portfolio dynamics.
- Weekly and daily RRGs highlight Technology's accelerating momentum, pushing other sectors aside.
- Energy and materials maintain relative strength, while Industrials and Real Estate show signs of weakening.
Technology Makes a Comeback
After a relatively quiet week for the S&P 500, with the index gaining about half a percent, the underlying sector movements have revealed some intriguing changes. The most notable development is the Technology sector's return to the top five.
Here’s how the rankings currently stand:
- (1) Energy - XLE [6%]
- (2) Materials - XLB [4%]
- (3) Industrials - XLI [16%]
- (7) Technology - XLK [71%]*
- (5) Real Estate - XLRE [4%]
- (6) Consumer Staples - XLP
- (4) Utilities - XLU*
- (8) Communication Services - XLC
- (11) Consumer Discretionary - XLY*
- (10) Financials - XLF
- (9) Health Care - XLV*
This reshuffling isn’t just about sector composition. The entrance of Technology, with its heavy weighting in the S&P 500, has dramatically altered the portfolio’s weighting scheme.
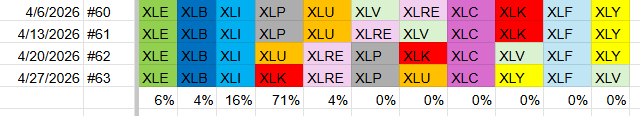
Technology now accounts for 71% of the weight, pushing the other four sectors’ weights down to nearly half or less of their previous levels. The portfolio is now heavily tilted toward technology, making its performance crucial for closing the gap with the S&P 500.
Weekly RRG
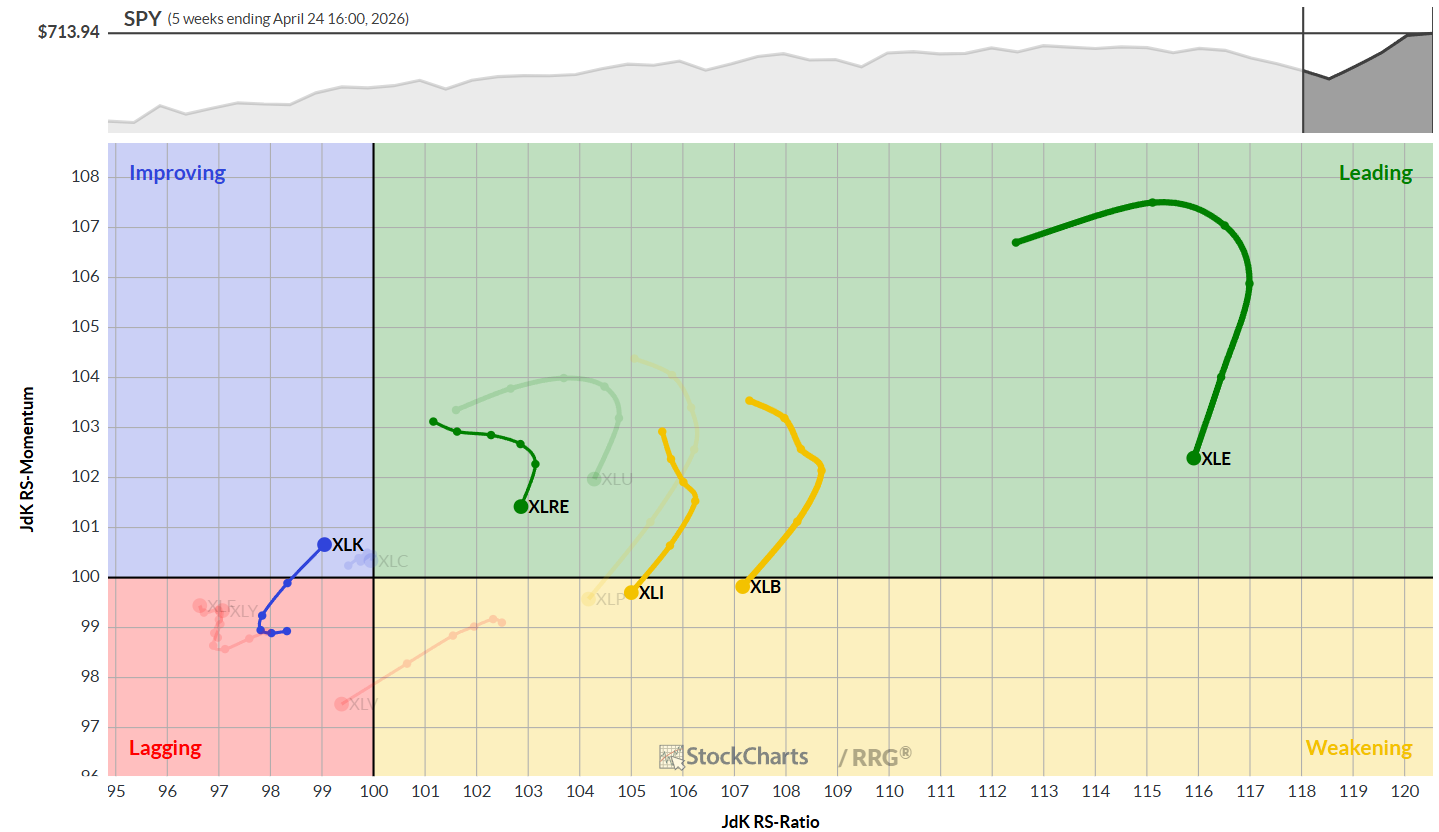
Looking at the weekly Relative Rotation Graph (RRG), the four static sectors in the top five—Energy, Materials, Industrials, and Real Estate—continue their established trajectories. Energy and Real Estate remain in the leading quadrant but are rolling over with a negative RRG heading. Materials and Industrials have crossed into the weakening quadrant, though all four sectors still show relatively high RS-ratio readings and continue to have potential to perform well.
Technology is rapidly accelerating, now in the improving quadrant. The increase in RRG velocity—the distance between nodes—signals that the sector’s momentum is picking up speed.
Daily RRG
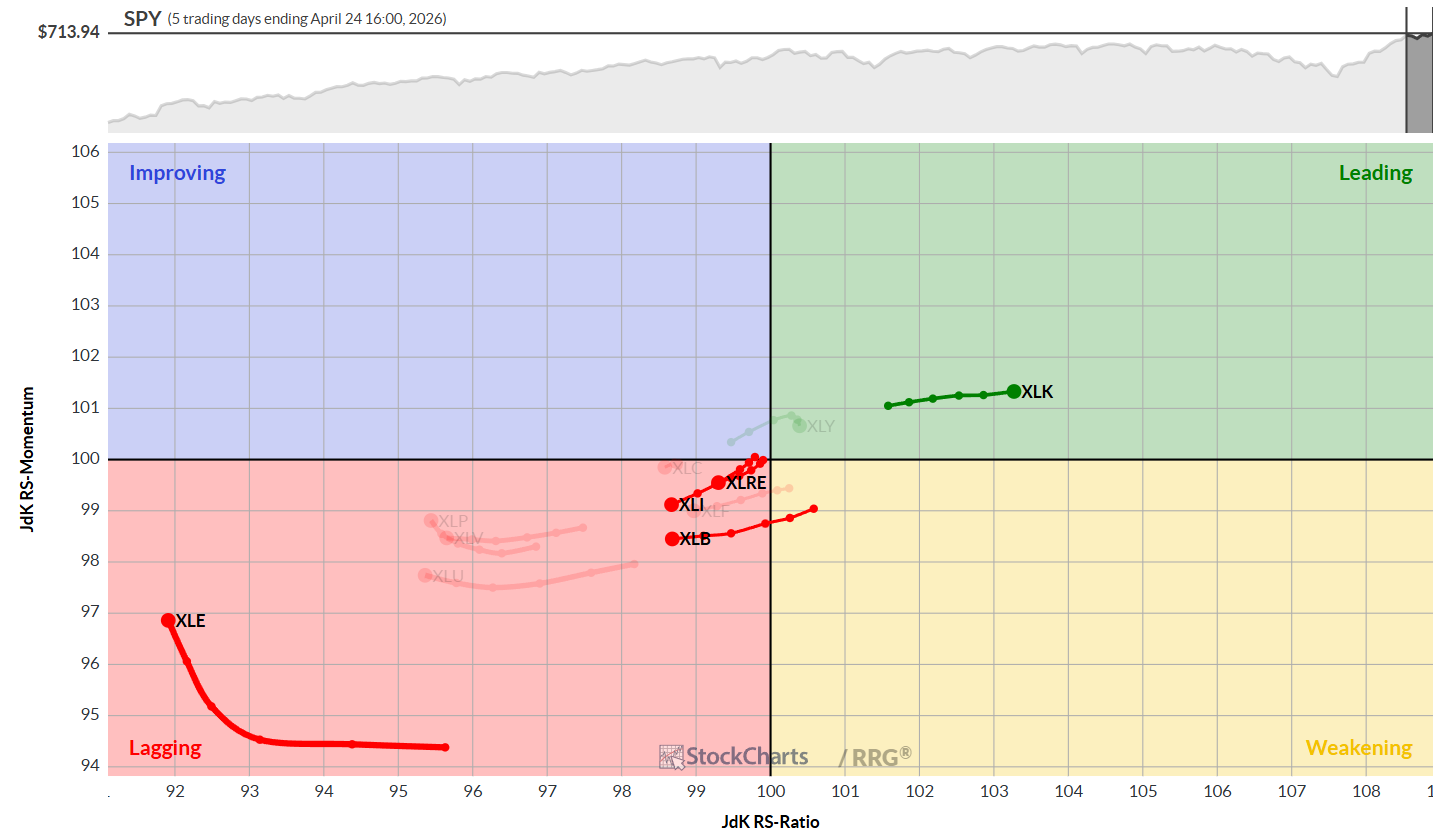
On the daily RRG, Technology stands out as the only sector rapidly moving to the right within the leading quadrant, maintaining stable momentum. Consumer Discretionary is also in the leading quadrant, but its tail has rolled over after entry. The other top five sectors are in the lagging quadrant, with energy picking up relative momentum while the rest move lower on the RS-ratio scale.
Together, the weekly and daily RRGs highlight Technology’s resurgence, pushing other sectors aside. We’ll have to watch how this plays out for the rest of the top five portfolio.
Sector Highlights
Energy
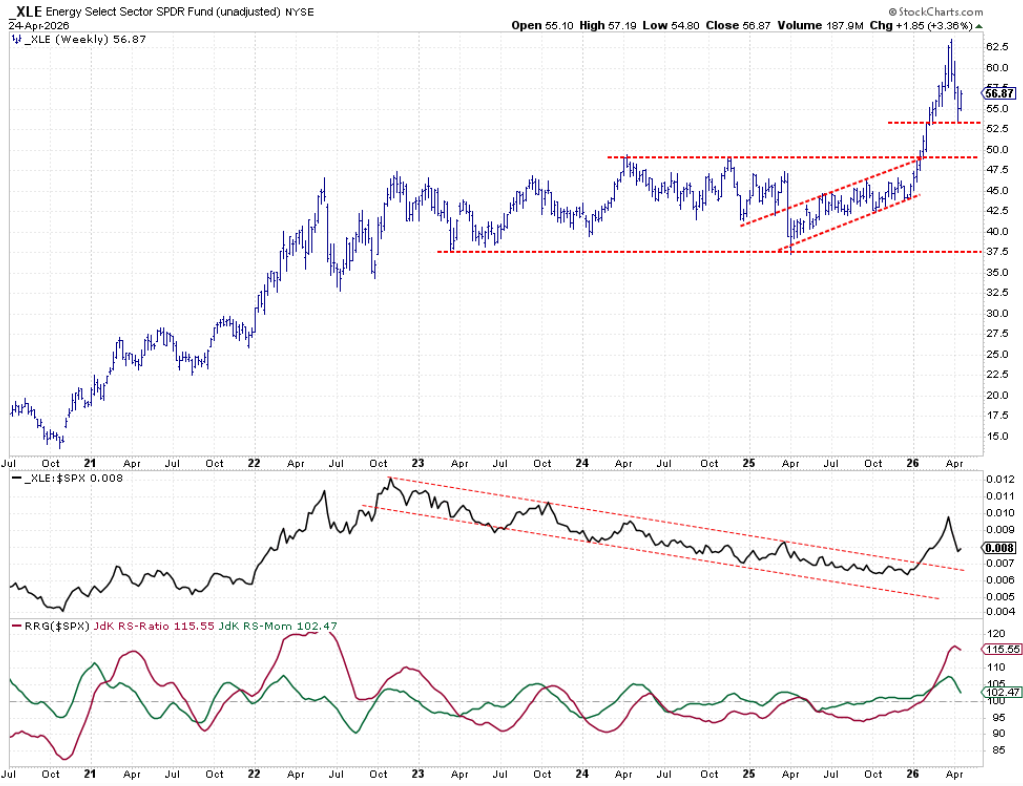
Energy is holding up well in terms of relative strength. The price has established a new higher low around $53 and is rising again. The raw RS line shows signs of a new low and, while the RRG lines are pointing lower, the RS-ratio line remains strong.
Odds are good for the relative strength line to continue higher, which could turn the RS momentum line around and keep energy in the leading quadrant.
Materials
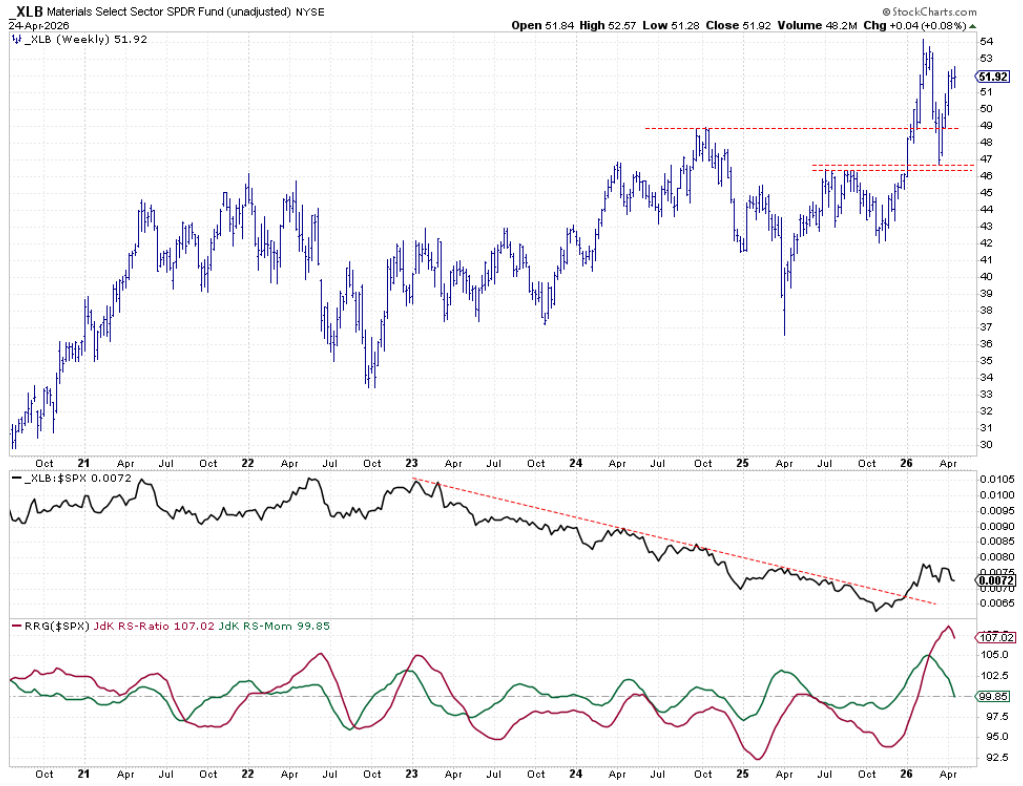
Materials are also holding up, with little change over the past three weeks. The raw RS line is moving sideways, giving the RRG lines time to catch up. If price strength persists, materials could maintain their position at the top.
Industrials
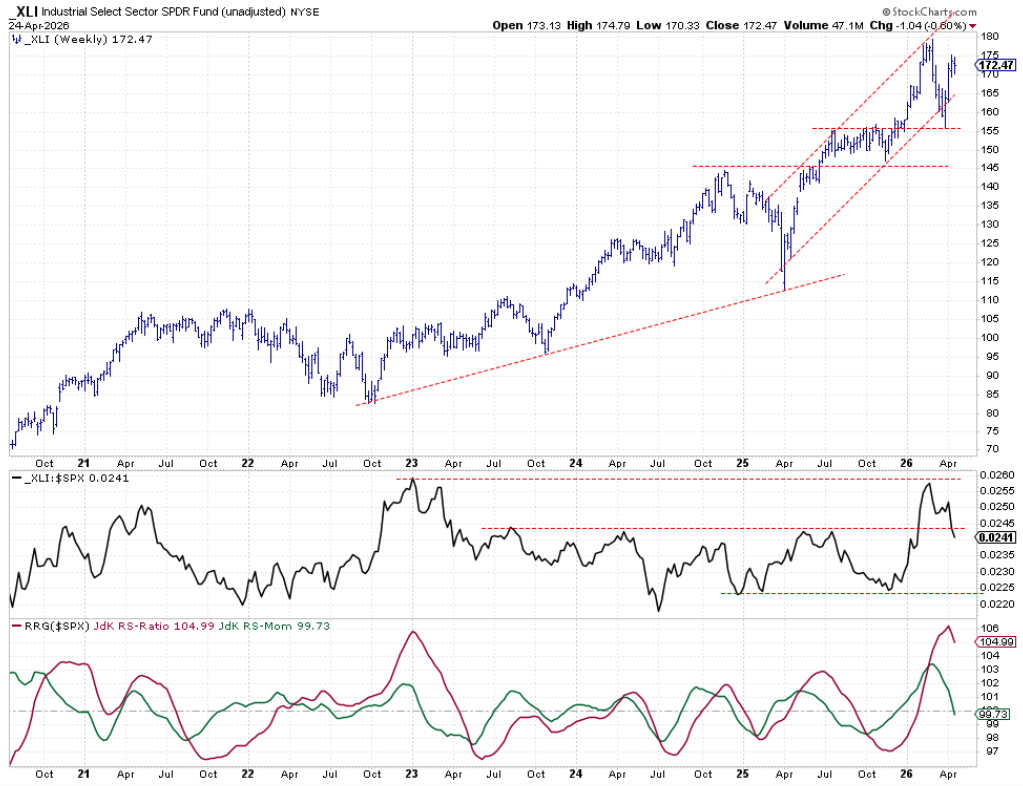
Industrials remain within their rising trend channel, but the relative strength line shows a clear lower-high, lower-low pattern, breaking below horizontal support. This could accelerate the sector’s downward rotation, and it’s uncertain whether it will stop before the RS ratio falls below 100. Industrials are in the weakening quadrant but still have room to recover if momentum returns soon.
Technology
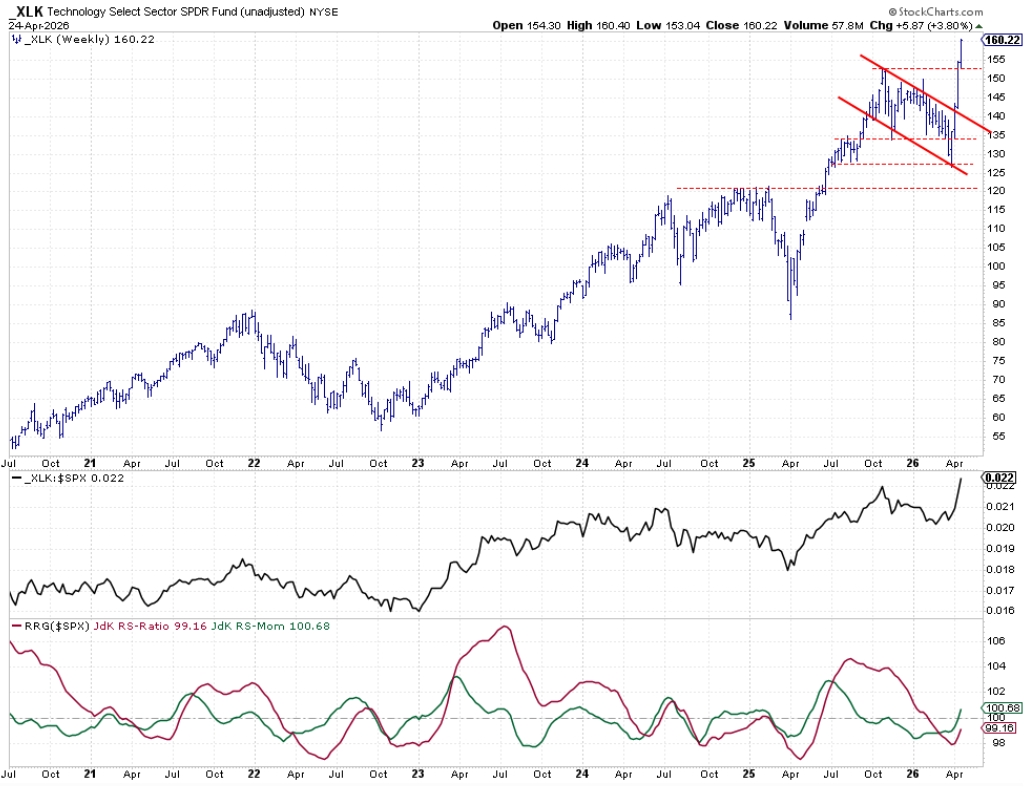
Technology is the standout sector. The price chart shows a rapid rally from roughly 130 to over 155 over three weeks, pushing the relative strength line above its previous high. Both RRG lines have turned upward, and technology is close to crossing into the leading quadrant on the weekly RRG, solidifying its place in the top five.
Real Estate
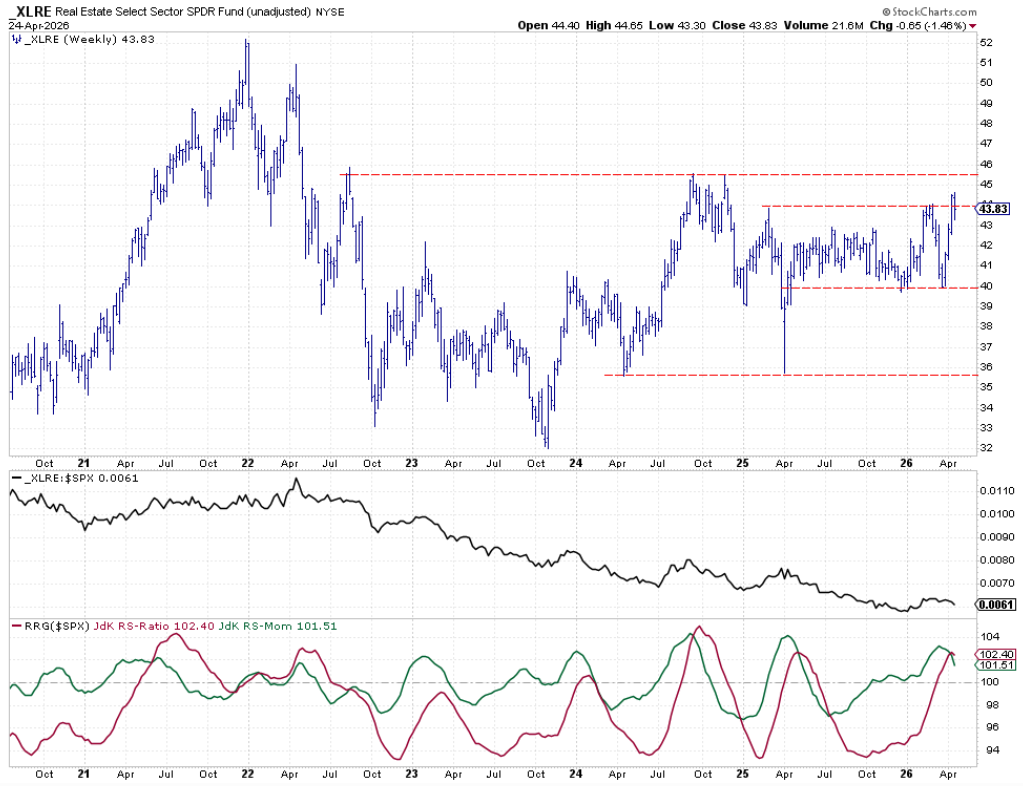
Real Estate is struggling to maintain levels above the breakout line at 44. The lack of decisive follow-through has caused the raw relative strength line to move sideways, and the RRG lines are rolling over. Real Estate remains in the leading quadrant but is losing momentum and heading toward weakening. Another sector could soon push Real Estate out of the top five.
Portfolio Performance
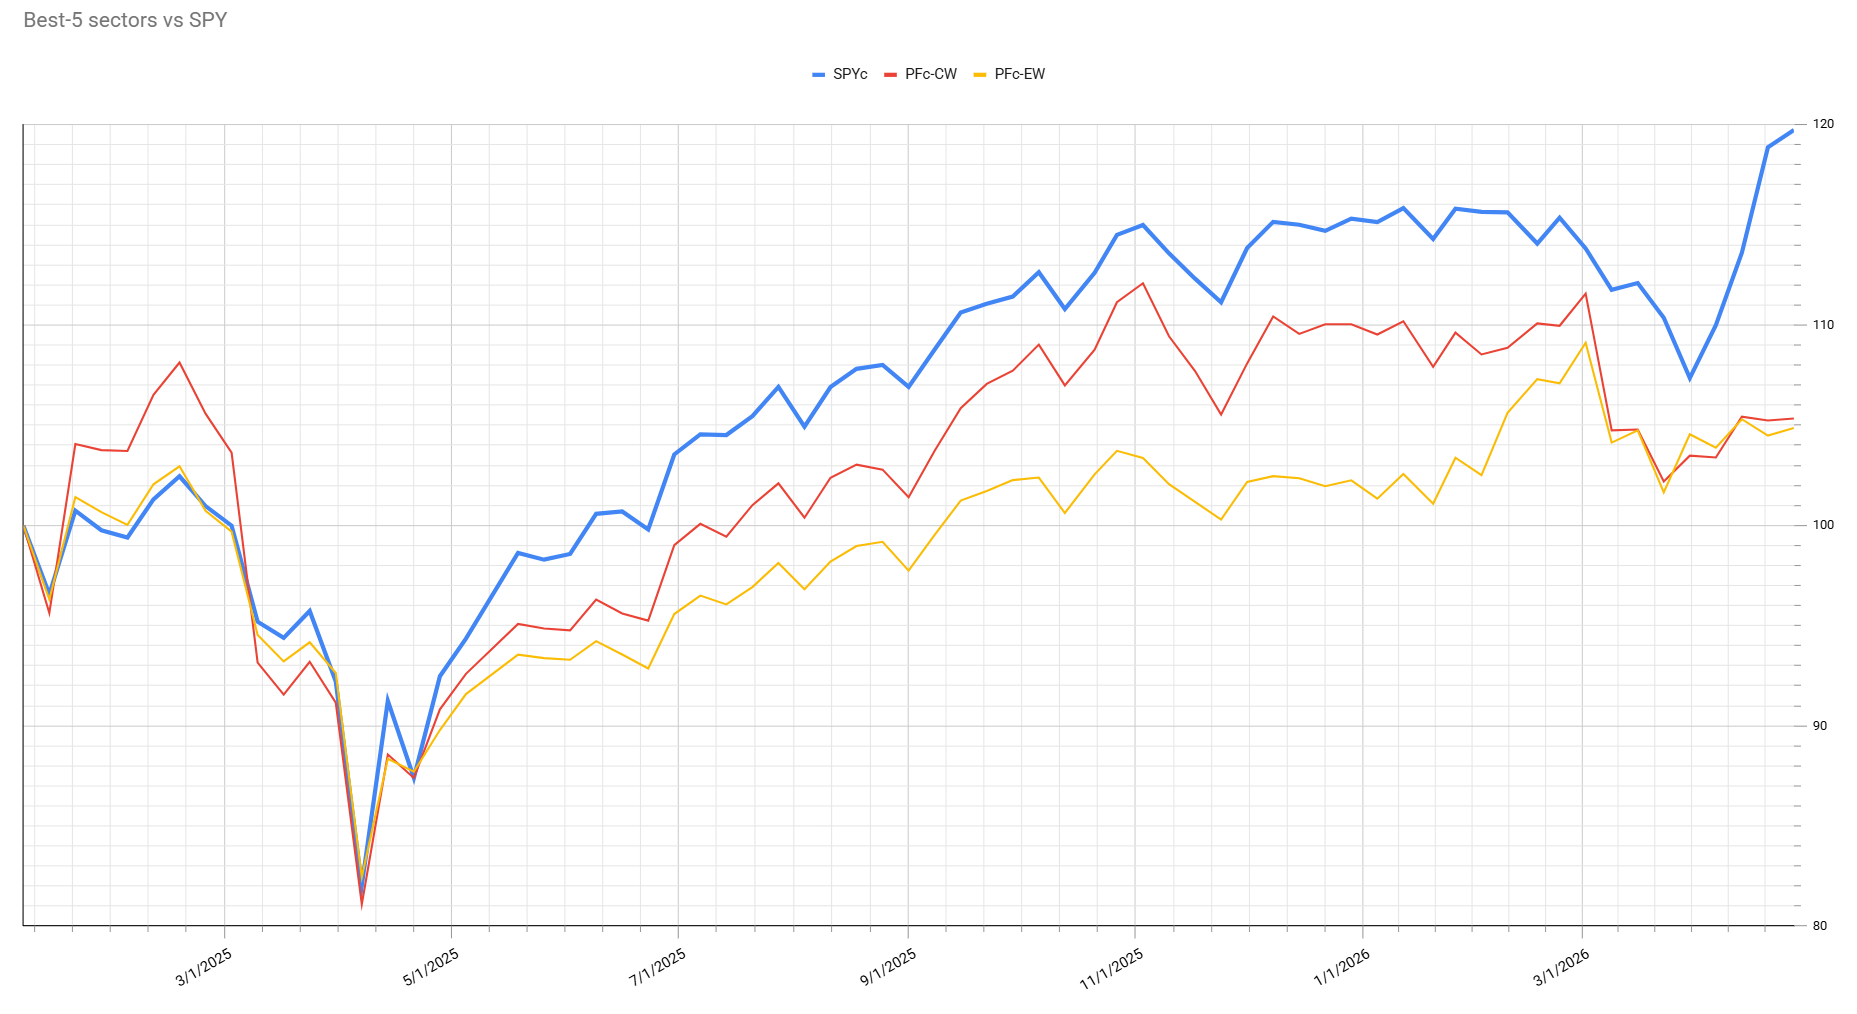
The S&P 500’s stabilization has only marginally widened the gap between the portfolio and the index, but the portfolio remains about 13% behind. The recent volatility has caused performance to drop back after almost catching up with the S&P 500.
This approach requires a long stretch of stable sector rotation to keep up with and outperform the S&P 500. With technology back in the top five, sector weights are being adjusted to reflect market capitalization, which means XLK is once again the dominating sector.
Observations on Strategy
As I continue to research these strategies, I’ve noticed that sector moves, like Technology entering the top five, quite regularly happen midweek, causing the portfolio to miss out on performance for a few days. For example, Technology moved into the top five on April 22nd, but the portfolio only updates weekly, potentially missing strong moves.
This isn’t an excuse, just an observation. I’ll keep researching and sharing insights, even when the strategy faces challenges.
The Bottom Line
The return of Technology to the top five has dramatically shifted sector composition and portfolio weighting. With Technology now dominating, its performance will be key to closing the gap with the S&P 500. Sector rotation remains dynamic, and ongoing research will help refine these strategies for better results.
#StayAlert, --Julius