Corrections in Bull Markets; Tradable Pullbacks in Uptrends; Breakouts in XLI and XLB
Today's report starts by reviewing the evidence for a bull market and highlighting trend signals for the sector SPDRs. After that, we turn our attention to the Industrials and Materials SPDRs, which showed relative strength in March and set up bullish in early April. With breakouts in early April, these two ended their corrections and signaled a continuation of their long-term uptrends.
Before looking at current key levels, let's review the setups that were in play in early April. Chartists can learn from these setups because they provide a repeatable process to identify corrections within bigger uptrends.
Bull Market with Correction in March
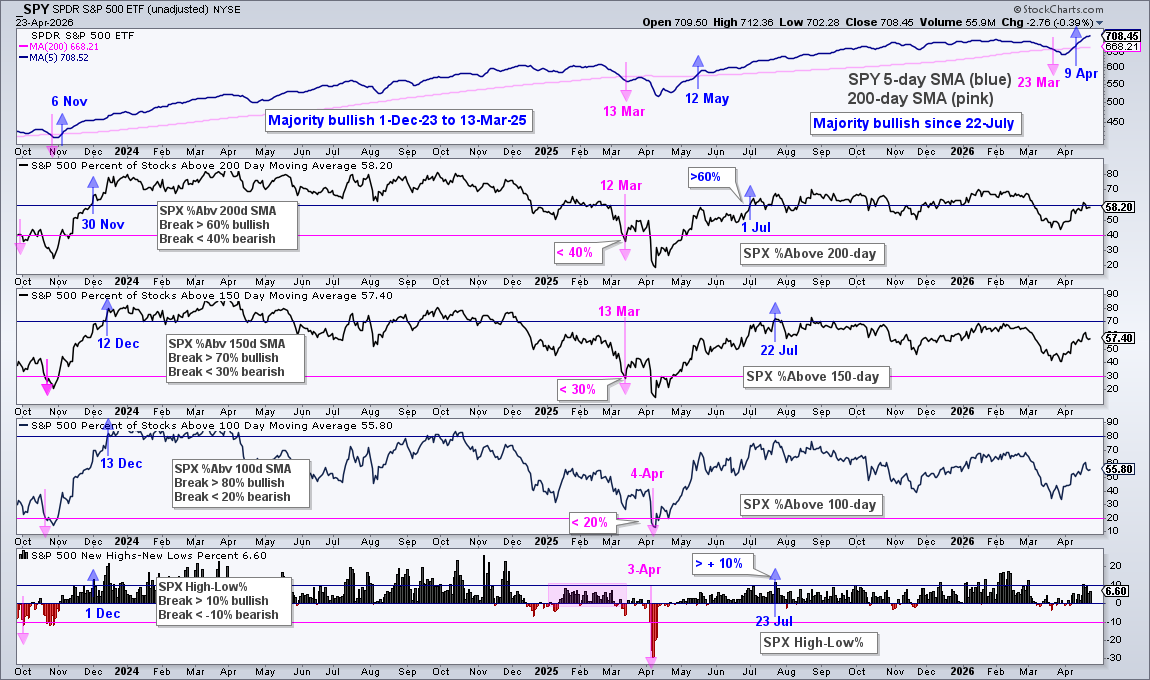
There are two prerequisites for identifying tradable corrections. First, we must be in a bull market. Second, the ETF must be in a long-term uptrend. Our breadth models at TrendInvestorPro stayed bullish throughout March and suggested that the March decline was a correction within a bull market. The image below shows the S&P 500 model turning majority bullish on July 22nd and remaining majority bullish from there.
Long-term Uptrends Held in March
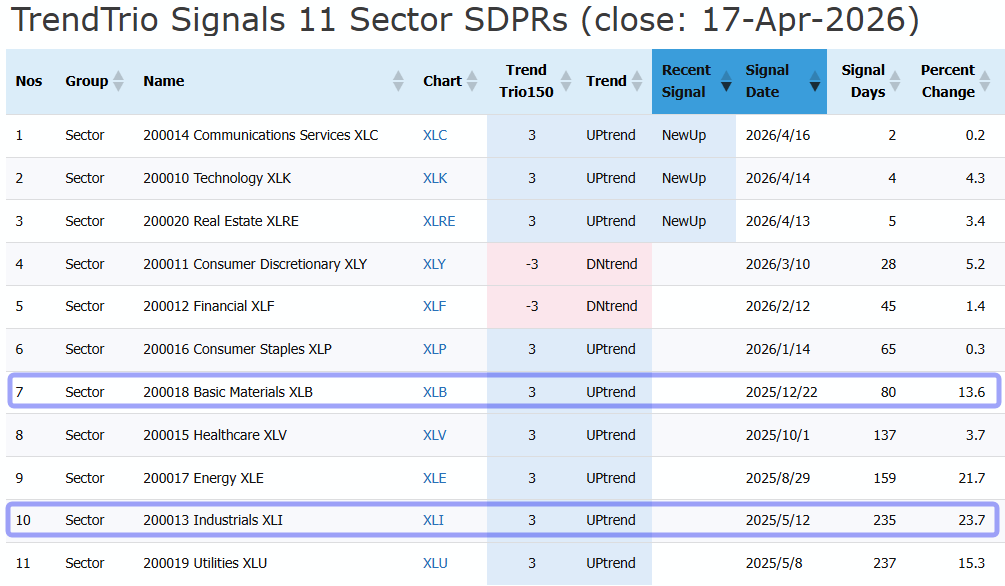
Our key trend indicator, the Trend Trio150, remained bullish throughout March for XLI and XLB. The table below shows Trend Trio150 signals for the 11 sector SPDRs. XLI and XLB signaled uptrends in May 2025 and December 2025, respectively (blue outlines). This signal table is free and updated every Saturday at TrendInvestorPro.
Identifying the Bullish Setup Zone
The first chart shows XLI bouncing off what I call a Bullish Setup Zone, which is an area to watch for a reversal (blue shading). Three technical factors are in play here. First, there is broken resistance turning into support (pink-blue shading). Second, the decline returned to the rising 200-day SMA, which also marks support. Third, there is the 61.8% retracement line. Together, these factors mark a zone chartists should watch for a reversal.
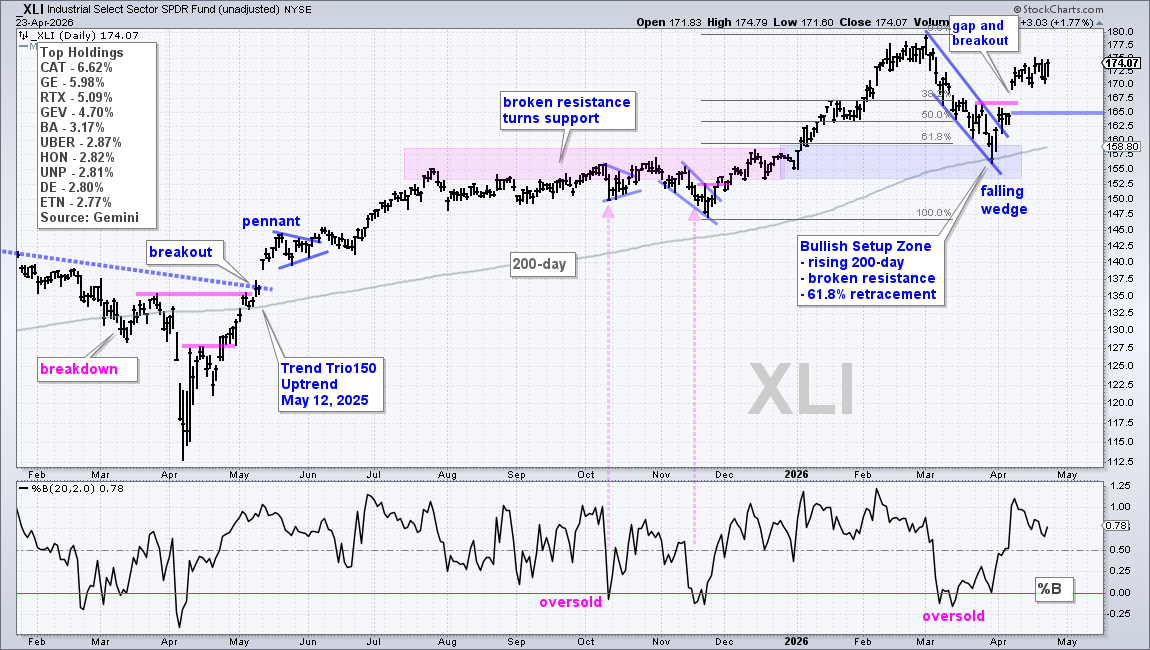
The indicator window shows %B becoming oversold in March, with two dips below zero and one dip to the zero line. %B moves below zero when the close is below the lower Bollinger Band (20,2). This is a short-term oversold condition that alerts traders to position for a bounce.
Confirming with an Upside Breakout
ETFs can become oversold and remain oversold, which is why chartists need an indicator or price pattern to signal a short-term reversal. This is where the falling wedge pattern comes into play.
Falling wedges are typical for corrections within bigger uptrends. These patterns provide us with resistance levels to watch for a short-term trend reversal. XLI broke the wedge line in early April for the first signal. The ETF then followed through on this break, with a gap-surge above short-term resistance on April 8th.
The April 8th gap-surge is the key going forward. A strong breakout should hold, so it's important that this gap-surge holds. A close below 165 would negate the breakout and call for a re-evaluation.
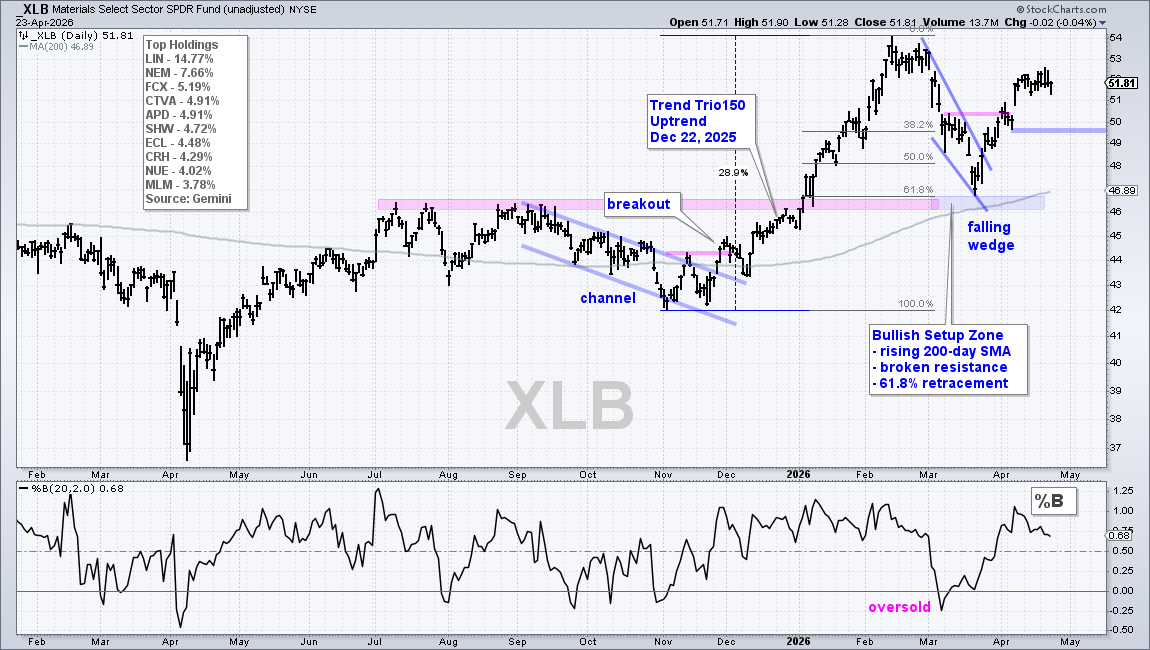
The next chart shows the Materials SPDR (XLB) with similar characteristics.
Recent Reports and Videos on TrendInvestorPro
- AI, DataCenter and Connectivity ETFs Lead
- Setups in Two Natural Gas Stocks
- Master ETF ChartList (free for subscribers)
- Trend Momentum Strategy Performance Updates
- Trend Trio150 Signals for Dow 30 Stocks and SPDRs
- Click here to take a trial and gain immediate access.