Semiconductors Explode Higher: Is This the Peak of the Chip Stock Supercycle?

Key Takeaways
- Semiconductor stocks have surged nearly 50% in four weeks, fueled by relentless AI fervor.
- A historic $SOX winning streak comes alongside overbought conditions and rising correction-risk.
- NVIDIA’s breakout may confirm strength, but macro risks still lurk beneath the surface.
Throw a dart at the one-month Semiconductors industry performance heat map and you’ll likely land on an incredible return. The focus this week will undoubtedly be on five of the Magnificent Seven reporting Q1 results, but the broad tech sector continues to be thrust higher by chip stocks.
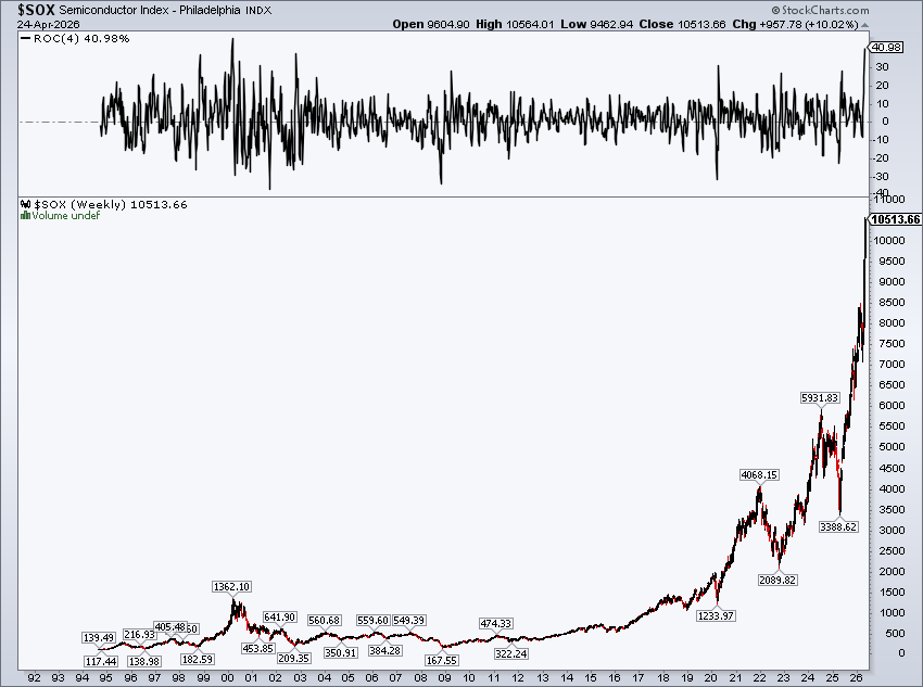
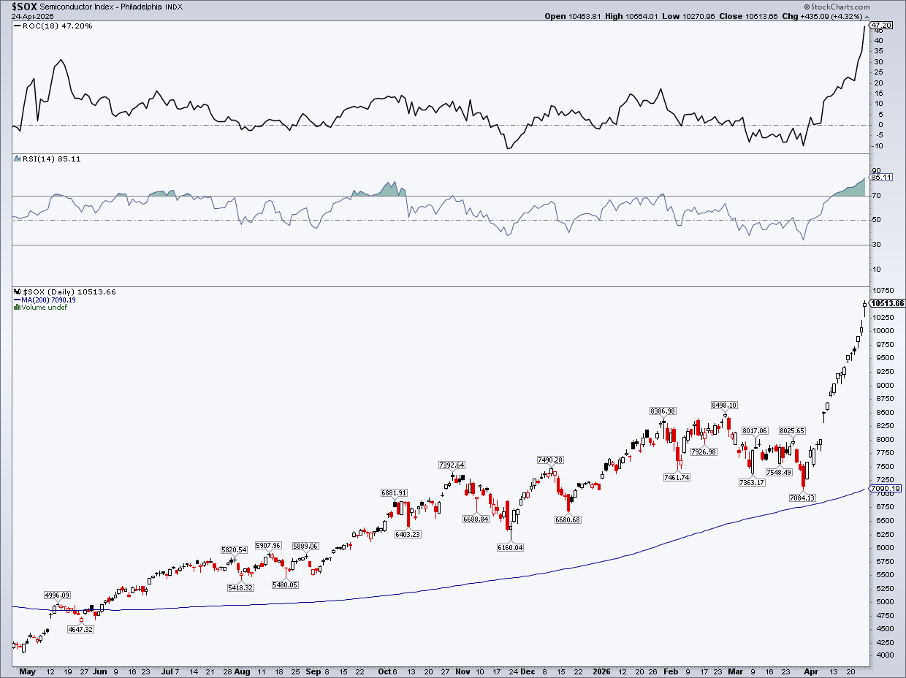
Up 18 sessions running coming into the final four trading days of April, the Philadelphia Semiconductor Index ($SOX) has a shot at posting a perfect month, 22 straight positive days.
MarketCarpets Reveal the Breadth of the AI Surge
I like to visualize this sector using StockCharts’ MarketCarpets. Selecting the Technology group, then sorting by 1M Change, we see that NVIDIA (NVDA) and Taiwan Semiconductor (TSM) boast formidable returns since late March, but outright generational gains have been achieved by other AI compute names and storage stories.
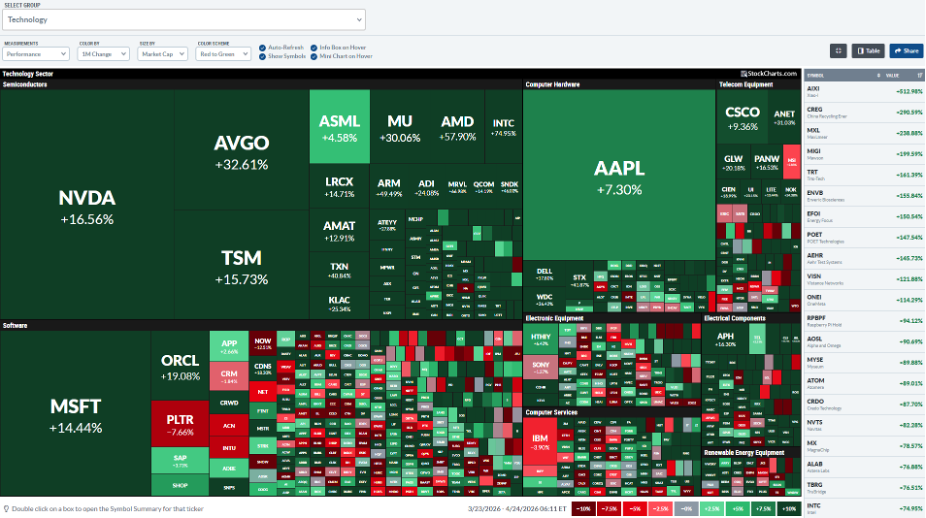
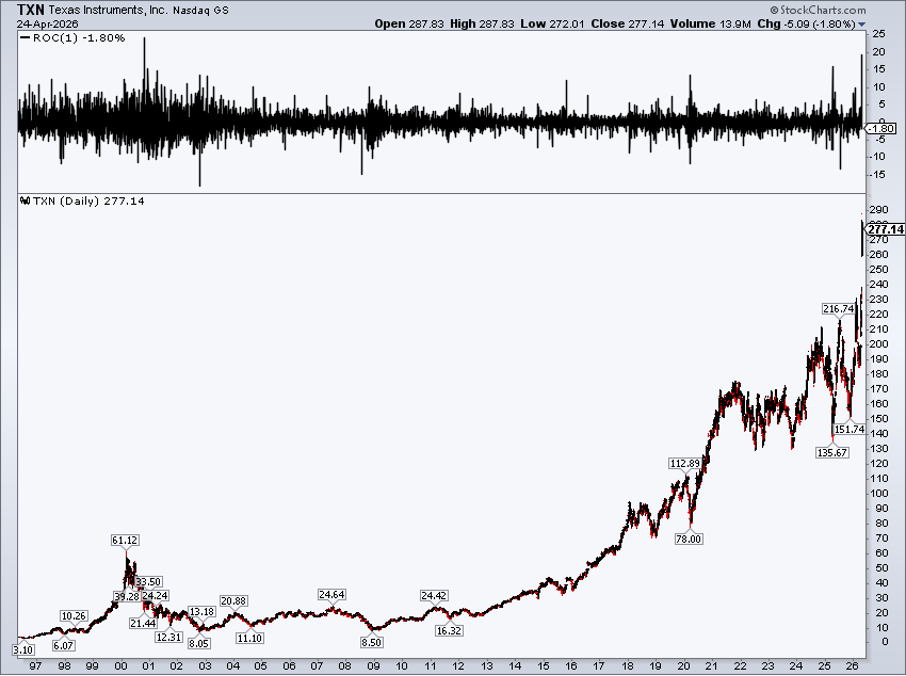
Intel’s (INTC) glory days have returned, up 75% m/m (including its strongest day since October 1987 last week); Texas Instruments (TXN) tallied its best earnings reaction since the year 2000, up by more than 40% m/m; and even Marvell (MRVL) has sprung to record highs after periods of intense volatility in recent years.
A Rally Echoing the Dot-Com Era
$SOX scored a 41% four-week advance through last Friday, with TXN and INTC putting the exclamation point on semiconductors’ best rally since the March 2000 dot-com bubble peak. It leaves traders wondering if this is a blow-off top in what has been the darling trade of the bull market that is now three and a half years old.
Consider that $SOX printed 3388 just 12 months ago at its post-Liberation Day low; it settled last week at 10,514 (and traded higher in the pre-market on Monday, April 27, as of this writing). From late 1998 to March 2000, it increased by more than sevenfold, from 183 to 1362 (then crashed to 209 by late 2002).
NVIDIA’s Breakout: Quiet but Critical Leadership
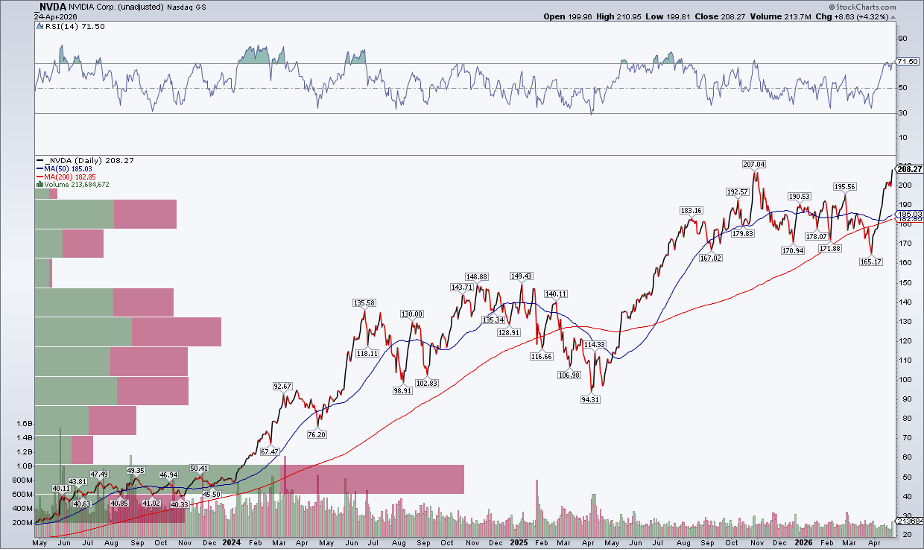
One chart makes me lean bullish on $SOX, despite the parabolic recent chart. Specifically, NVIDIA notched its first record high since October last Friday. The gain was somewhat stealthy, given all the focus on the broader industry index and the fantastic moves of some legacy semiconductor stocks. I look for bullish confirmation this week from the world’s most valuable company (which is also more than 10% of the $SOX Index).
Recall that NVDA shares fell to a $165 closing low on March 30, which was the weakest print since July 2025. It proved to be a false breakdown, though, and, as technicians like to say, “from false moves come fast moves in the opposite direction.” Indeed, a 26% rally ensued, and NVDA quickly reclaimed its still-rising long-term 200-day moving average. The upshot: It’s hard to be bearish on chip stocks when the most important name has just scaled new heights.
Ignoring Macro Noise: Chips Lead the Market Higher
Leave it to a chartist to be bullish on a group that’s on a record winning streak, right? But as a market technician, it’s also important to take intermarket and macro signals from the historic $SOX rally.
It has been easy for individual traders to get bearish and stay doubtful of the S&P 500’s ascent to new all-time highs, given the conflict in Iran and rising oil prices. But the Philadelphia Semiconductor Index’s vertical rise perhaps indicates that the war and energy prices simply carry little weight compared to the AI mega-trend. While a pullback and consolidation of the nearly 50% $SOX rally is possible, the chip bull market just keeps fueling global equities.
A Pause May Be Needed
An $SOX slowdown would be healthy. Sure, the Index fell by more than 16% from its February high to the March low, but bulls may grow antsy about a parabolic move. The thing is, with the $SOX daily chart, there are few sizable gaps. Rather, there has been remarkable intraday buying, as evidenced by white candles (daily closes significantly above the open). The major gap is way down at 8004, which would require a 20%-plus plunge from last week’s close.
Of course, we don’t have to endure massive losses for the froth to come off. The current 85 RSI reading and 48% departure from the 200-day moving average can also correct through time. (The October–March stretch was a case in point: $SOX’s price-to-earnings ratio remains 30% below its Q4 2025 zenith.) But will dip-buyers be given such a chance to “BTD” soon? Calendar trends suggest maybe not.
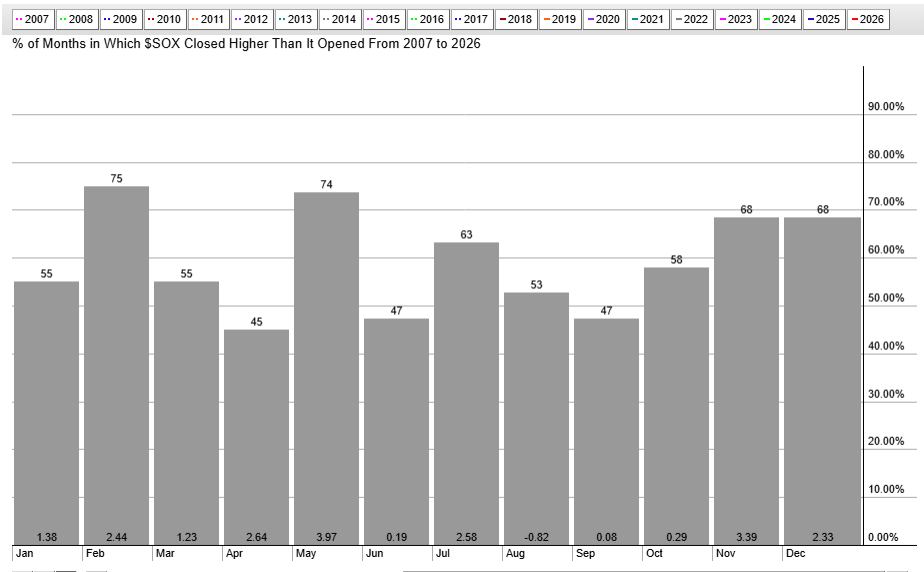
Seasonality Favors More Upside... For Now
$SOX is about to begin its most bullish month. In the last 13 years, the lone blemish was May’s 2019 17% decline. The average return is 4% since 2010, and the same goes for the past 20 years. June is a different story, up just 9 of the past 19 instances to wrap up the first half.
As always, seasonality is a secondary indicator to price.
Risk Events on Tap
In the here and now, be on the lookout for volatility this week, with KLA Corp (KLAC) and Qualcomm (QCOM) posting quarterly results. AMD (AMD) and ARM Holdings (ARM) report next week, along with NVIDIA, presenting at the GEOINT Symposium 2026 in early May.
AMD and Intel Annual General Meetings are scheduled for May 13, another key date to mark on your calendar. NVIDIA earnings don’t come until Wednesday, May 20.
The Bottom Line
Chip stocks overshadow the war in Iran and $100 oil. The torrid rally of 18 straight trading days is one for the books, and it leaves the Philadelphia Semiconductor Index (and the VanEck Semiconductor ETF (SMH)) in extreme overbought territory. Plenty of volatility catalysts are on tap this week, putting chip bulls to the test.