The Best Five Sectors This Week #73
Key Takeaways
- The S&P 500 gained 2% for the week, with Technology leading but showing signs of slowing momentum.
- Health Care jumped from ninth to sixth place, while Energy and Utilities slipped in sector rankings.
- Financials and Health Care are entering the "improving" quadrant on the weekly RRGs, signaling improvement.
- Industrials and Materials show subtle strength, while real estate remains in a consolidation phase.
The S&P 500 ($SPX) wrapped up the week ending July 3rd with a solid 2% gain following a holiday-shortened trading schedule. As the index climbed, some rotation was happening beneath the surface. With the composition of the top-5 unchanged, the shifts happened in the bottom of the ranking.
Technology remains firmly in the lead, with Industrials and Real Estate holding steady at second and third. Materials and Financials round out the top five, making it feel like the same group of friends at the head of the table week after week. However, don’t be fooled; the movement is starting to take shape just below the surface.
Health Care, which had been lagging, made a notable jump from ninth to sixth place in just one week. Utilities slipped down a notch, and Energy dropped from seventh to ninth. Consumer Staples remain quietly in eighth place, while Consumer Discretionary and Communication Services continue to bring up the rear.
- (1) Technology - XLK [59%]
- (2) Industrials - XLI [13%]
- (3) Real Estate - XLRE [3%]
- (4) Materials - XLB [3%]
- (5) Financials - XLF [21%]
- (9) Health Care - XLV*
- (6) Utilities - XLU*
- (8) Consumer Staples - XLP
- (7) Energy - XLE*
- (10) Consumer Discretionary - XLY
- (11) Communication Services - XLC
Weekly RRG
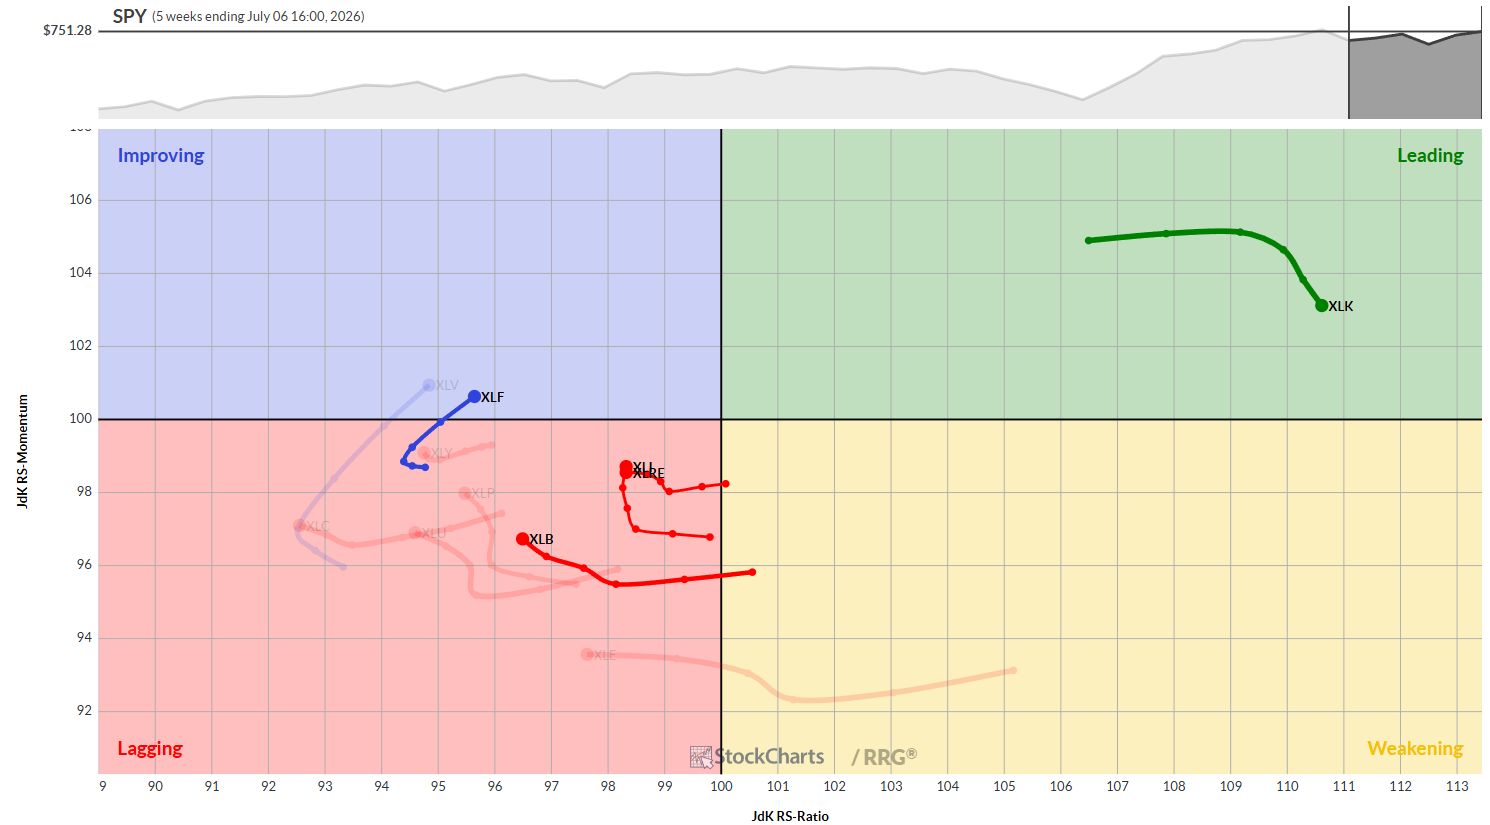
On the weekly RRG, Technology stands alone in the leading quadrant, a single bright spot on the right, with all other sectors clustered on the left. It remains an unusual sight.
There’s movement, though. Financials and Health Care have both entered the “improving” quadrant, signaling potential leadership ahead. Financials, in particular, are gaining momentum. Meanwhile, Materials, Industrials, and Real Estate are still lagging but showing early signs of life, with Industrials leading that mini-pack.
Daily RRG
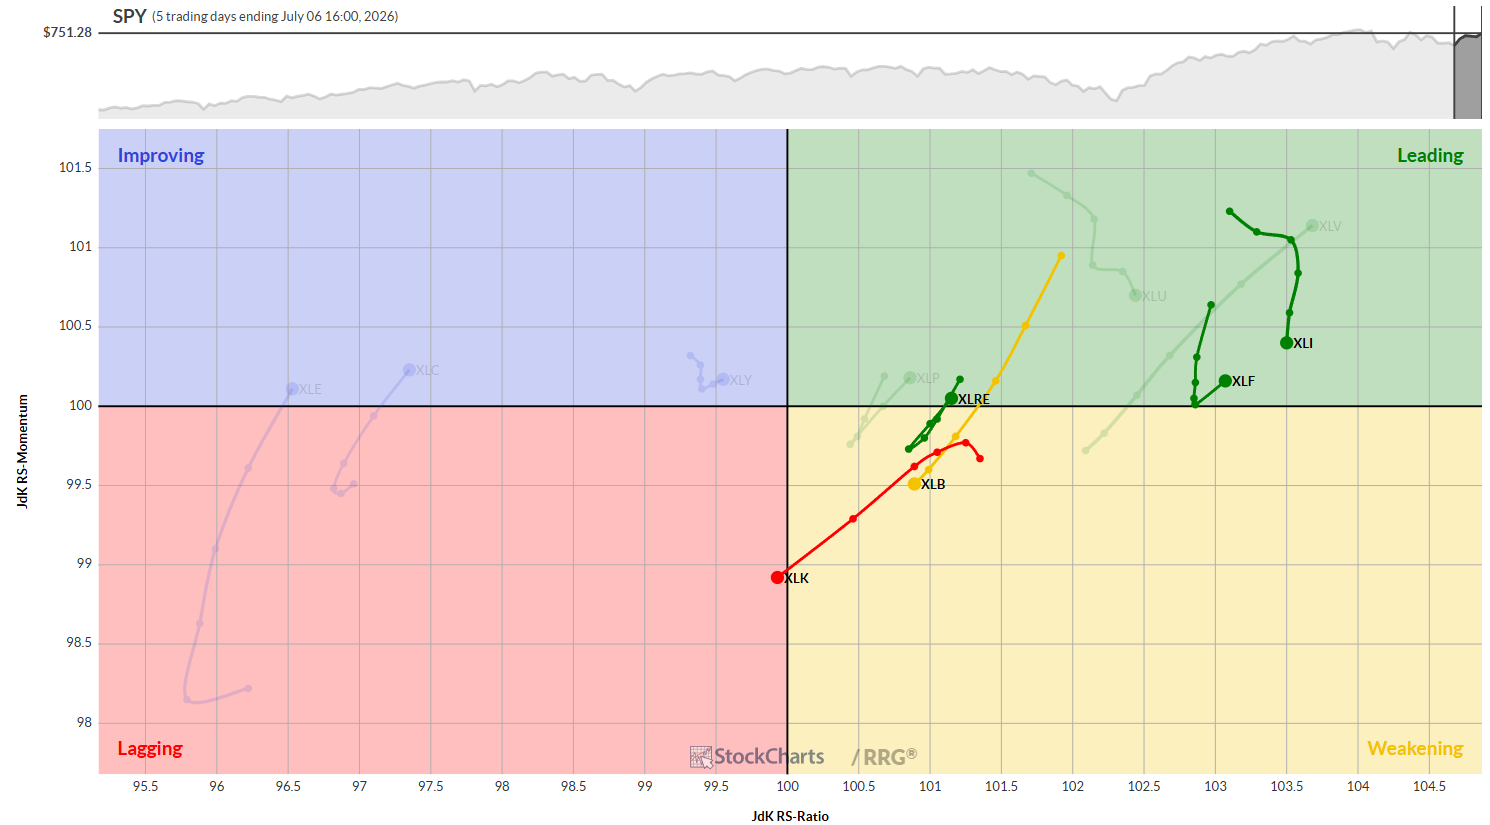
The daily RRG paints a more complex picture. Technology, despite its weekly strength, is now accelerating into the lagging quadrant. It sounds contradictory, but the strategy here blends daily and weekly RRG values. Technology’s weekly strength keeps it at the top, even as daily momentum wobbles.
Materials is slipping into the weakening quadrant, losing steam. Real Estate and Financials are perking up, moving back up with positive momentum. Industrials remains in the leading quadrant but is starting to lose some relative momentum.
Sector Highlights
Technology
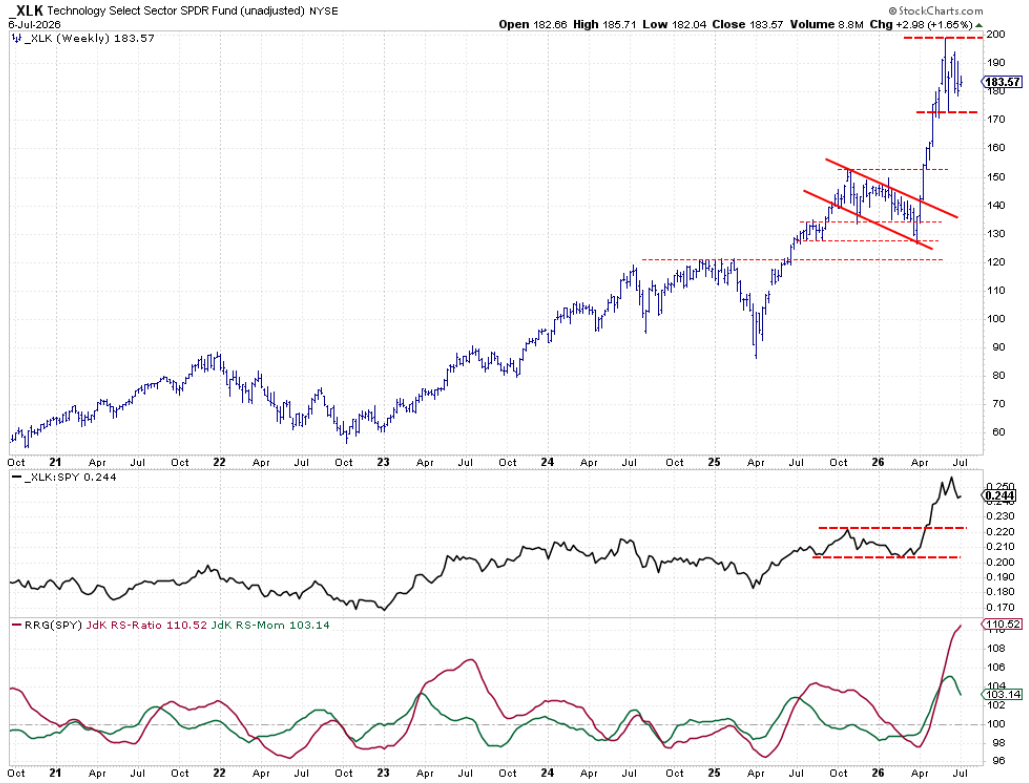
The Technology sector’s chart remains largely unchanged. Prices are consolidating sideways within the consolidation pattern. Is this a triangle in the making? Relative strength is high, but the RS momentum line is starting to roll over, signaling a slowdown in outperformance. It looks like XLK needs a little more time to digest the recent rally.
Industrials
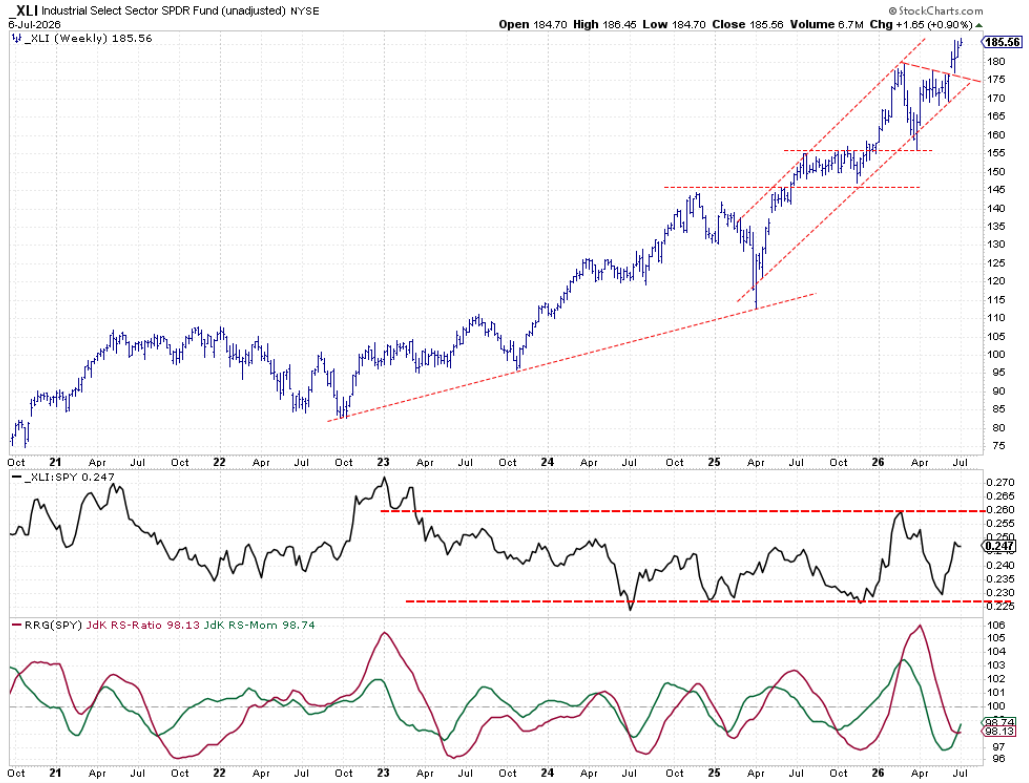
Industrials is making steady progress. After breaking out of a triangle pattern, it’s moving higher within a rising channel. With relative strength in the middle of its range and RS-momentum curling back up, the RS-ratio is about to be pulled higher as well. More improvement seems to be around the corner.
Real Estate
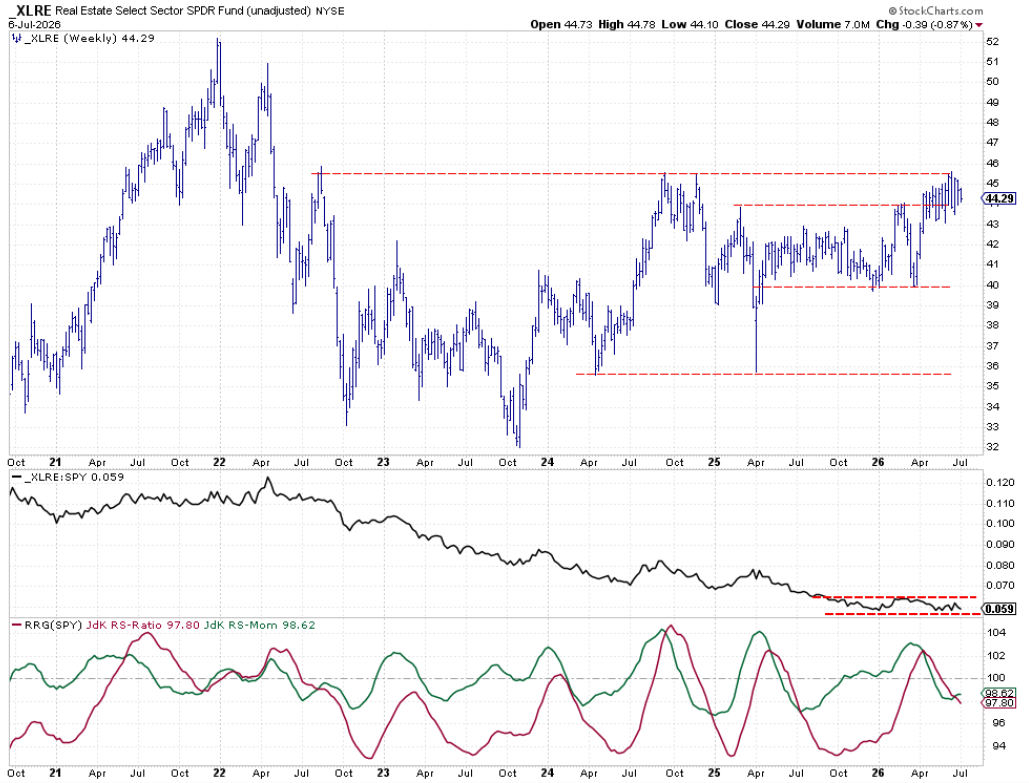
Real Estate continues to battle resistance around 4550, with solid support near 4350. The raw RS is stuck in a narrow range after a long decline since 2022. The RS-momentum line is finally moving up, though it's still below 100, and the RS-ratio line is dropping more slowly. If RS-momentum continues to improve, it could eventually turn things around.
Materials
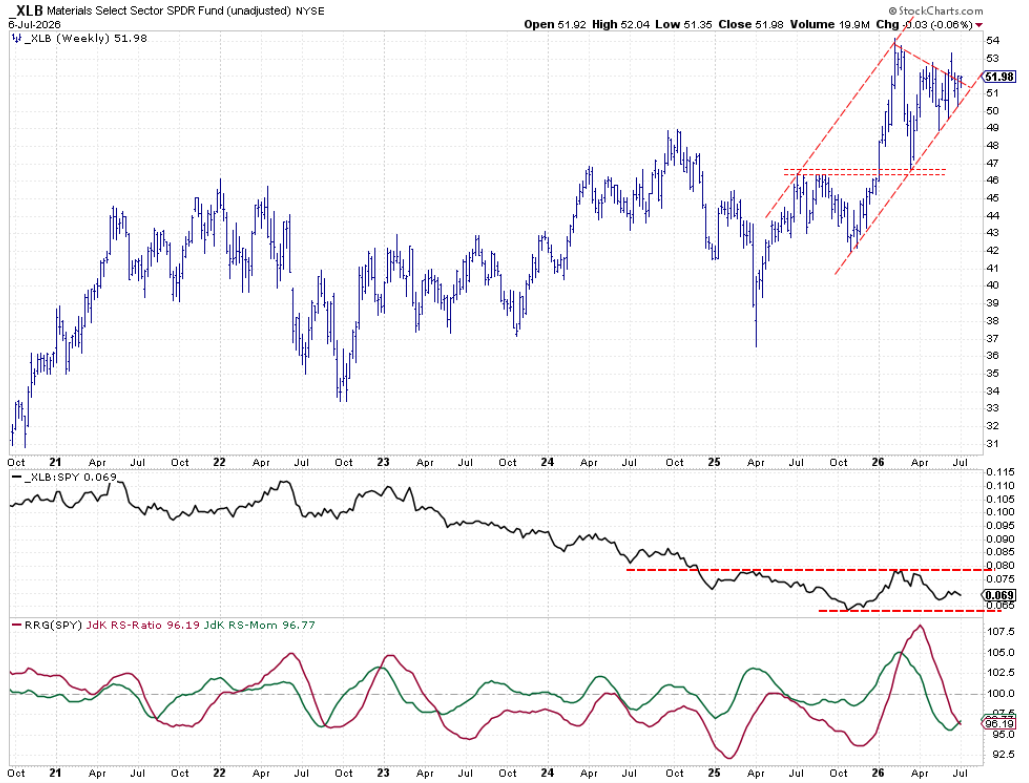
Materials is making another attempt to break out of its consolidation triangle. Relative strength is moving sideways, and relative momentum is starting to curl up. It just needs a bit more upward push to get the RS-ratio line moving in the right direction.
Financials
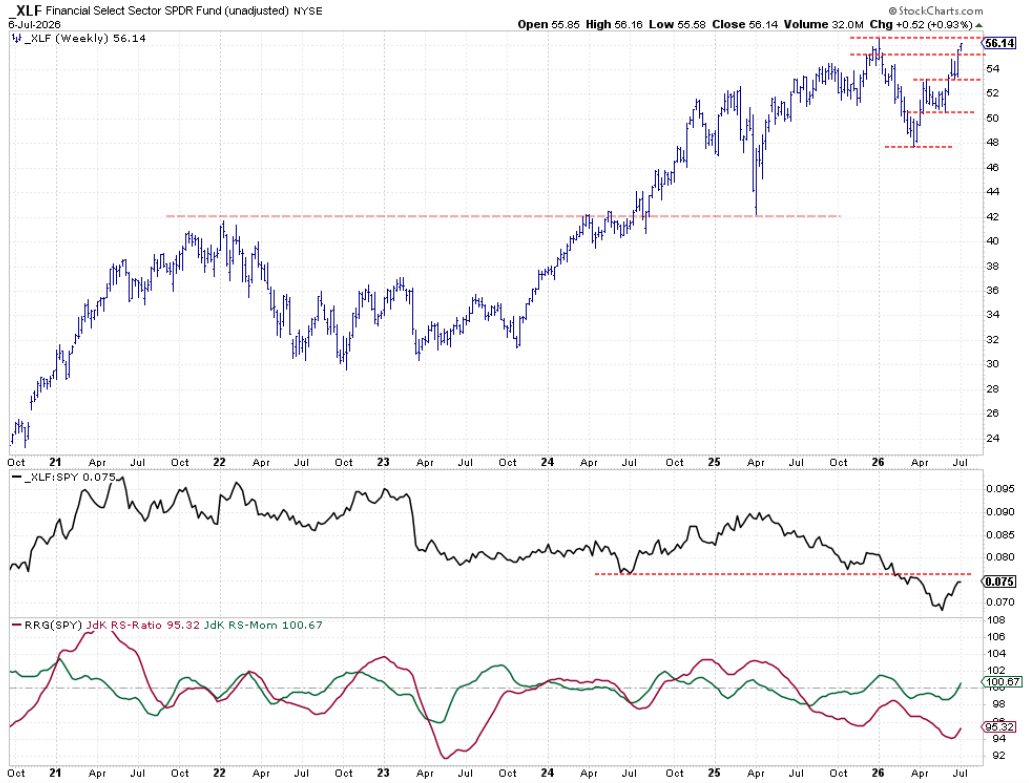
Financials is the newest member of the top five and is making its presence felt. The price chart is moving higher, clearing another resistance level and now eyeing the recent high around 5650. The raw RS line is approaching an old support level, which could act as resistance. If strength breaks above that level, expect further relative improvement. The RS-momentum line just crossed above 100, pulling the RS ratio line along and putting XLF’s “tail” in the improving quadrant.
Portfolio Performance

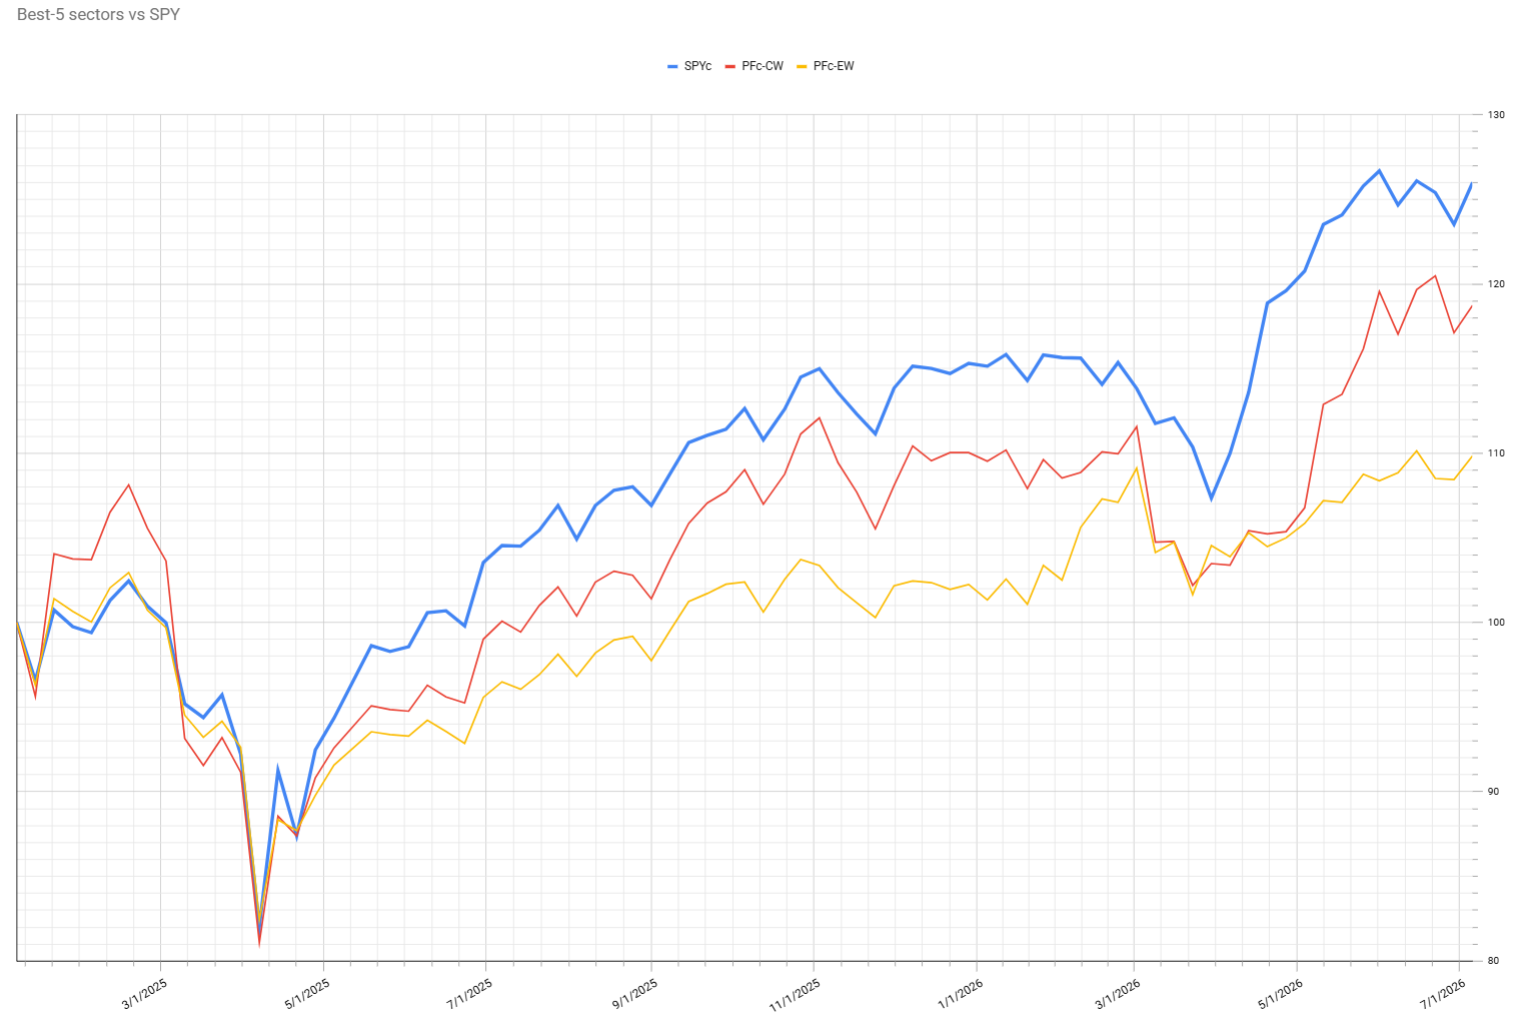
Portfolio performance is holding steady compared to last week but remains about 6% behind the S&P 500 since inception. It’s not ideal, but sometimes that’s the cost of sticking with a particular strategy, especially in a market where technology is running so far ahead of the pack.
#StayAlert, -Julius