Beyond the Big Banks: Where Financial Stocks are Finding Their Next Rally
Key Takeaways
- Financials sector emerges as one of the market’s strongest sectors, with banks, insurers, and credit card companies outperforming.
- Bank earnings kick off next week, but technical trends suggest opportunities extend well beyond the major lenders.
- Insurance stocks, payment networks, and select financial services names feature notable absolute and relative strength.
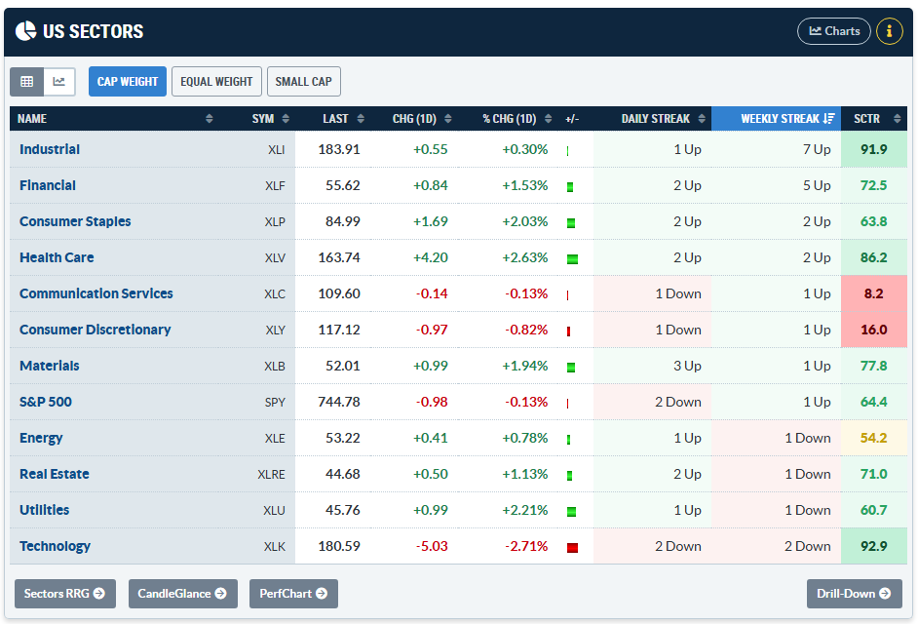
Traders had plenty to grapple with last week. The turn of the half brought about intense momentum selling, and last Thursday’s jobs report cooled expectations for an imminent Fed rate cut. All the while, non-tech areas kept working. Over the past month, Health Care and Financials have been the leaders, with Industrials, Utilities, Consumer Staples, and Real Estate all posting material alpha relative to the S&P 500 ($SPX).
Broadening appears to be on pause as we enter the first full week of the second half. Semiconductors and the AI trade are on the rebound, following the iShares Momentum Factor ETF’s (MTUM) worst two-day slide since April 2025 ahead of the long weekend.
Within the cyclical/value trade, Industrials has been higher for seven straight weeks coming into Monday, while Financials sports a five-week winning streak (pictured below from StockCharts’ Market Summary). The former group is creeping up on Information Technology for the top S&P 500 sector ETF SCTR score; the latter is gearing up for Q2 earnings, which begin on Tuesday next week.
Banks Enter Earnings With Momentum
Banks, specifically, are on a heater. The SPDR S&P Bank ETF (KBE) reached an all-time high last Thursday but then sold off into the close. Swing traders often turn nervous when the likes of JPMorgan Chase (JPM) and Bank of America (BAC) rally hard into earnings, as that kind of price action can set the bar high once quarterly numbers come in.
For now, though, KBE boasts absolute and relative strength leading into the Q2 reporting season. Is there more room to run? Let’s check it out.
Notice in the chart below that KBE is doing most of the right things. The equal-weight bank ETF has printed a series of higher highs and higher lows over the past two years, and the long-term 200-day moving average is on the rise, suggesting that the bulls control the primary trend. A new record level was tagged last week, which coincided with the RSI momentum oscillator at the top of the chart reaching 70, confirming the new price high.
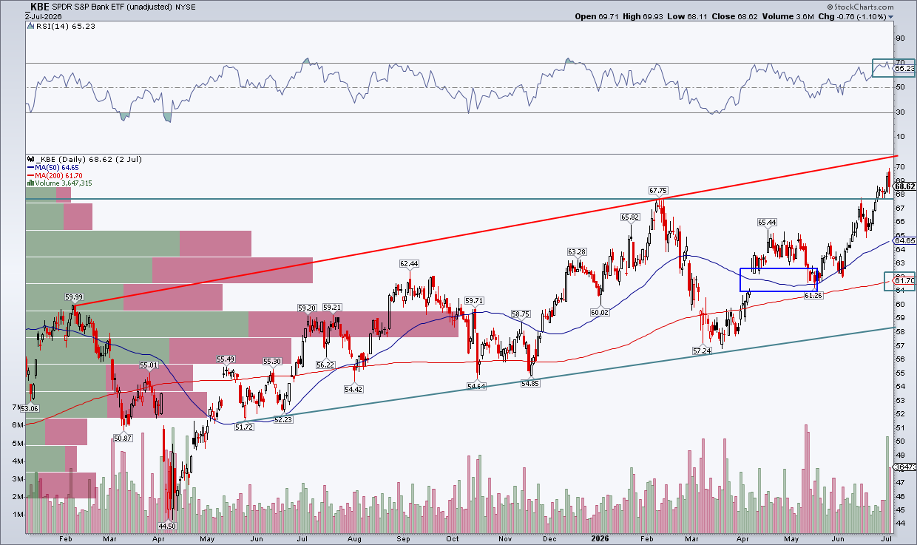
Even its pullbacks have been constructive. A gap in early April was filled with near precision before the bulls regained control. What’s more, an uptrend support line dating back more than a year is $10 below the current price. Zoom out, however, and KBE has steadily climbed over recent years... it hasn’t been a sideways chop followed by a clean breakout. Indeed, an uptrend resistance line enters the scene just above the local high.
In short, this is the classic run-up setup heading into earnings. While intermediate- and even longer-term bank technical trends look favorable, KBE’s rally from $62 in early June to pennies below $70 last week points to potential digestion ahead rather than an explosive additional rally.
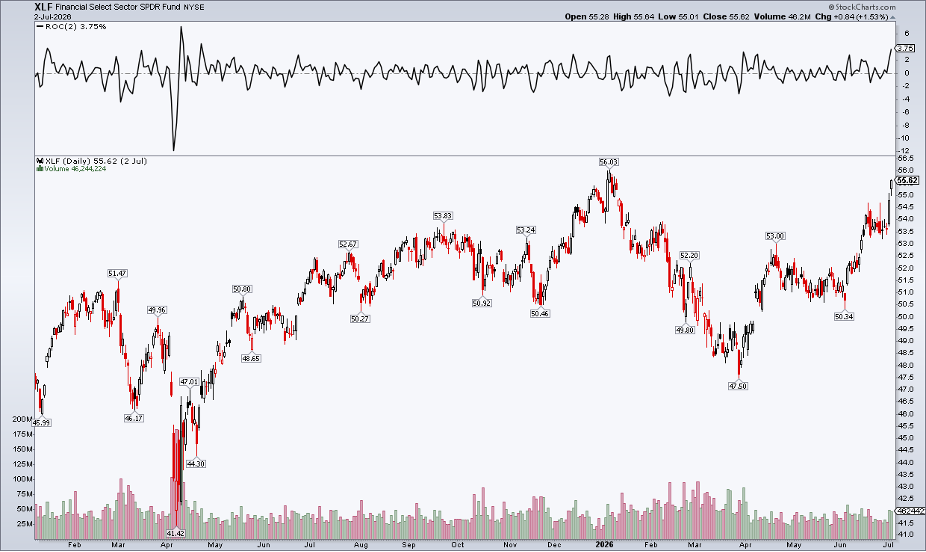
Of course, KBE houses mostly small- and mid-sized banks (given its equal-weight construct), and the broader, cap-weighted Financials Select Sector SPDR Fund (XLF) put together its best two-day gain since April 2025 to begin the second half.
The Real Leadership Isn't Coming From Banks
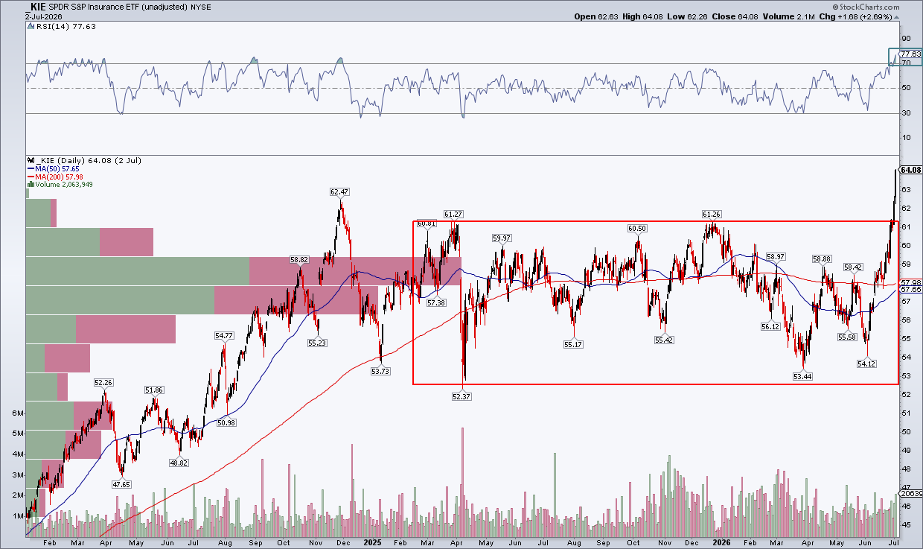
It’s easy to immediately center on the banks when digging into Financials, but that’s not where the most intense alpha has been. Since June 3, the SPDR S&P Insurance ETF (KIE) has soared 18%, with a 5% thrust to kick off July. Contrast KBE’s stair-step-higher pattern with KIE’s textbook upside breakout.
The advance triggered an upside measured-move price objective of about $70 based on the $9 trading range from late 2024 through much of June.
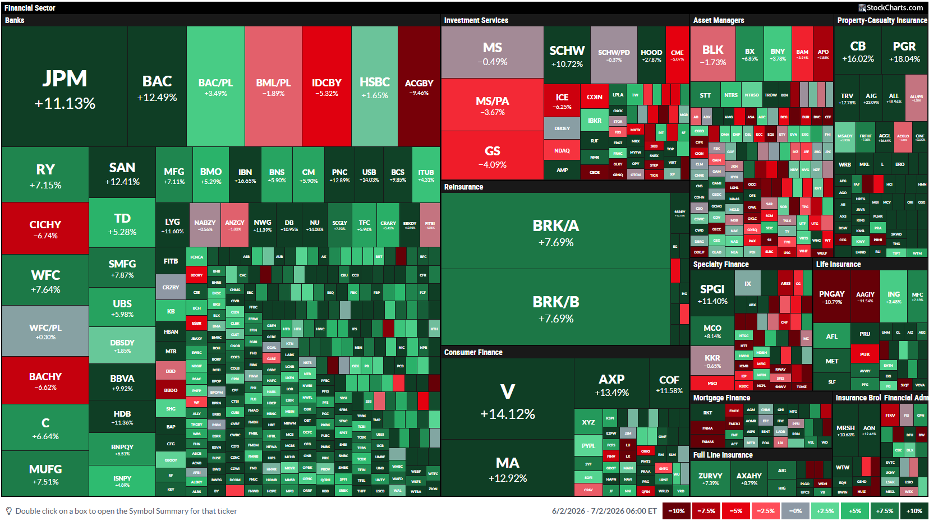
Another corner of the Financials sector ringing up profits for longs? Credit card names. Visa (V) and Mastercard (MA) lead XLF and the broader market as tech and AI take breathers. Shares of both blue chips are up almost 15% over the past month.
The big banks report next week, but traders have time to prepare for Visa and Mastercard earnings, which don’t arrive until July 28 and 30 respectively.
Watch Wall Street's Weakest Links
Conspicuously red on the Financials sector's one-month performance heat map are the companies most linked to Wall Street. Goldman Sachs (GS) is off 4% month over month through last Thursday, and Morgan Stanley (MS) is fractionally negative over that span.
These could be the early earnings season opportunities, but their charts must be monitored. The two capital markets stocks have nearly identical patterns: GS has key support from $985 to $1,000, and MS must defend $205. Bearish head-and-shoulders topping patterns would come into play upon breaches of those levels.
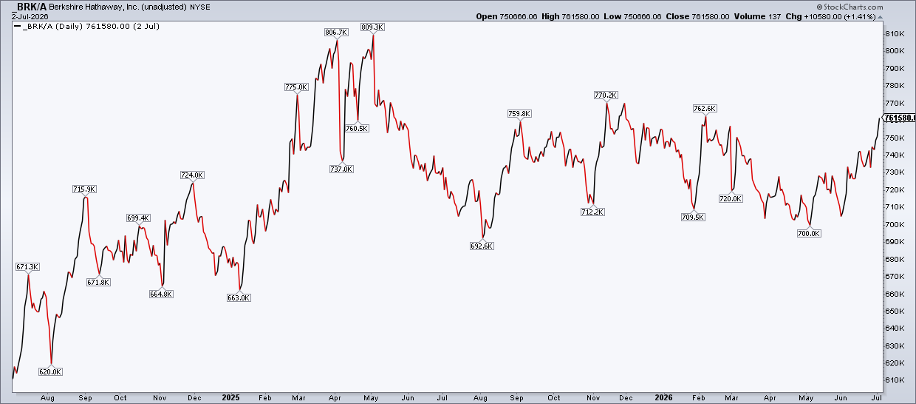
And we can’t ignore Berkshire Hathaway's (BRK/A) gain of almost 10% since early June. The insurance industry’s climb is a tailwind for the holding company, with a new CEO at its helm. Berkshire is less than 2% from a 52-week high, which flies under the radar amid the Street’s focus on AI and momentum.
The Bottom Line
There’s a lot going on in Financials. Big banks will garner a lot of attention in the coming sessions, with Q2 earnings season beginning on Tuesday, July 14. Hop around the sector, though, and you’ll find unheralded pockets of alpha. Not yet at 52-week highs, credit card stocks, insurance industry components, and Berkshire appear ready to lead.