The S&P 500's Coil Pattern Could Decide the Next Big Move

Think the S&P 500 is featuring a classic head-and-shoulders top pattern? Think again. We’re inclined to label the recent price action as a symmetrical triangle or “coil” pattern, a consolidation pattern that implies indecision.
Today, we’ll break down the nuances of this coil pattern, try to put the short-term market movements into proper long-term context, and discuss some potential next steps for the S&P 500 ($SPX).
Dissecting the S&P 500 Coil Pattern
An uptrend is formed by a pattern of higher highs and higher lows. A downtrend is distinct for having lower lows and lower highs. But a pattern of lower highs and higher lows represents a consolidation phase where buyers and sellers are essentially in equilibrium.
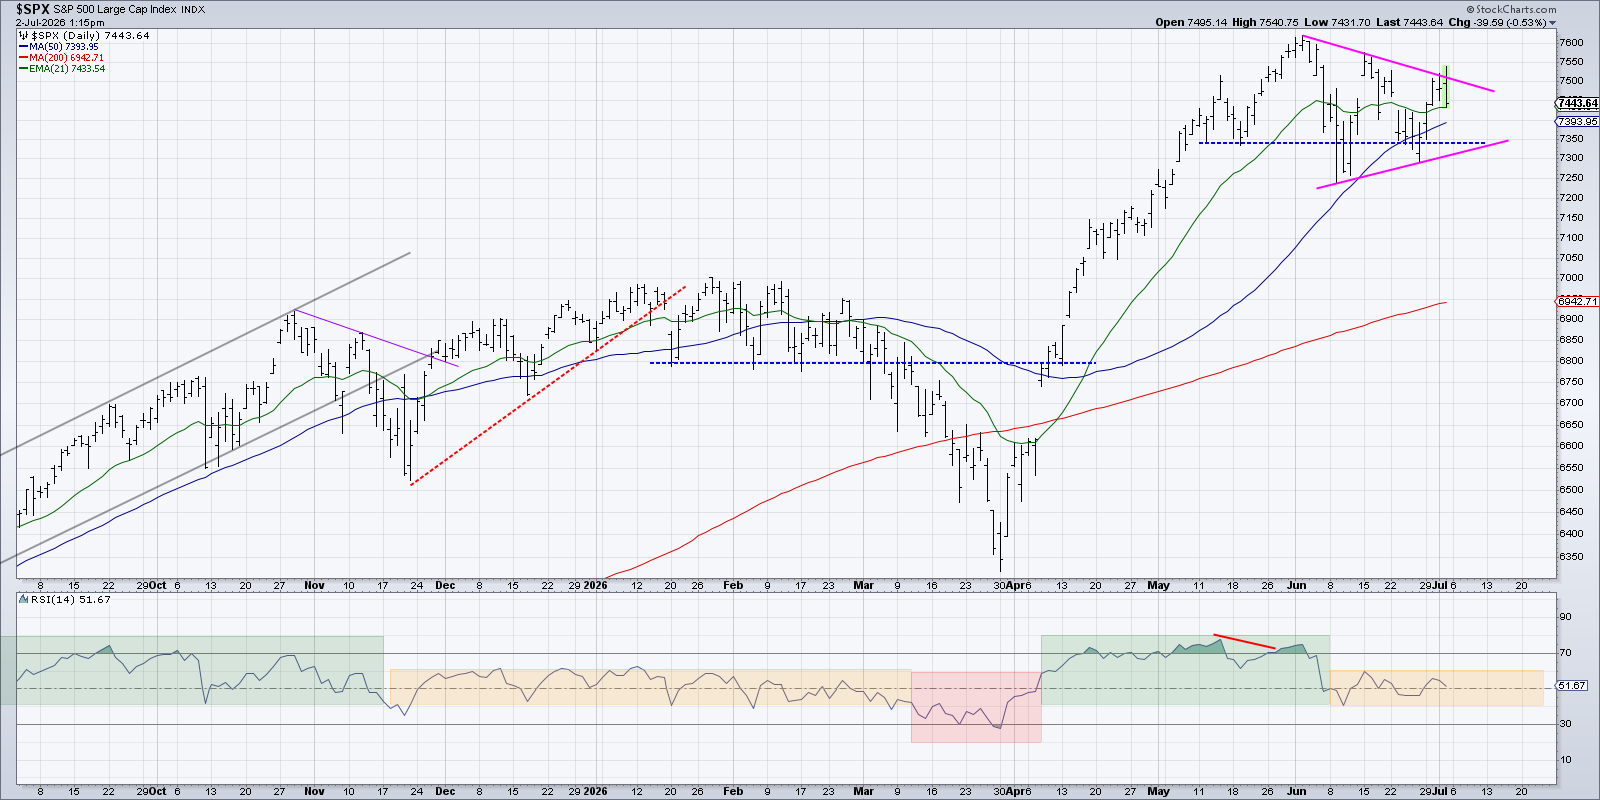
Trading this symmetrical triangle pattern is quite straightforward, as the pattern is essentially neutral until or unless the price breaks above the upper trendline or below the lower trendline. And given how the pattern has a natural termination pattern, one of those two things is going to happen!
It’s important to also consider momentum and perhaps volume for this pattern as well. Is a pattern breakout supported by stronger price momentum and heavier volume? If so, then the breakout most likely will lead to further momentum in that direction.
Using a Traffic Light Approach to Confirm Key Support Levels
While we wait for the coil pattern to be resolved, we can create a “traffic light visualization to try and formalize our interpretation of key price levels.
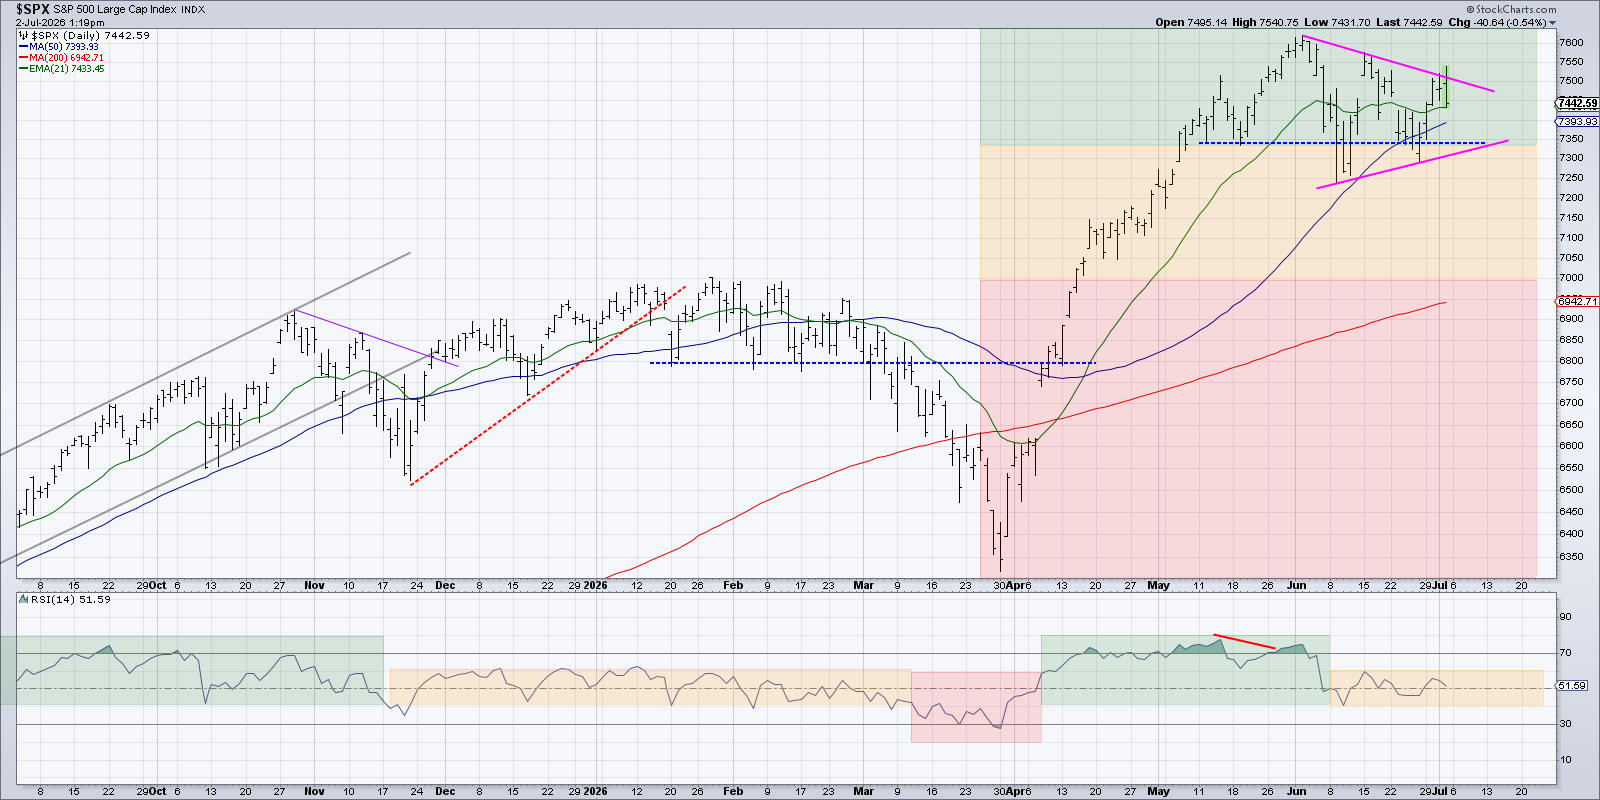
The trend in the S&P 500 has definitely evolved from a clear accumulation phase in April and May to more sideways action in June. If the SPX breaks below the 7340 level, that would complete a downside break of the coil pattern and indicate a lack of buying power. If it continues lower to around 6950-7000, that would mean a retest of the 200-day moving average for the first time since the March market low. And anything below the 200-day moving average tells us that the market has entered a full “risk-off” mode.
By visually representing those levels as shaded areas on our chart of the S&P 500, we can now see how the symmetrical triangle pattern fits into a larger assessment of trend and momentum.
Bringing Long-Term Vision to Short-Term Market Moves
To put this recent choppy pattern into proper long-term perspective, we often go to our Market Trend Model, a systematic approach to measuring trends on three different time frames.
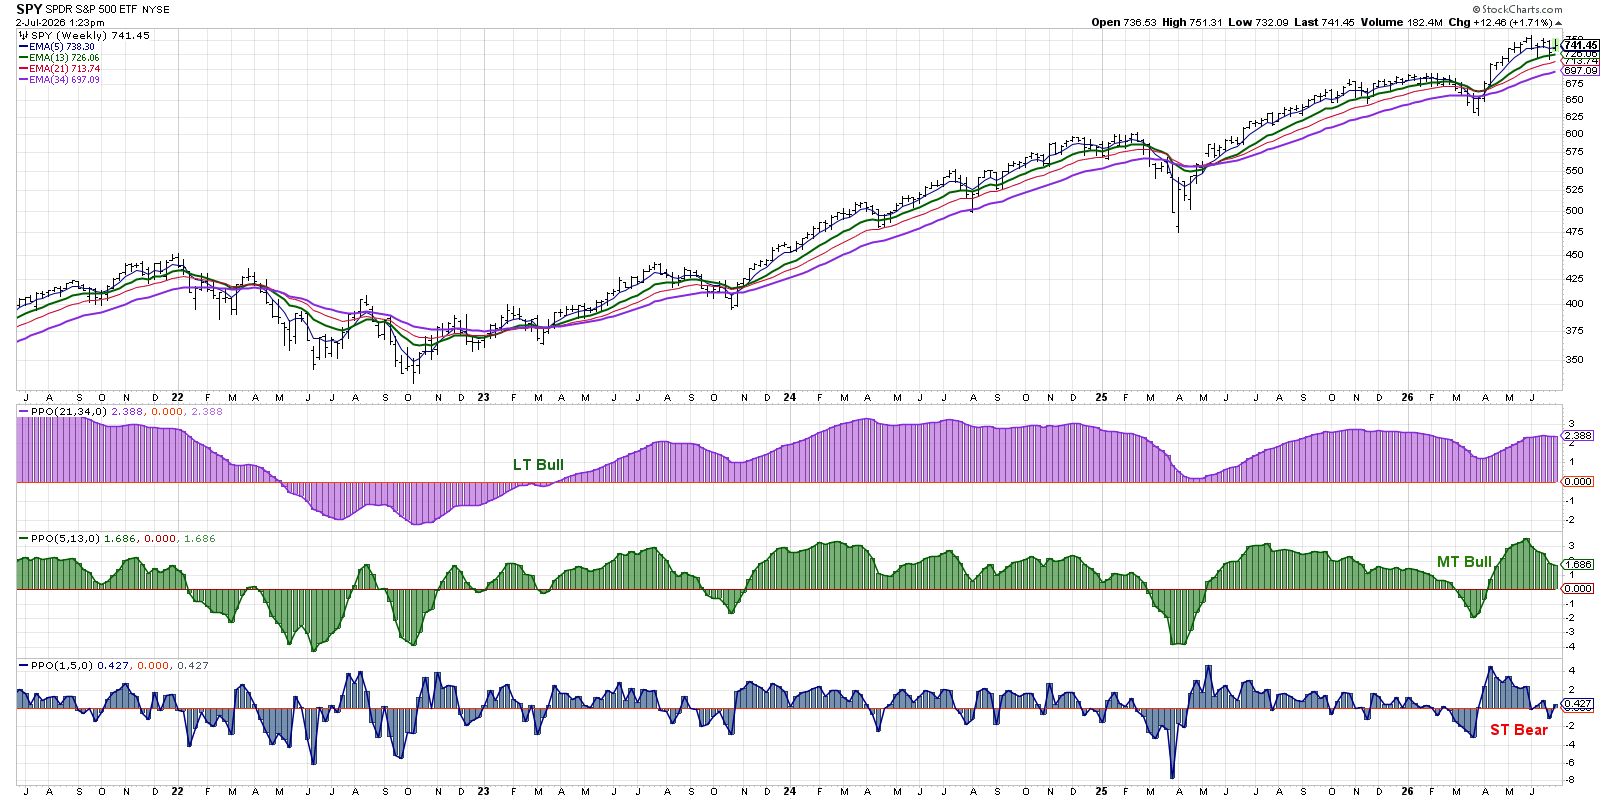
This change of momentum in June caused our short-term model to turn bearish for the second time since the March market low. Our medium-term and long-term models remain firmly in the bullish range. Based on that overall configuration, we’re inclined to consider this a short-term corrective move within the context of a longer-term accumulation phase. If and when the support levels outlined above are violated, though, that would likely cause our medium-term model to turn bearish. The two most recent signals from the medium-term model, in March 2026 and February 2025, ended up identifying key corrections during an otherwise strong bullish trend off the 2022 low.
The classic Edwards and Magee text on price patterns can be a valuable resource for identifying and interpreting price movements with more structure and discipline. And when the current coil pattern for the S&P 500 finally resolves, we should have a much clearer picture of market conditions going into Q2 earnings season in mid-July!
RR#6,
Dave
P.S. Ready to upgrade your investment process? Check out my free behavioral investing course!
David Keller, CMT
President and Chief Strategist
Sierra Alpha Research LLC
marketmisbehavior.com
https://www.youtube.com/c/MarketMisbehavior
Disclaimer: This blog is for educational purposes only and should not be construed as financial advice. The ideas and strategies should never be used without first assessing your own personal and financial situation, or without consulting a financial professional.
The author does not have a position in mentioned securities at the time of publication. Any opinions expressed herein are solely those of the author and do not in any way represent the views or opinions of any other person or entity.