Fibonacci Retracement: Finding the Levels That Matter Most

Fibonacci Retracements can provide a clear structure with which we can more efficiently identify support and resistance levels. By focusing on key percentage relationships between two extreme prices, we can develop a game plan based not simply on price trends as they evolve but also on respecting price levels where short-term reversals often occur.
So how do we identify the correct price levels to use to create this “Fibonacci framework” to put the price swings into proper perspective? Today, we’ll look at two specific examples, NVIDIA (NVDA) and Adobe (ADBE), and demonstrate how we can focus on pivotal turning points to create a meaningful structure and anticipate turning points before they occur.
I recently told viewers of my daily market recap show that NVIDIA’s chart may represent the clearest illustration of Fibonacci Retracements I’ve ever seen. A quick review of the charts shows that the rally off the March lows provides a perfect starting point for our analysis.
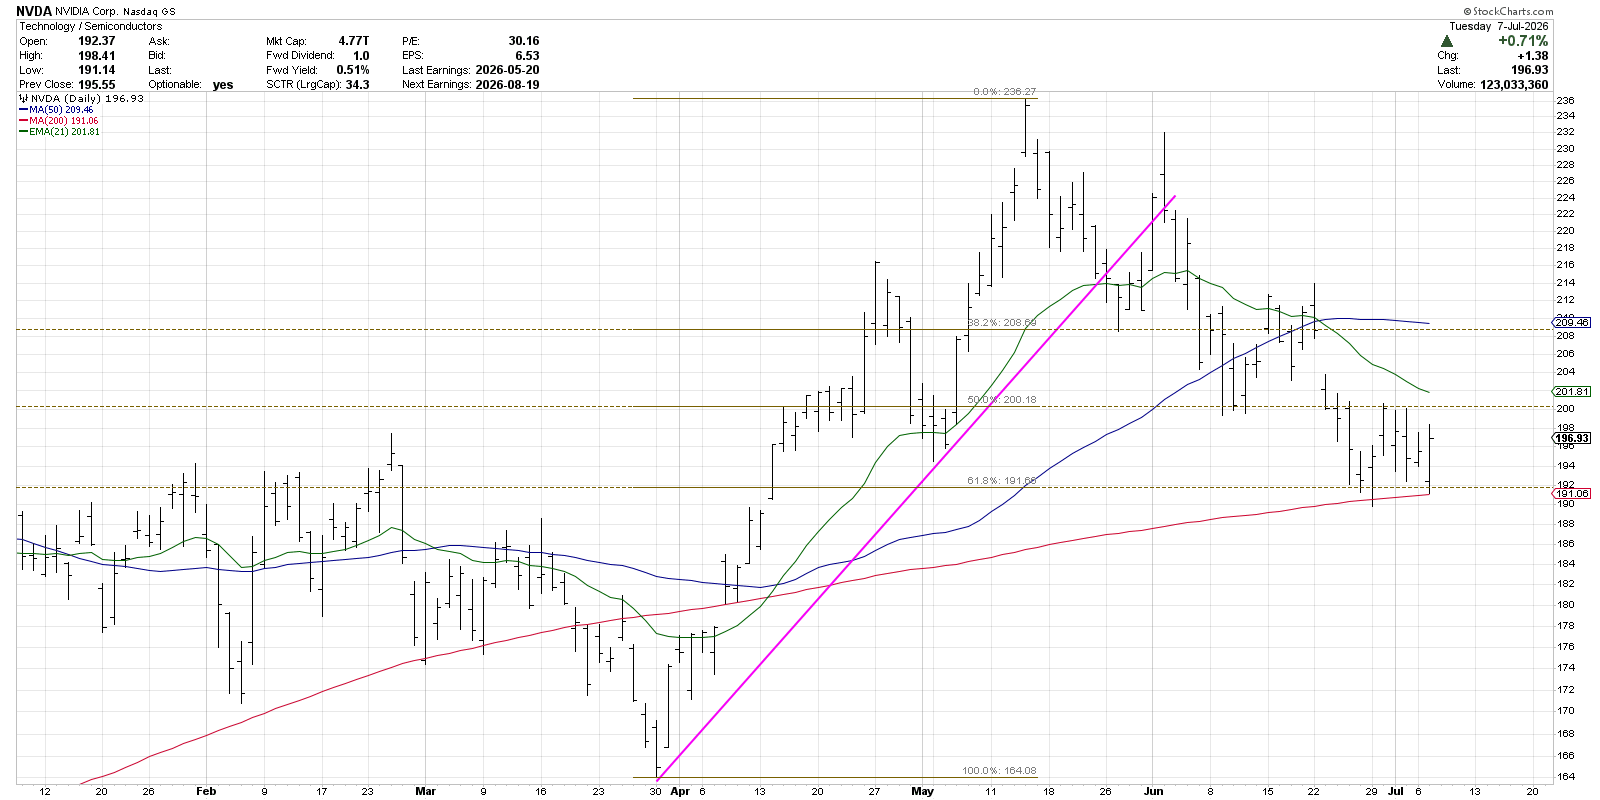
From the March 30th low at $164 to the peak in May around $236, NVDA reversed into a downtrend phase. Soon after that May peak, the price broke below the 21-day exponential moving average, as well as a trendline connecting the major swing lows since the end of March.
This breakdown of initial price support levels is the type of move that compels me to open the Annotations tool and apply Fibonacci Retracements to the chart. This allows us to identify initial support at the 38.2% retracement level around $209. By mid-June, NVDA bounced off both the 38.2% and 50.0% retracement levels before eventually breaking down to the 61.8 % level toward the end of the month.
Now we can see that NVDA is indeed testing the final Fibonacci level, which also happens to coincide with the 200-day moving average. If NVDA can hold this “confluence of support”, then a recovery and perhaps even a new accumulation phase could begin. However, a break of this key support level would suggest a retest of the March low around $164.
While Nvidia presented clear high and low prices to use for the Fibonacci Retracements due to its recent rotation, the chart of Adobe has been in a downtrend phase for over two years. And when there have been a number of swing highs on the way down, how do we know which ones to select to set up the Fibonacci Retracements?
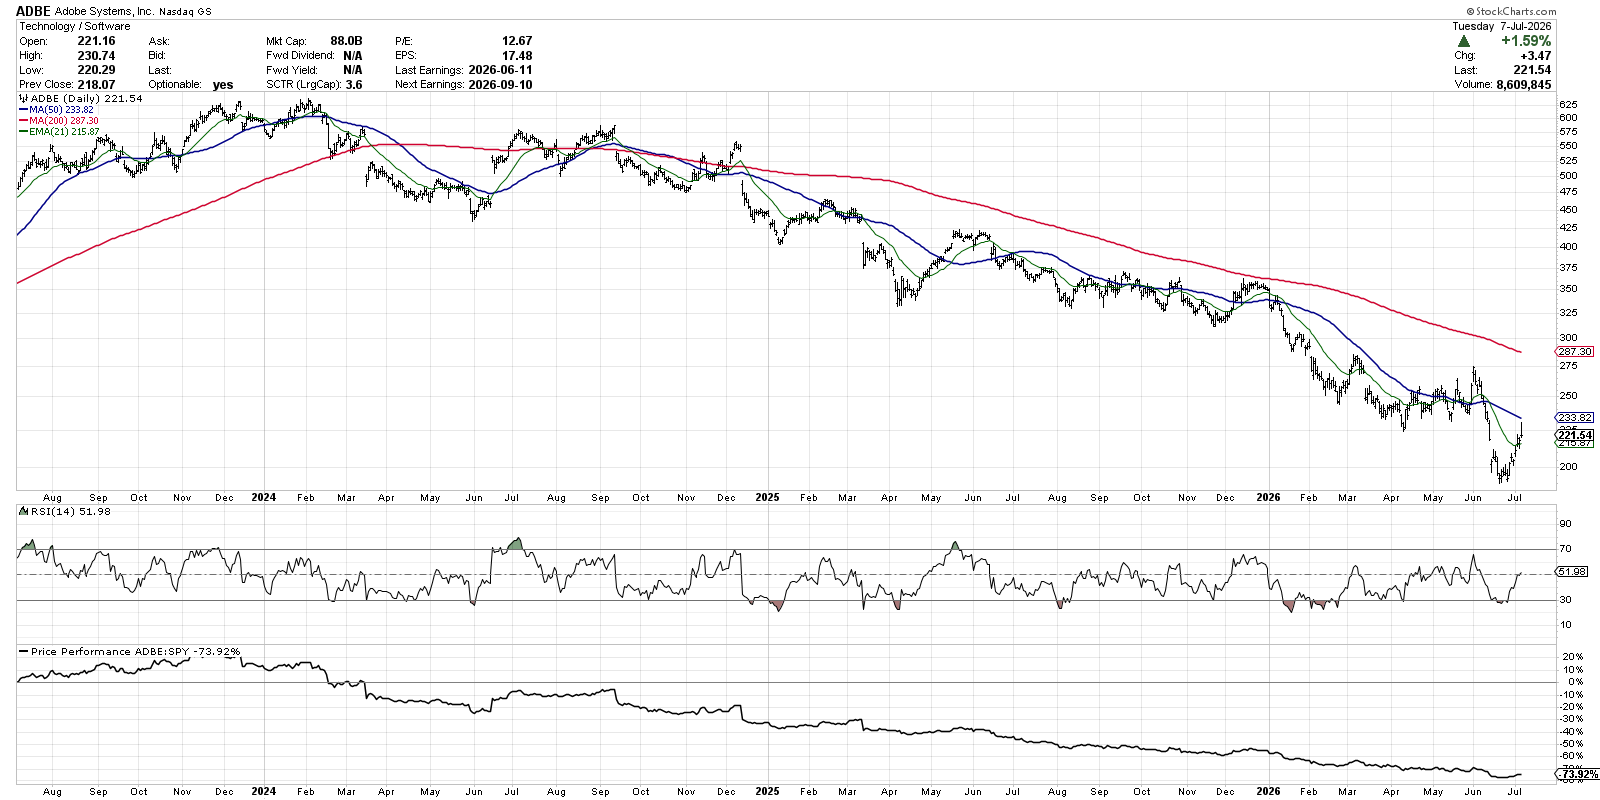
For this sort of chart, we want to consider our own timeframe. Are we trying to identify short-term price reversals, as part of a swing trading strategy? Or are we looking for longer-term price objectives as part of some larger reversal in price action?
For the swing trading timeframe, I’d zoom way in with a six-month chart to focus on the upswing after the June selloff. Here, we can identify an initial upside target around $223 off the June low around $190. ADBE just reached that initial price objective this week, with a “gravestone doji” candle perhaps confirming a pullback from this resistance level.
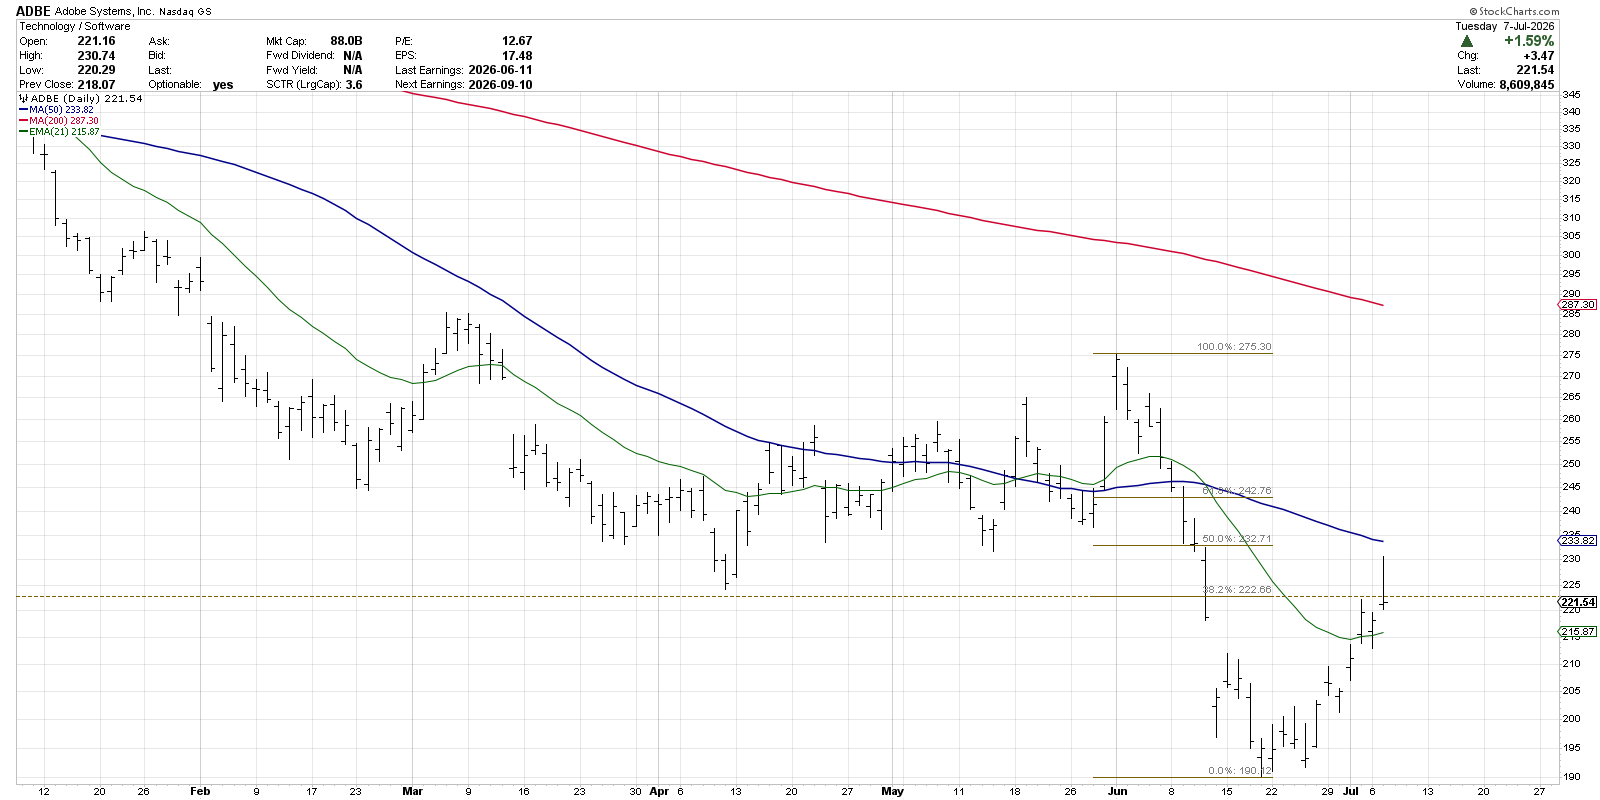
Bringing in a full year of price history allows us to recognize how the recent upswing is just an initial upturn following a long-term downtrend for Adobe. During a more protracted distribution phase like this one, I’ve found that identifying significant price swings is as simple as reviewing the chart for significant turning points.
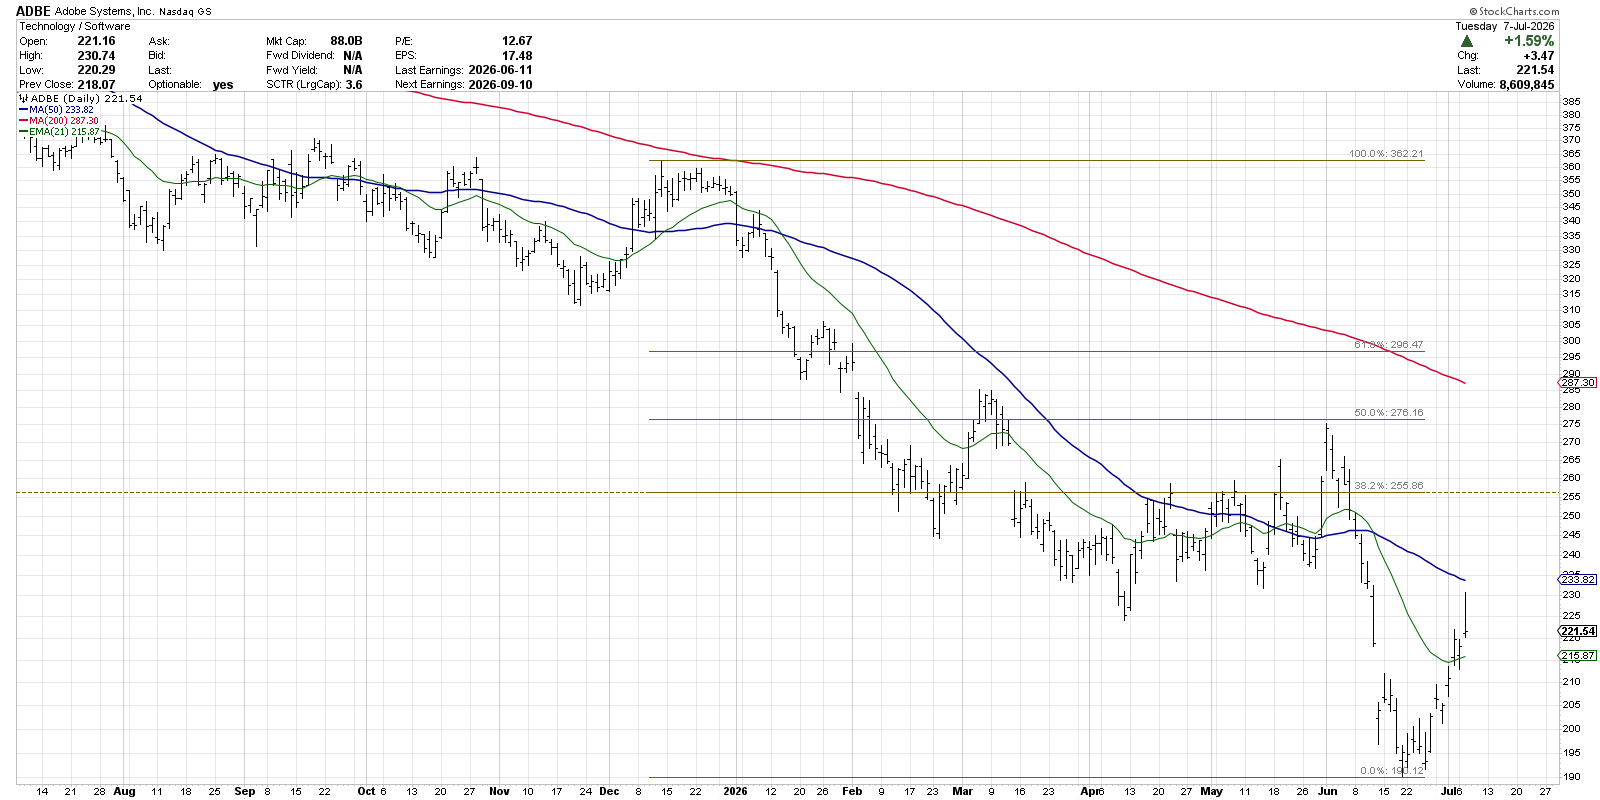
For ADBE, I’m seeing August through December of last year as more of a sideways trend, with consistent resistance around in the $360–370 range. By using the December swing high, the final peak before the big downward surge in January, we can create a longer-term Fibonacci framework to yield an initial upside target of around $256.
In this case, that 38.2% Fibonacci level also happens to line up well with previous swing highs in April and May. So if Adobe were to break above the 50-day moving average, clearing our short-term target from the previous chart, then perhaps this longer-term framework could help us identify a more appropriate medium-term price objective.
Fibonacci Retracements don't predict where a stock must reverse; they simply highlight the price levels where a reversal is most likely to occur. Combined with trend and momentum analysis, they can provide a disciplined framework to anticipate key turning points instead of reacting to them.
One final note… this article was derived from a viewer question on our latest “all-mailbag” edition of CHART THIS with Dave Keller. Check out the video for other great questions and helpful insights on all the charts!

RR#6,
Dave
P.S. Ready to upgrade your investment process? Check out my free behavioral investing course!
David Keller, CMT
President and Chief Strategist
Sierra Alpha Research LLC
marketmisbehavior.com
https://www.youtube.com/c/MarketMisbehavior
Disclaimer: This blog is for educational purposes only and should not be construed as financial advice. The ideas and strategies should never be used without first assessing your own personal and financial situation, or without consulting a financial professional.
The author does not have a position in mentioned securities at the time of publication. Any opinions expressed herein are solely those of the author and do not in any way represent the views or opinions of any other person or entity.