The Great Rotation Continues as Financials Take the Lead

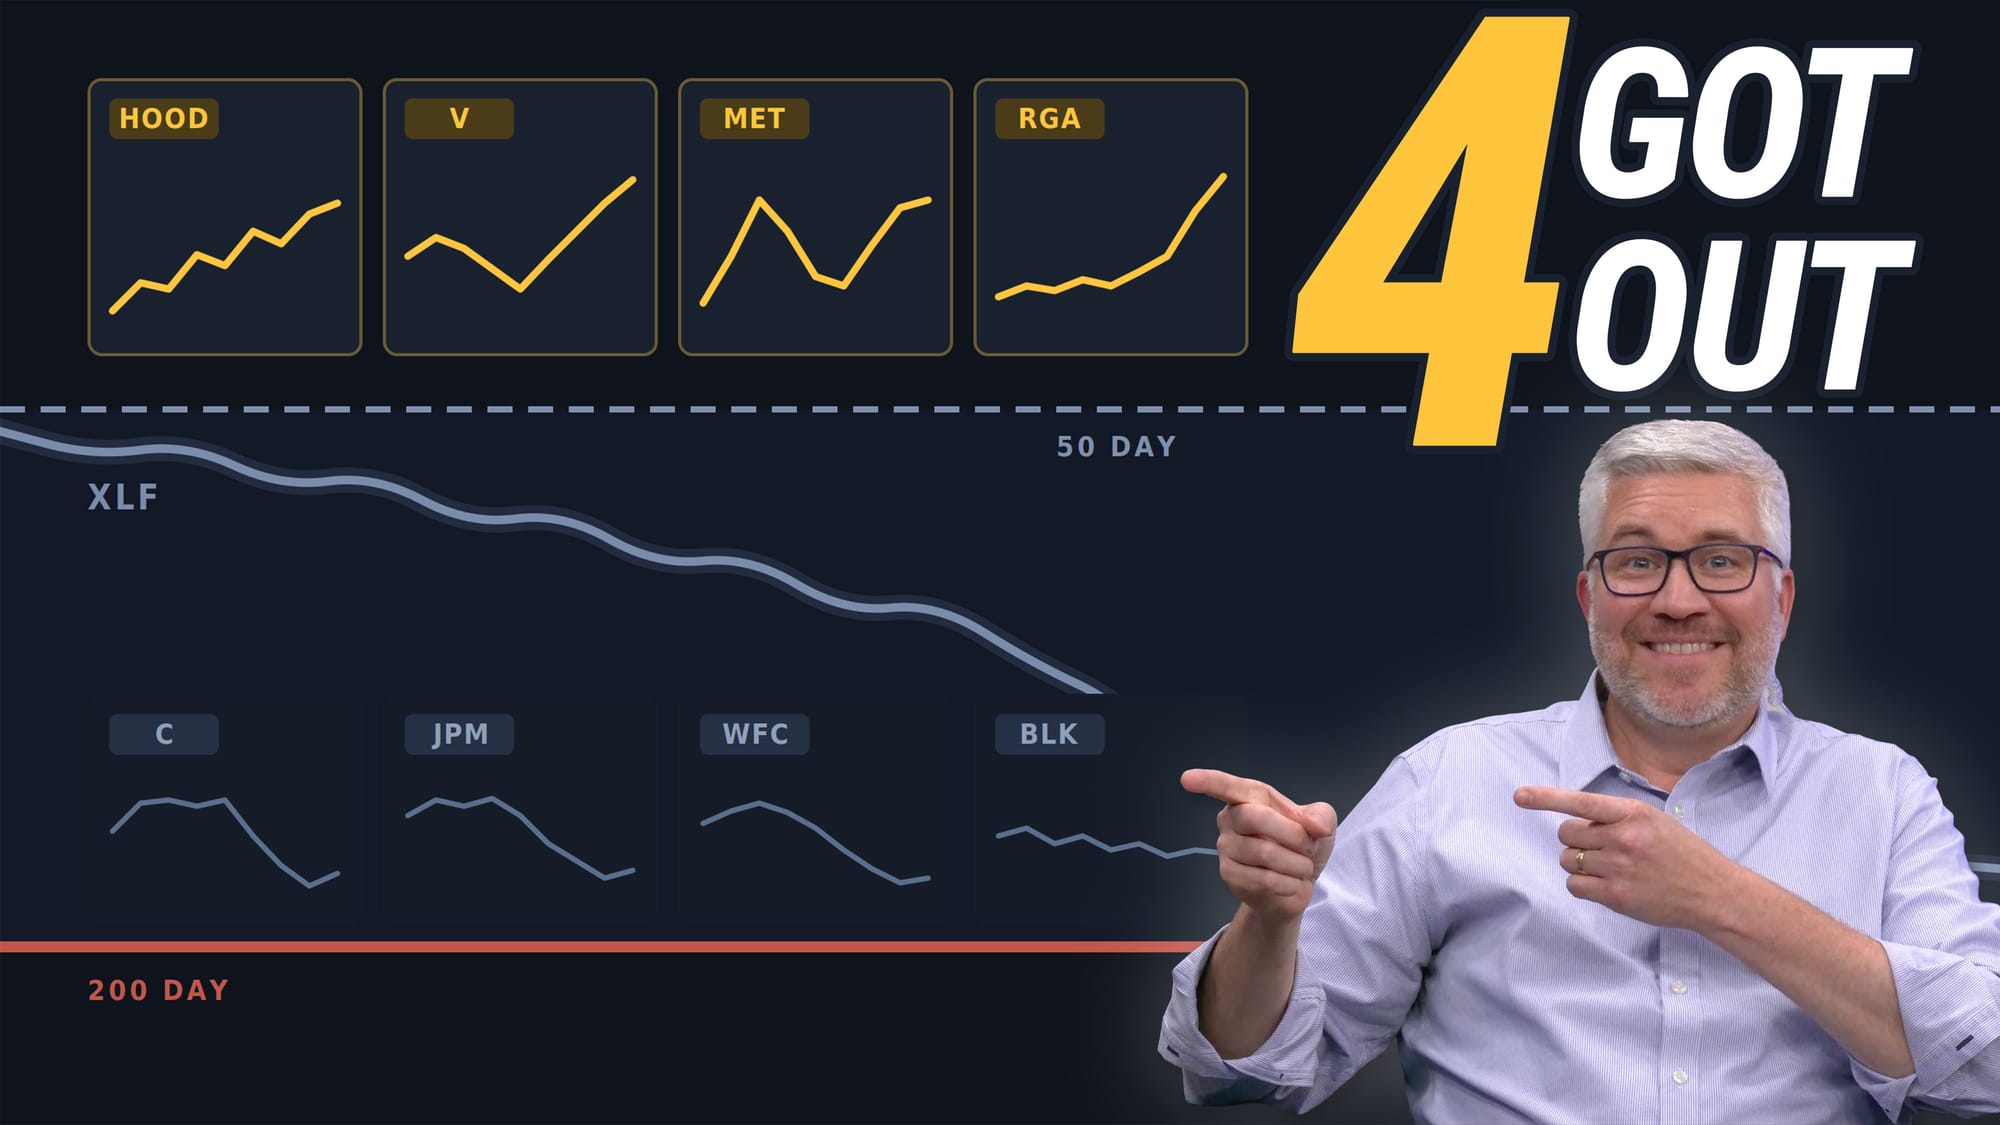
The Great Rotation of 2026 appears to be alive and well in mid-July, with former high-flying semiconductor names showing weakness and beginning to break key moving average support. But if the previous leadership is faltering, which areas of the market are taking their place in a new leadership role?
We’ve been noting strength in the financial sector off the March market low, starting with some of the major US banks but now broadening to other areas of the financial sector. With interest rates generally trending higher in July, we’re expecting further outperformance in this value-oriented sector.
Today, we’ll break down three key stocks from the financial sector, review their technical setups since they all reported earnings this week, and discuss key levels to watch for in the weeks to come.
Morgan Stanley (MS)
Two early winners, Morgan Stanley and Goldman Sachs (GS), have demonstrated strong relative performance over the last three months. With a chart like MS pounding out a consistent pattern of higher highs and higher lows, it’s all about following the trend for as long as possible.
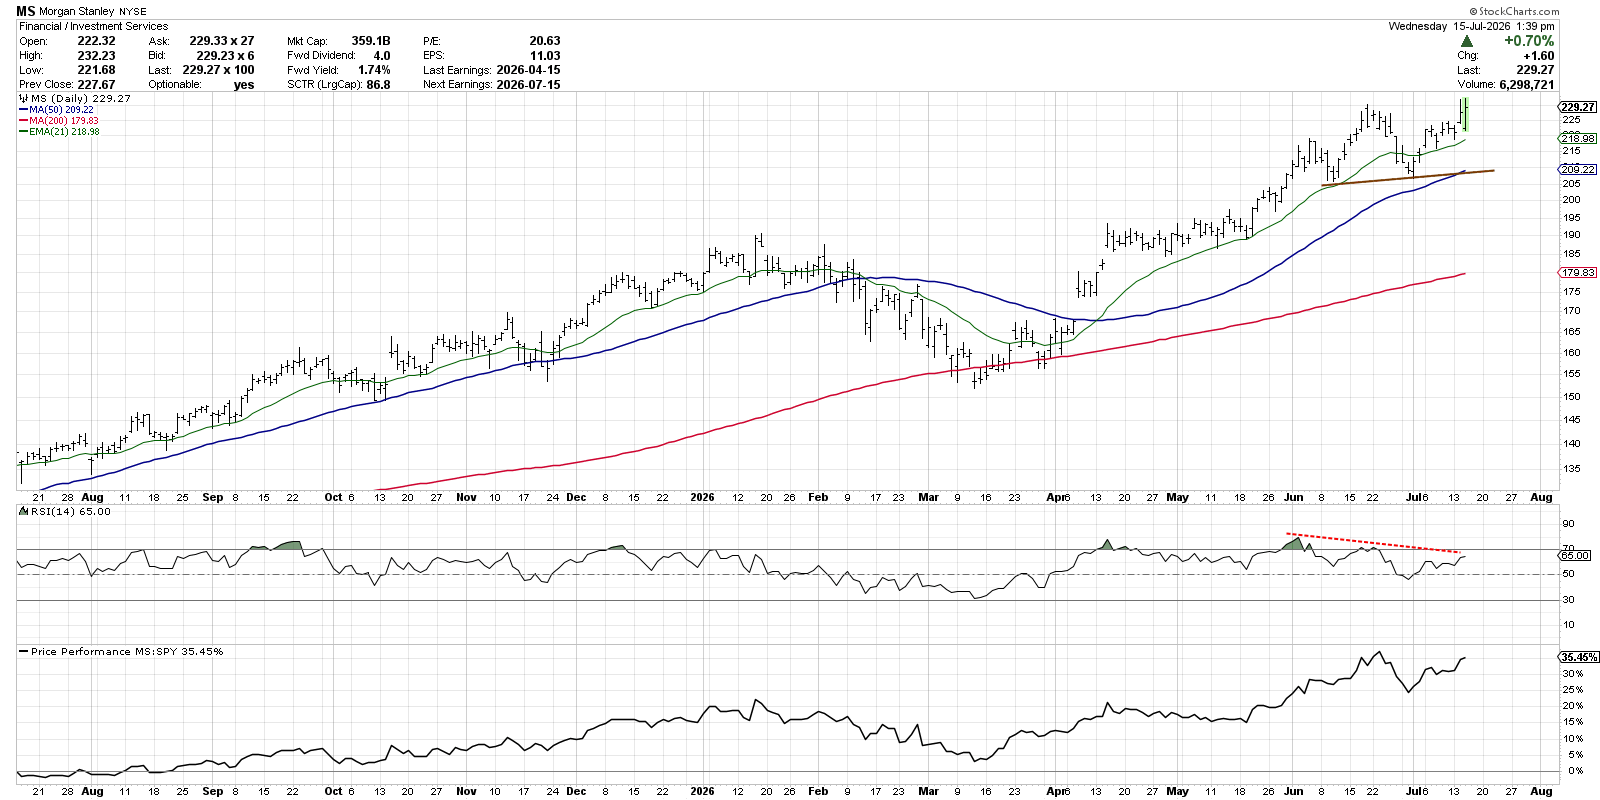
I was taught that, during an uptrend phase, we should pay more attention to the swing lows than the swing highs. Basically, we already know the stock is in an uptrend, so let’s keep monitoring the swing lows to confirm that buyers are coming in and pushing the price back up to new highs.
For now, MS remains safely above the moving averages, all of which are sloping higher. The 50-day moving average is lining up well with a short-term trendline formed by connecting the most recent swing lows in June and July. Until and unless those support levels are broken, we’re inclined to consider Morgan Stanley to be in a confirmed uptrend phase.
Bank of America (BAC)
Compared to MS, Bank of America had a much more challenging trajectory off the March market lows. A pullback in April and May led to a break back below the 200-day moving average. By late May, a rally seemed to clarify the rare but meaningful “inverted head-and-shoulders” continuation pattern.
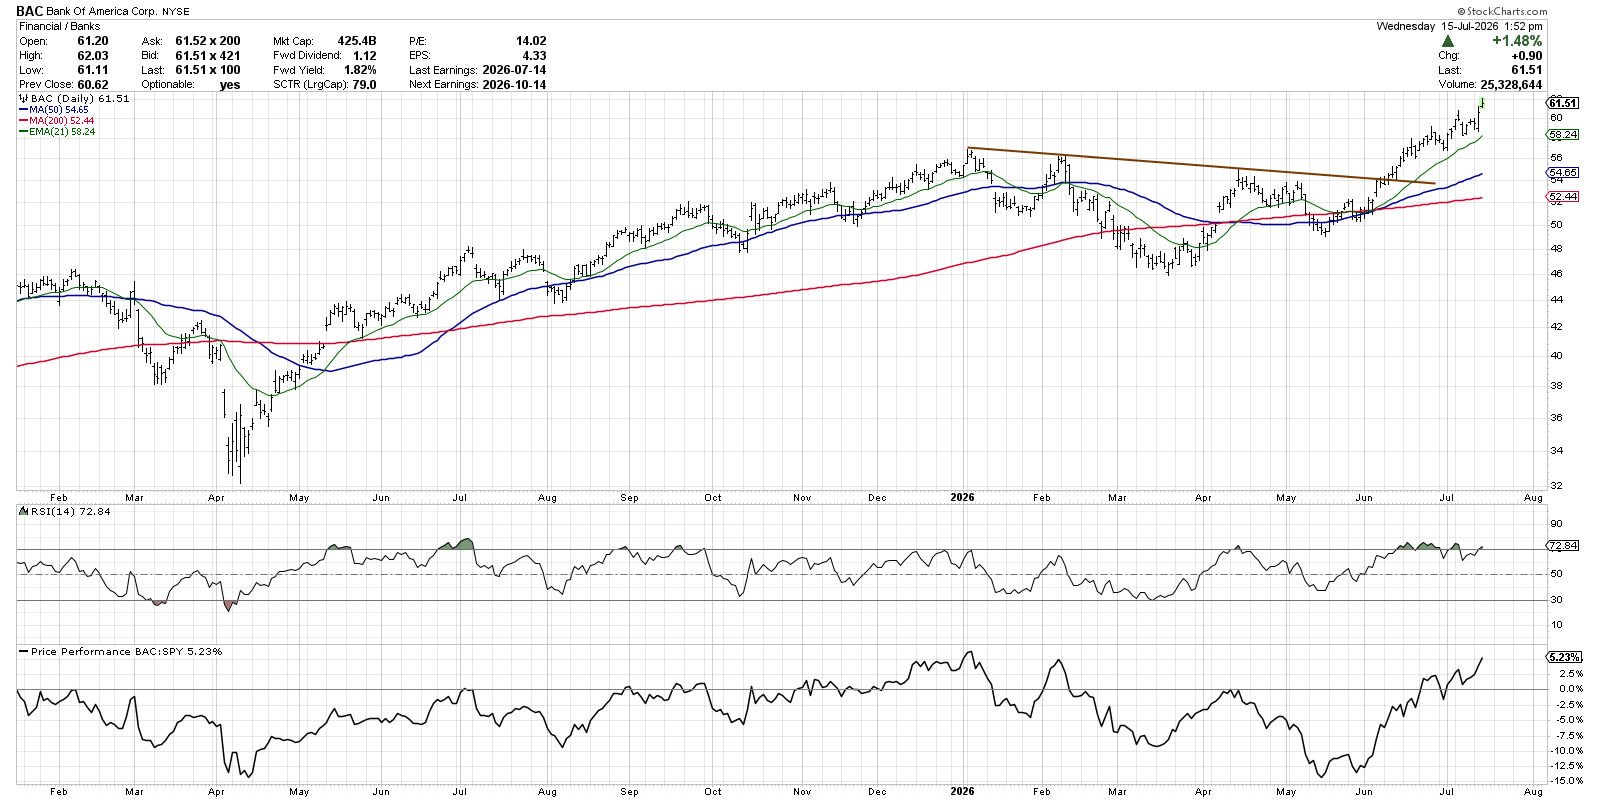
While we often think of an inverted head-and-shoulders as a bottoming pattern, something that comes after a long-term price decline, there are times when this pattern emerges after a long uptrend phase. Once BAC broke above the neckline of the pattern in early June, and the Relative Strength Index (RSI) pushed well above the 60 level, we saw this as a clear sign of accumulation with further upside potential.
Now, the price is a classic uptrend pattern of higher highs and higher lows. It sits above upward-sloping moving averages, and the momentum and relative strength remain constructive. As long as this configuration remains, we see Bank of America as a chart going “onward and ever upward”.
Wells Fargo (WFC)
Similar to BAC, Wells Fargo struggled to mount any meaningful advance off its March low. In fact, Wells Fargo retraced back down to its March low again in May, eventually finding support around $73. Now, the stock has round-tripped back to retest its Q2 high.
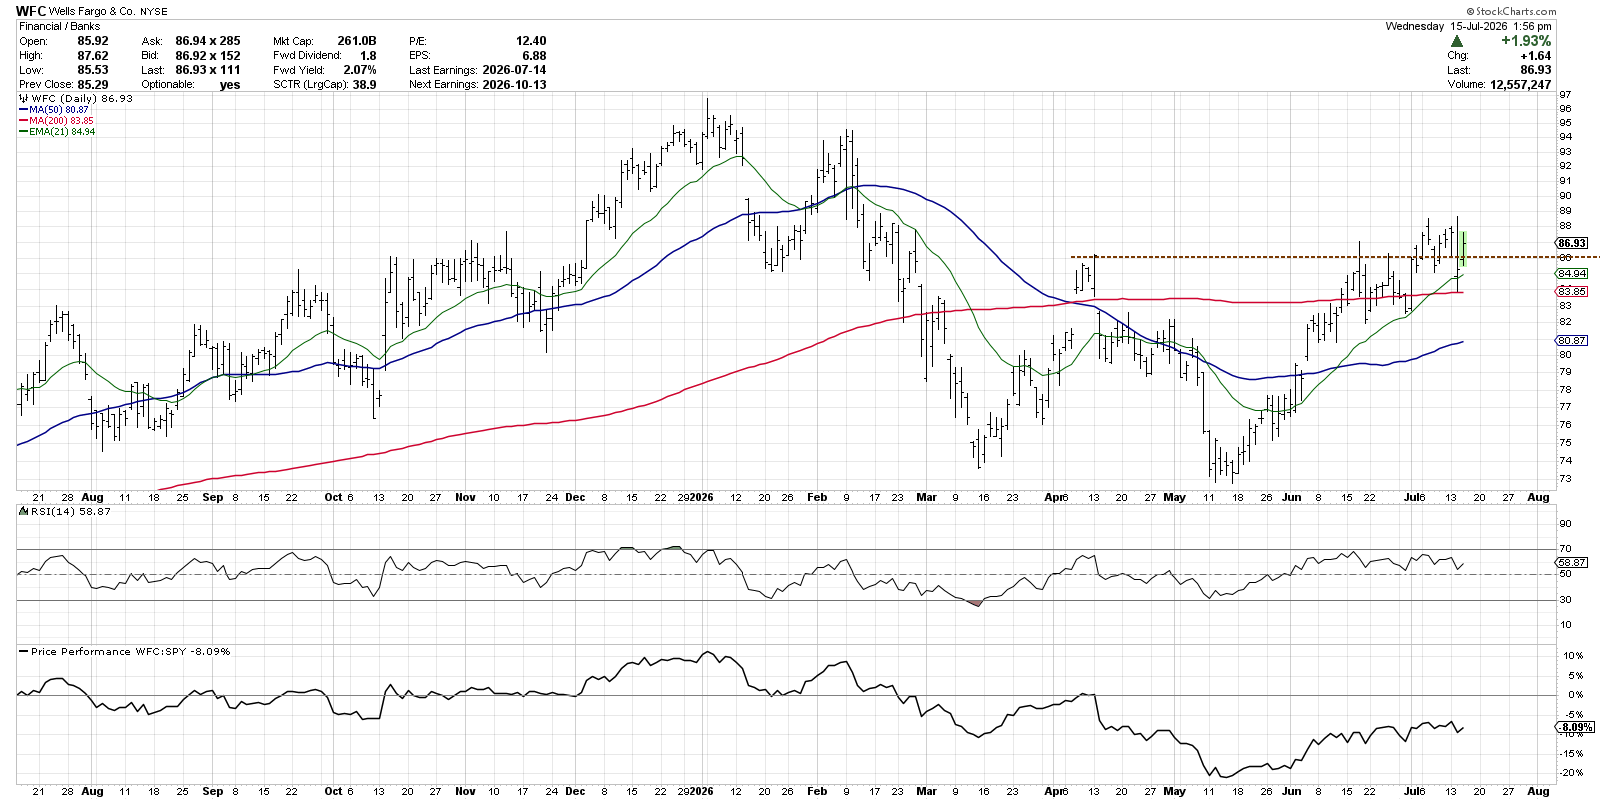
With a basing pattern like this one, we are observing a fairly consistent support level around $73 and a clear resistance level around $86. After testing that resistance through the month of June, WFC finally broke to a new swing high earlier this month.
While Wells Fargo did push above resistance in recent weeks, we’ve not really seen any positive follow-through days, indicating that additional buyers are willing to push the price even higher. We’re considering this a bullish setup for now, but also keeping a watchful eye on support at the 200-day moving average. Because as legendary investor Paul Tudor Jones is quoted as saying, “Nothing good happens below the 200-day moving average!”
We walked through setups for these banks and other financial stocks, as well as observations on the 10-Year Treasury Yield, on our latest weekly show on the StockCharts TV YouTube channel!
RR#6,
Dave
P.S. Ready to upgrade your investment process? Check out my free behavioral investing course!
David Keller, CMT
President and Chief Strategist
Sierra Alpha Research LLC
marketmisbehavior.com
https://www.youtube.com/c/MarketMisbehavior
Disclaimer: This blog is for educational purposes only and should not be construed as financial advice. The ideas and strategies should never be used without first assessing your own personal and financial situation, or without consulting a financial professional.
The author does not have a position in mentioned securities at the time of publication. Any opinions expressed herein are solely those of the author and do not in any way represent the views or opinions of any other person or entity.