Q2 Earnings Volatility Is Coming, and These Stocks Have Momentum

Key Takeaways
- Don’t let the low VIX fool you: single-stock volatility surges ahead of the second quarter earnings season.
- Bank earnings hit on Tuesday, with other broad-market volatility catalysts.
- Railroads, refiners, and even some retail post impressive relative strength coming into the reporting period.
Traders are braced for a wild Q2 earnings season. You wouldn’t know it just by looking at the Cboe Volatility Index ($VIX), which settled last week at a sanguine 15.03, the lowest in six months. Under the S&P 500’s surface, however, wheels are spinning, and single-stock swings are intense.
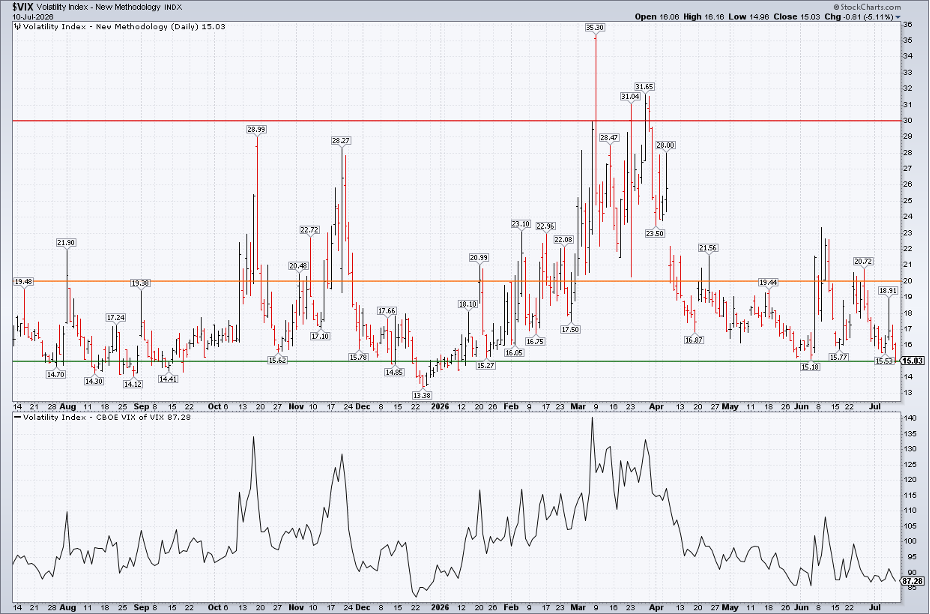
The Cboe’s Constituent Volatility Index (VIXEQ) is very close to a 52-week high, closing at 48.97 this past Friday. The sell-side has been quick to point out that we have rarely seen such a wide gap between (34 points) the VIX and VIXEQ. Goldman Sachs also noted that the average stock’s options straddle is particularly elevated as we enter mid-July.
All of this is important from a portfolio management perspective, as the Q2 earnings season unofficially begins on Tuesday. Indeed, traders may want to consider trimming position sizes, given the large expected swings.
A Catalyst-Packed Tuesday
The big banks, sans Bank of New York Mellon (BNY) and Morgan Stanley (MS), post revenue and income numbers before the bell on the 14th. It’s an unusual confluence of major reports hitting the tape at once, and those are just the beginning of volatility catalysts on this Super Tuesday of sorts for markets. June CPI crosses the wires later in the morning, with Fed Chair Kevin Warsh’s two-day semiannual Monetary Policy testimony before Congress beginning after the opening bell.
For index fund investors, all of this is not much sweat. For traders, eyeing stocks with strong absolute and relative strength could be the way to approach the next few weeks. There will be breakouts and blow-ups, but erring toward prevailing trends may help you steer clear of major tape bombs. Using the StockCharts Scans tool, I found three niches posting big relative strength, closing last week at or near 52-week highs.
Railroads Stay on Track
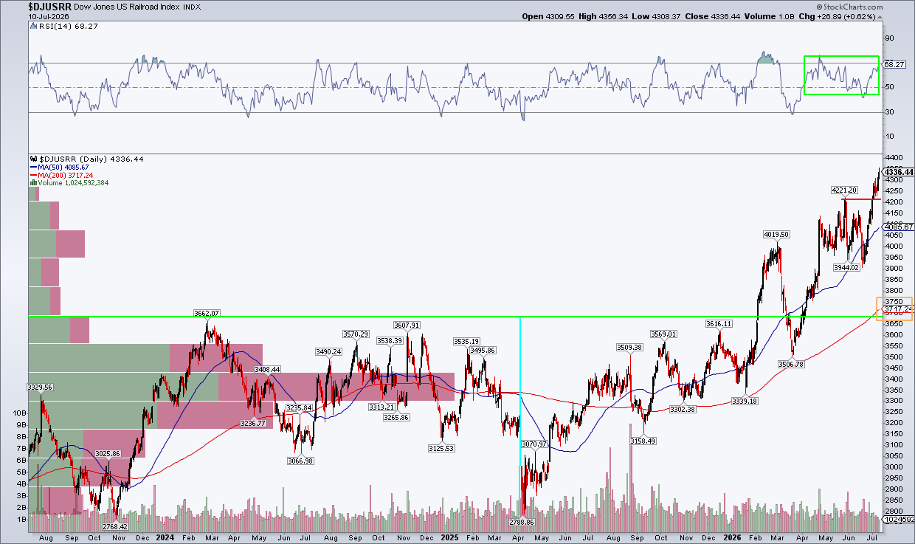
First, railroad stocks continue chugging along. The Dow Jones US Railroad Index ($DJUSRR) printed an all-time high last Friday. Recent winners within the index include CSX Corp (CSX), Norfolk Southern Corp (NSC), and Union Pacific (UNP).
Notice in the chart below that the railroad index formed a multi-year base, with resistance above 3600. The April 2025 low of 2789 and eventual breakout earlier this year triggered a measured-move upside target in the 4500–4700 range. So there may not be much upside left in the current advance.
Still, the latest thrust took DJUSRR through the May high, while the RSI momentum oscillator at the top of the chart remains in a bullish zone above 40. The index is now a bit extended from its 200-day moving average. The aforementioned trio of railroad companies reports Q2 results Wednesday and Thursday next week.
Refiners Ride Wide Crack Spreads
Next, the Energy sector’s refiner stocks continue benefiting from historically wide crack spreads. The price difference between refined products and crude oil is large, benefiting these energy processors and distributors. The S&P 500’s 52-week high scan has Marathon Petroleum (MPC), Phillips 66 (PSX), and Valero Energy (VLO) near the top when sorted by SCTR score.
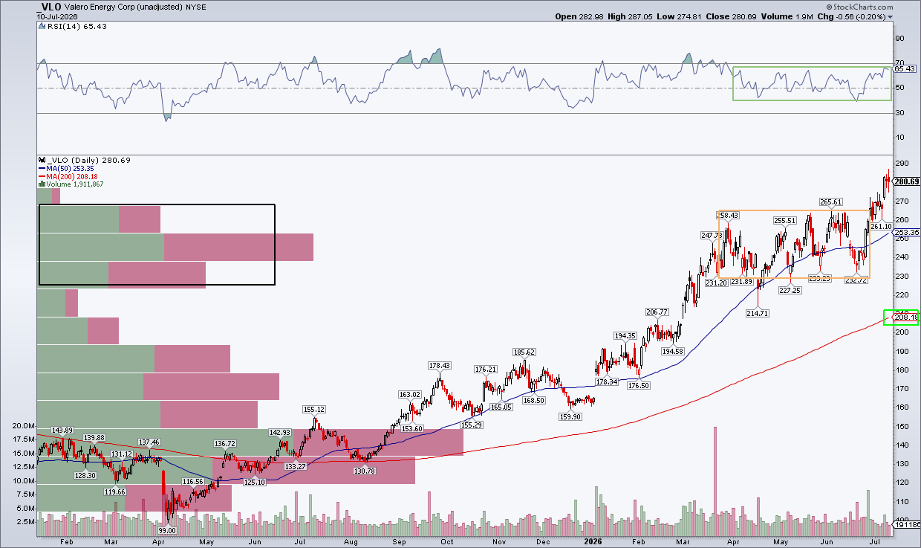
Let’s home in on the oldest stock among the three: VLO. Refiner earnings reports don’t hit until the turn of the month and into early August, so there is some time before volatility fuel is added to the mix. For now, the technicals appear constructive. VLO’s chart shows a March-through-June consolidation, followed by a breakout to begin the second half.
The measured-move upside price objective is looser compared to the railroad index, but we can ballpark it. The height of the rectangle consolidation is about $40. Add that range to the breakout point (just under $270), and Valero shares could tag $305–$310 before long. Its RSI isn’t as strong compared to early-year levels, but a decent amount of volume-by-price is now below the current level, which should offer some cushion if it pulls back.
Retail Is Quietly Waking Up
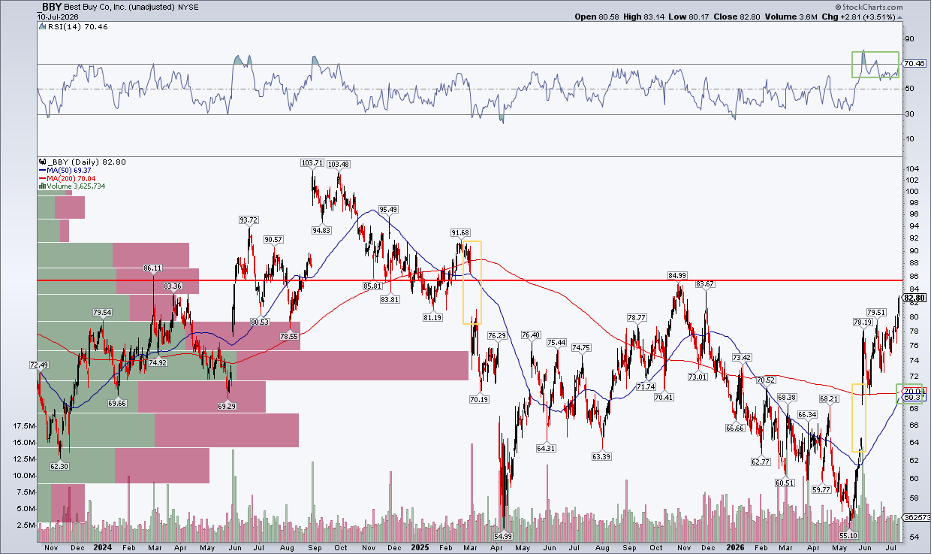
Finally, there’s a retail renaissance in certain niches. In a nod to the back-to-school shopping season, Best Buy (BBY) printed a fresh one-year weekly high close. Target (TGT) is another major winner since late last year, just as Walmart (WMT) stumbles. To be clear, while the SPDR S&P Retail ETF (XRT) remains choppy, pockets of new highs emerge in retail (many of its components are not S&P 500 stocks).
For BBY, meanwhile, a years-long downtrend leaves many "dead bodies" on the chart. Yes, the breakout is impressive, but I see resistance just above the current price ($85), while significant congestion rests above the current level. Still, a bullish golden cross moving average pattern will occur right around the time of its Q2 earnings event on August 19. There’s still plenty of time to gird for retailer results (August 18-27).
The Bottom Line
As global chip stocks swing wildly from day to day, looking elsewhere for bullish and bearish trends could be one way to manage risk during what is expected to be the most intense single-stock volatility stretch since April 2025. Relative strength is seen in railroads and refiners, while pockets of retail perk up ahead of a key consumer spending stretch. For now, keep your position sizes in check and know your holdings’ earnings dates.
Earnings move markets.
Stay ready with the StockCharts Earnings Calendar.
Disclaimer: This blog is for educational purposes only and should not be construed as financial advice. The ideas and strategies should never be used without first assessing your own personal and financial situation, or without consulting a financial professional.