Bitcoin Eyes Crucial Support: What If It Fails?
Most of the indicators monitoring Bitcoin’s primary trend are bearish. However, the price is rapidly closing in on important support. If it bounces, it will offer some hope that the bear market could be over, or at least delayed. On the other hand, if it breaks that support, what are the implications? Before I address these questions, let’s take a step backwards and review the longer-term picture to see exactly where we stand.
In this context, the most damming evidence comes from Chart 1, which shows that the 78-week ROC (18-month) experienced multiple negative divergences with the price over a 10-year spread. It started off with a 2,400% gain (over an 18-month), which is the highest reading I have ever seen for any market ever! However, by the fourth progressively higher peak, it had dropped to a still respectable 80%.
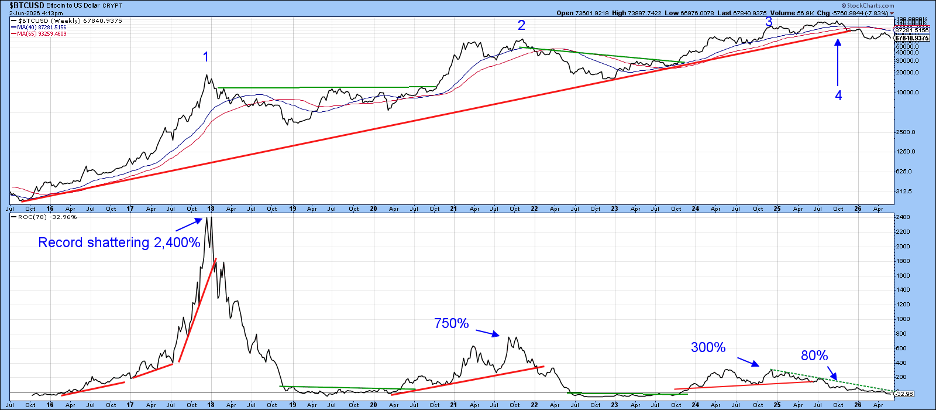
Negative divergences need to be confirmed by price, of course, as there is nothing in the rule book that says a fifth or sixth divergence cannot be achieved. In this instance, the confirmation came with a violation of the red secular up trendline. Assuming the break was valid, which it has turned out to be, two things are likely. Either the break represents a reversal in trend or it signals a several years of range-bound activity. Either way, it’s a highly significant development.
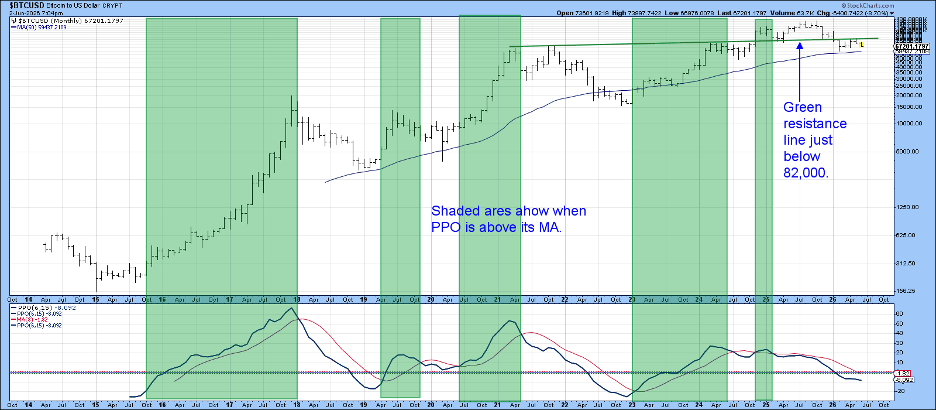
Chart 2 indicates a primary bear market trend since spring 2024, characterized by the PPO remaining below its red moving average and a failed price breakout above the green resistance line. This "bull trap" signifies that a rally attempt lacked sustained strength, leading to a collapse back below key resistance levels.
False breakouts tend to be followed by above-average moves in the opposite direction, as traders, realizing their mistake, are forced to get back onto the right side of the market. This false move is shown in greater detail in Chart 3, where you can see that the extended breakout trend line has acted as a barrier to any upside move.
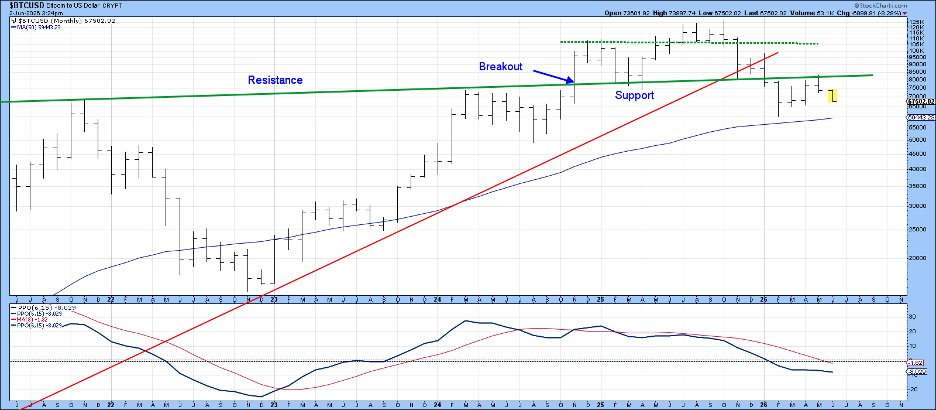
Chart 4 features the price action since the fall of 2025. A few points are worth noting. First, the trading range between November 2025 and early 2026 experienced a false breakout, which was confirmed by a break in the red support trendline. Second, another whipsaw developed in May, confirmed with a penetration of the upper red support trendline. If that was not enough, further confirmation occurred with the break in the post February up trendline. False upside breakouts, it should be remembered, are characteristics of a primary bear market.
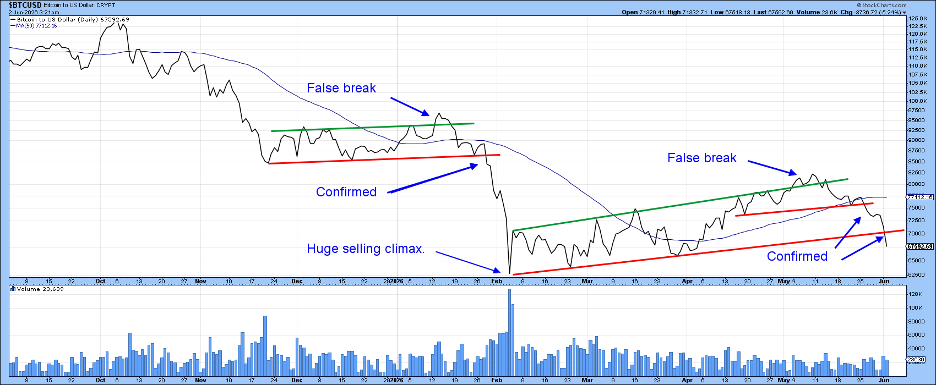
Finally, the February bottom attracted huge volume, thus forming a giant selling climax, the downside penetration of which could well have serious implications.
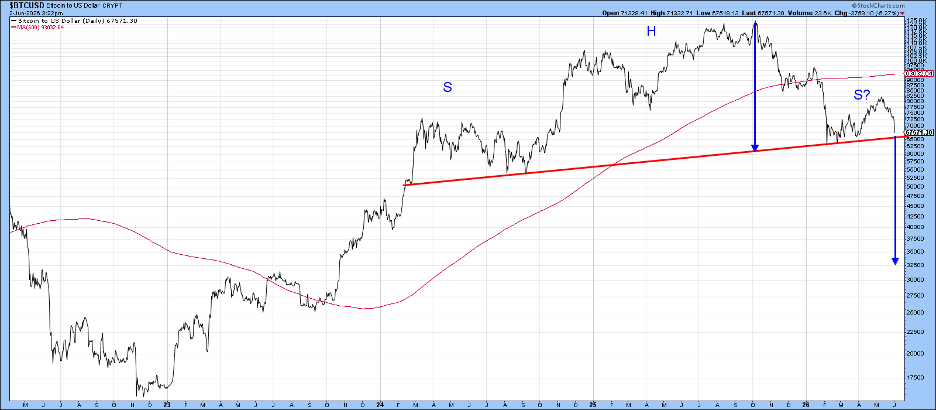
Chart 5 clarifies these downside implications by revealing that Bitcoin may be in the terminal phase of completing a massive head-and-shoulders top. However, this bearish pattern remains unconfirmed until the price achieves a decisive close below the critical $60,000 neckline area. Aligning with market pioneer Richard Russell's theory that unexpected market surprises almost always occur in the direction of the dominant primary trend, the immediate path of least resistance remains skewed to the downside. If a confirmed breakdown below $60,000 triggers the pattern, the blue arrows project the minimum ultimate downside target for this cycle, which would be in the $30,000- $32,000 zone.
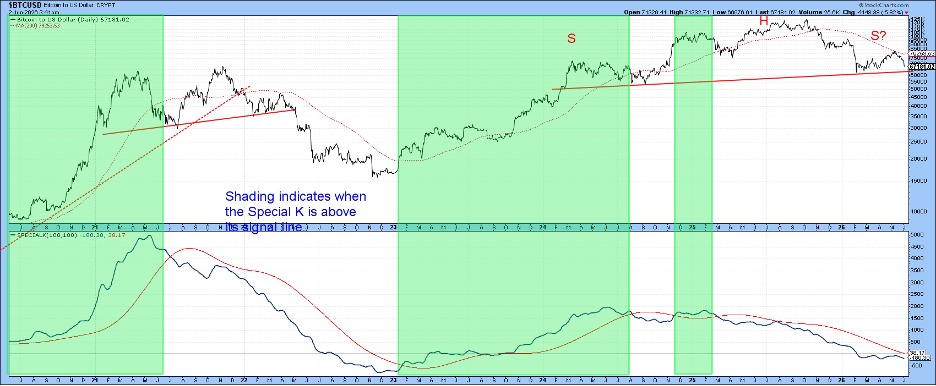
On the other hand, if the February low holds or is even temporarily breached, that would give the price time to consolidate and regroup. The sign I would look for would be a break above the 200-day MA, since that would probably give the Special K (SPK) in Chart 6 a chance to cross above its signal line for the first time since last October. That, in and of itself, would not be sufficient evidence on which to base a bull market call. It would, however, be a good start!
Good luck and good charting,
Martin J. Pring
The views expressed in this article are those of the author and do not necessarily reflect the position or opinion of Pring Turner Capital Group of Walnut Creek or its affiliates. The Six Stages of the Business Cycle are followed each month in Martin Pring’s Intermarket Review.