Broadcom Breakout or Blowoff Top? Reading the Momentum Divergence

Shares of Broadcom (AVGO) recently broke to a new all-time high, finally surging above the previous peak from December 2025. Is this recent breakout a sign of further strength to come, or is this the last gasp higher in the late innings of a growth story?
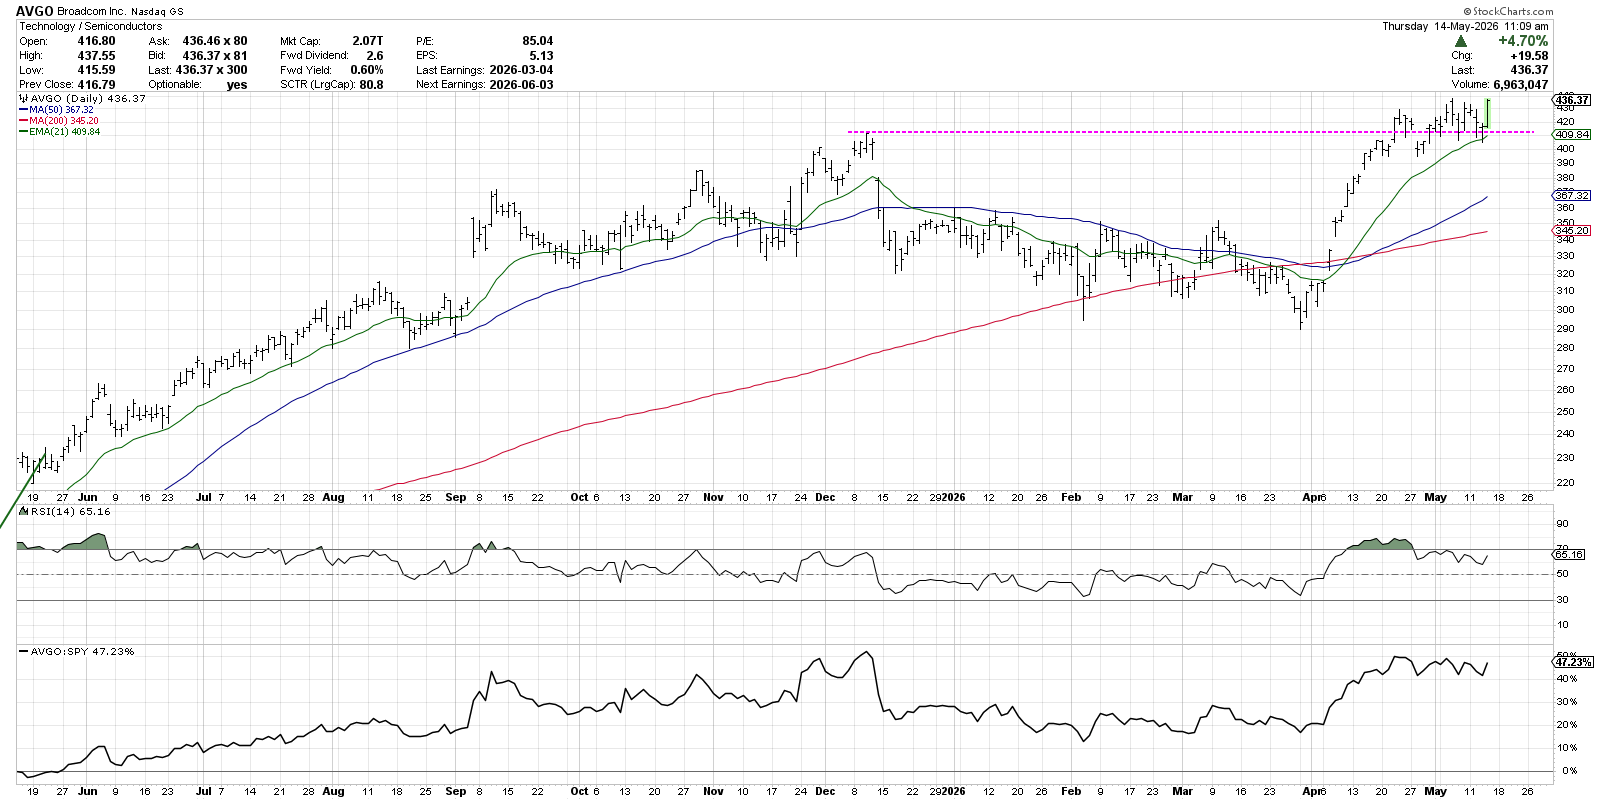
While the price breakout appears encouraging on the surface, the lack of momentum support brings the current upswing into question. With a “bearish momentum divergence” becoming clear on the chart of AVGO, a blowoff top remains a very real possibility.
Let’s review best practices for bearish momentum divergences using solid historical examples, and then we’ll come back to the chart of Broadcom and see what levels or signals will be important to gauge potential next steps.
Price Breakdowns Confirm Major Tops
A bearish momentum divergence can resolve in one of two ways. If the price resumes its uptrend and the Relative Strength Index (RSI) turns higher, then we can confirm a new accumulation phase driven by stronger momentum readings. If, however, the weakened momentum weighs on investor optimism, a downturn in price confirms a potentially significant topping pattern.
The chart of Oracle (ORCL) features examples of the latter, where the price stalls out after the weakening momentum dampens optimism for further gains.
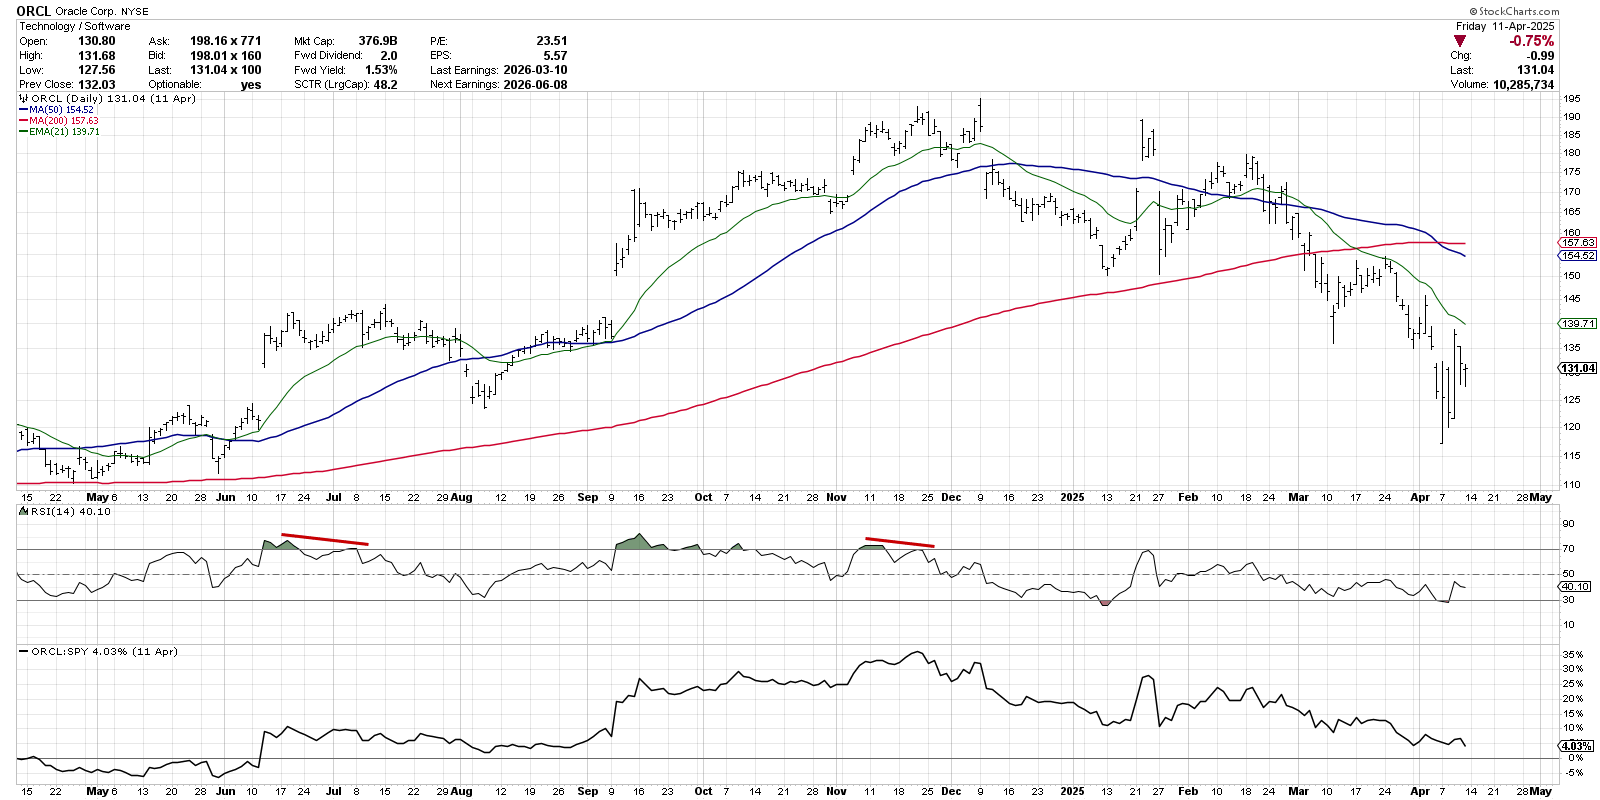
Back in June and July 2025, ORCL made higher swing highs, but the RSI didn't reach the overbought condition on the second price peak. Soon after, the price broke below the 21-day EMA and then the 50-day SMA, confirming a downside rotation.
Then, in November 2025, we again saw a new high for ORCL, but with weaker momentum readings on the second upswing. A subsequent retest of the peak around $193 was marked by even weaker RSI values, serving to confirm upside exhaustion for the uptrend phase. So while the bearish divergence can serve as an important early warning signal, only a breakdown in price can confirm a major top and validate the bearish divergence.
New High on Stronger Momentum Suggests Renewed Optimism
For a review of the more bullish outcome after a bearish momentum divergence, we can consider the Nasdaq 100 (QQQ) back in 2025. During the summer of that year, we observed a strong uptrend phase marked by positive momentum readings. Then, in August, we noted a new price high that was accompanied by lower RSI values. Would that bearish momentum divergence be confirmed?
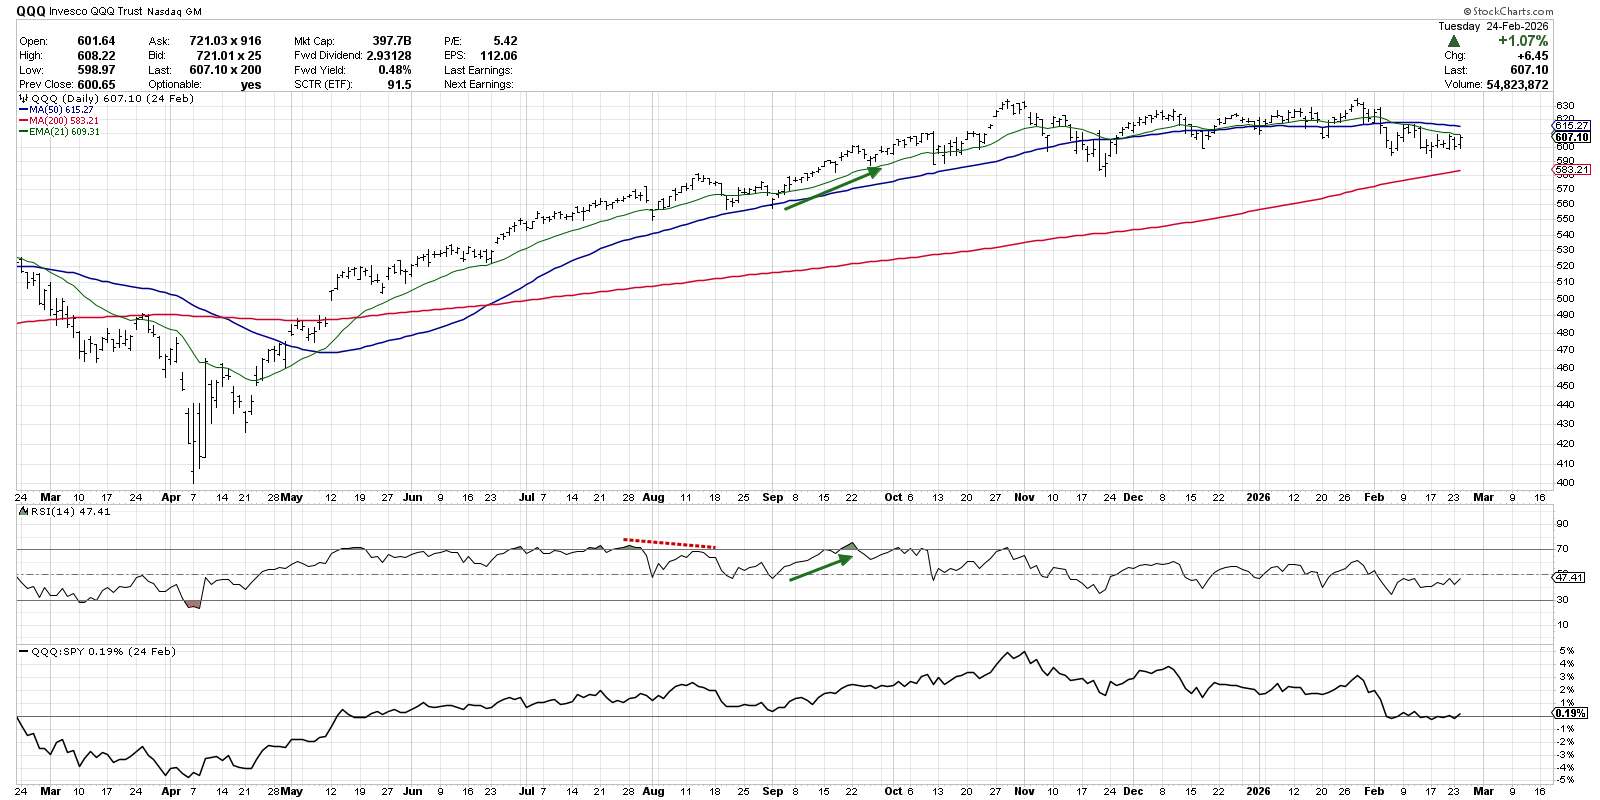
QQQ did pull back to the 50-day moving average but, soon after, the uptrend resumed. Higher price highs were marked by stronger momentum readings, with the RSI move above 60 serving as an “all clear” sign for this growth benchmark. So, to invalidate a bearish divergence, we simply need to see the price resume the uptrend along with stronger momentum patterns.
Bearish Divergences Can Resolve in Two Ways
Now, as we reconsider the chart of Broadcom, we can see how the weaker momentum readings indicate a potential topping pattern. So far, AVGO has pulled back to the 21-day EMA, but has dropped no further.
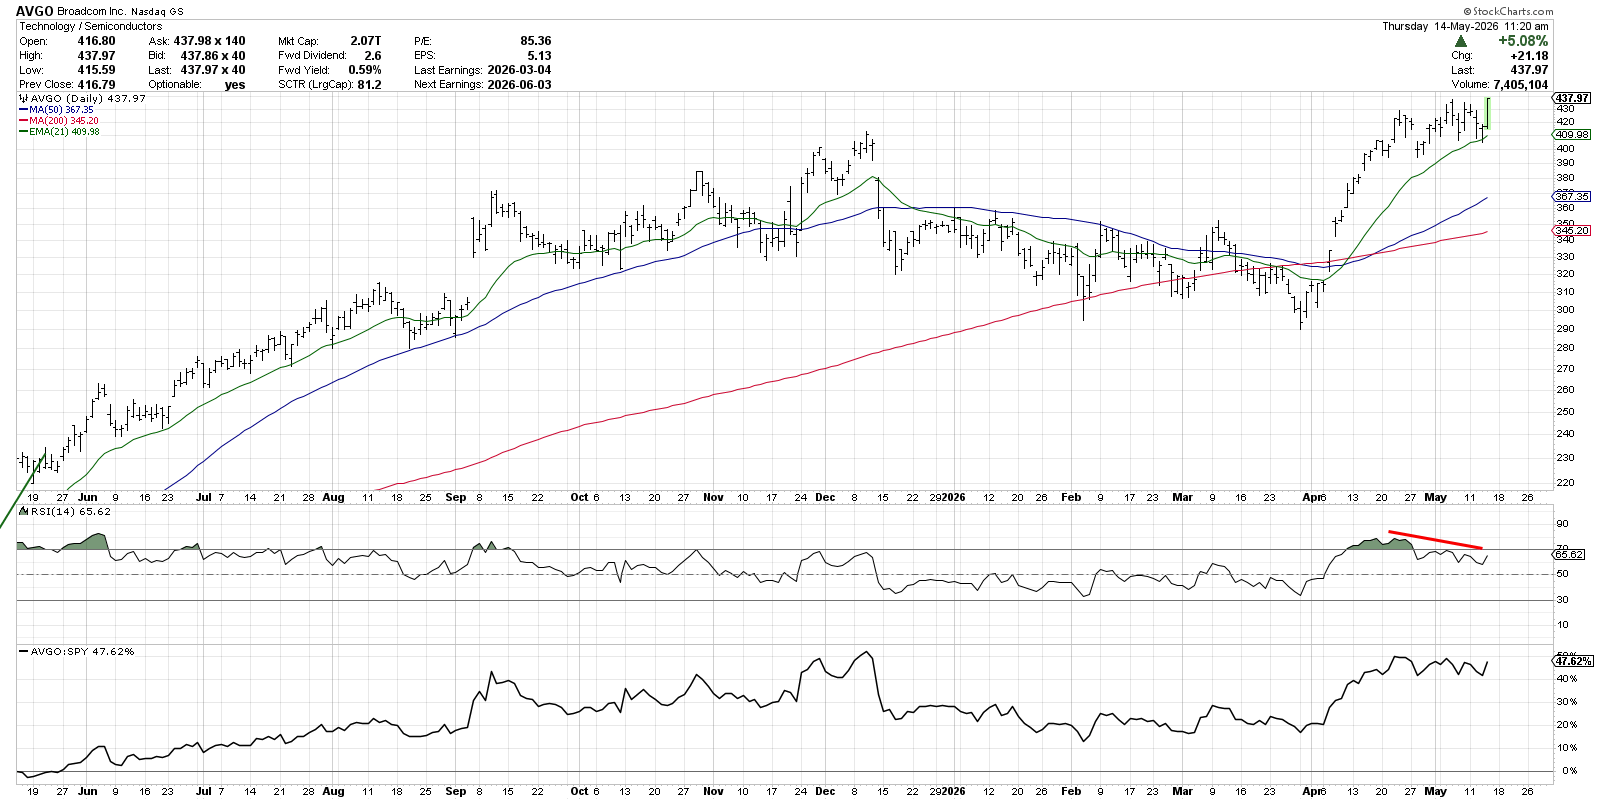
At this point, the chart suggests two potential future paths. A continued upswing in price, accompanied by an RSI moving back above 70, would invalidate the divergence and confirm a new accumulation phase. On the other hand, if the price breaks below the 21-day EMA, we’d watch the 50-day moving average as the next downside target. More importantly, we’d look to the RSI for any confirmation of a new distribution phase.
By the way, we first highlighted this chart on our daily market recap show, where we review the latest market movements through a technical and behavioral lens. Check out the latest episode on our YouTube channel!
RR#6,
Dave
P.S. Ready to upgrade your investment process? Check out my free behavioral investing course!
David Keller, CMT
President and Chief Strategist
Sierra Alpha Research LLC
marketmisbehavior.com
https://www.youtube.com/c/MarketMisbehavior
Disclaimer: This blog is for educational purposes only and should not be construed as financial advice. The ideas and strategies should never be used without first assessing your own personal and financial situation, or without consulting a financial professional.
The author does not have a position in mentioned securities at the time of publication. Any opinions expressed herein are solely those of the author and do not in any way represent the views or opinions of any other person or entity.