Market Breadth Fears Are Everywhere, But Data Tells a More Nuanced Story

Key Takeaways
- Small caps, micro-caps, and international equities continue to outperform the S&P 500.
- Today’s weak breadth signals may reflect sector rotation more than underlying market risk.
- Defensive sectors lagging since March suggest investors still favor risk-taking over safety plays.
There’s a healthy degree of skepticism regarding the S&P 500’s rally off the March 30 low. A V-bottom morphed into a checkmark-shaped recovery, stunning cautious investors and rewarding those who went all-in on risk when global equities touched correction territory late in the first quarter.
Just check out some of the recent headlines, stats, and viral charts.
Last week, the Financial Times called out market fragility, given that the “soaring S&P” was propelled by just a handful of big tech companies. What’s more, Goldman Sachs’ market breadth measure, updated last Friday, was the weakest since late 2023.
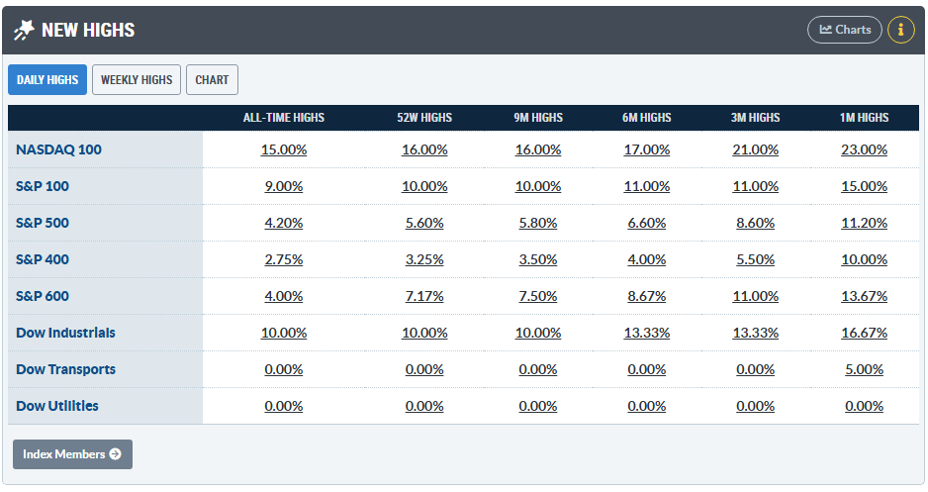
Investors can find their own favorite stats on StockCharts’ Market Summary page. Scroll down to the “New Highs” box and you’ll find that just 5.6% of S&P 500 names notched a 52-week high to close last week, just as all the major indexes reached records.
Should We Fear or Embrace the “AI 11”?
So, what gives? Is the S&P 500’s 8.1% year-to-date gain entering this week on shaky footing? Well, to answer that, we have to consider the rally’s makeup and how intramarket dynamics have shuffled about since last October.
“Big tech” has indeed been on a tear, led not so much by the Magnificent Seven but instead by what Ed Yardeni dubs the “AI 11”. This group includes chips & storage companies like Intel (INTC), SanDisk (SNDK), Micron (MU), as well as international equities such as SK Hynix and Samsung. Those stocks, along with the mega-caps, are 2026 all-stars. But the rest of the global stock market hasn’t been warming the bench either.
The Average Stock Is Holding Up Fine
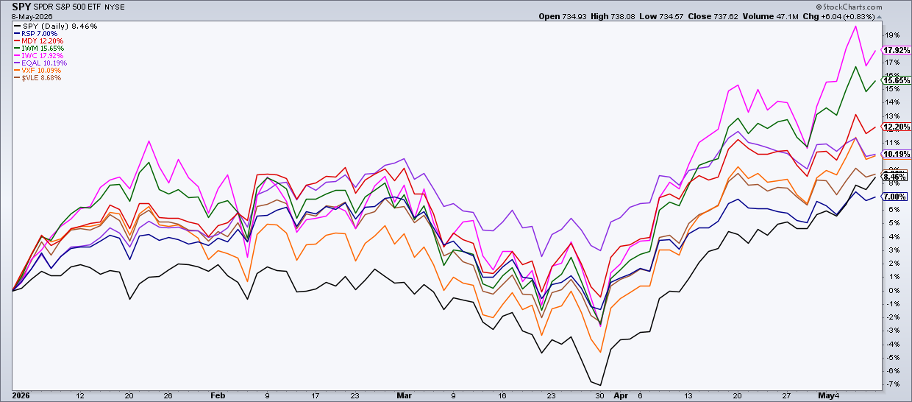
Just take a look at this year’s returns through the first full week of May. The S&P 500 ETF (SPY) is up just shy of 9% (dividends included). The top-heavy U.S. large-cap index lags the “average stock” index, the Value Line Arithmetic Index ($VLE). It has gained 0.2 percentage points more than the SPX. I also like to gauge all domestic equities not in the S&P 500 using the Vanguard Extended Market ETF (VXF). VXF is +10.1% YTD, also posting alpha.
While the Invesco S&P 500 Equal Weight ETF (RSP) slightly trails SPY, there’s major outperformance in niches far removed from the latest leg of the AI-fueled rally. The iShares Micro-Cap ETF (IWC) settled last Friday +17.9% on the year. The Russell 2000 ETF (IWM) was +15.7%. Even the value-leaning and high-quality SPDR S&P MidCap 400 ETF (MDY) has tallied a stout 12.2% YTD return.
International Stocks Partying Hard, Too
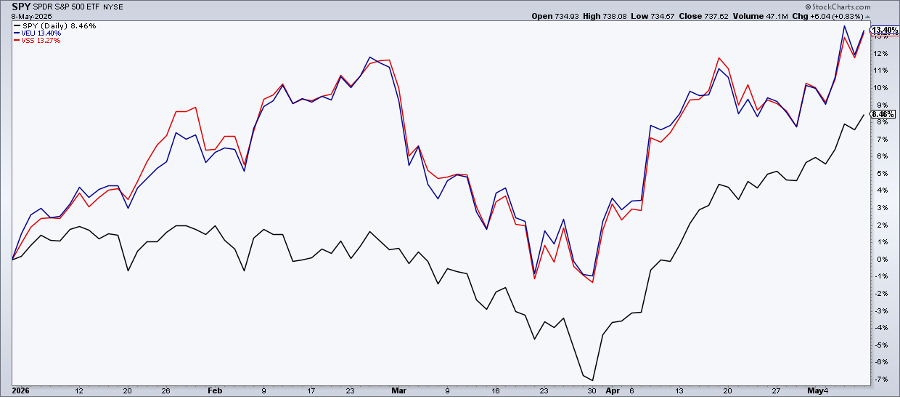
It’s the same story overseas. The Vanguard FTSE All-World ex-US ETF (VEU) tagged a record weekly closing high on May 8, finally eclipsing its February peak. International stocks are collectively +13.4% so far this year, almost halfway through Q2.
Ex-U.S. breadth also doesn’t flash warning signs, at least not when comparing VEU and SPY to the Vanguard FTSE All-World ex-US Small-Cap ETF (VSS). Even taking away the international market’s glamour stocks, we spot alpha. VSS is +13.3% YTD, also beating the S&P 500.
Breadth Weakness or Market Rotation?
All the debate and handwringing around market breadth today is really more a function of market rotation. Consider that since last November, resource sectors (Energy, Materials) have been at the top of the stack, beating the nine other S&P 500 areas. They are down significantly from their respective Q1 peaks, however, having given way to the TMT sectors.
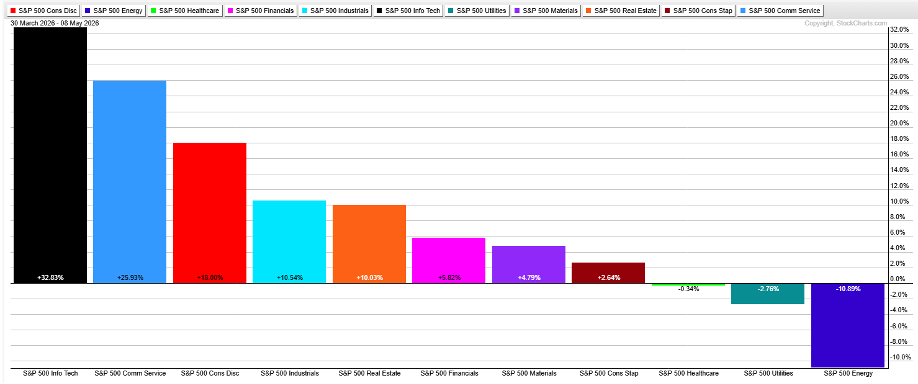
Tech, Communication Services, and cap-weighted Consumer Discretionary is the best-performing sector trio since the March 30 low. Many individual stocks within those once-lagging groups are still fighting to reclaim highs from October 2025, hence a sparse S&P 500 New Highs list.
Risk Appetite Still Looks Alive
Here’s something else to weave into the breadth narrative: defensive sectors bring up the rear since the March 30 nadir. Utilities, Health Care, and Consumer Staples are collectively flat. It’s the same sort of price action seen from the start of the bull market in October 2022 through last fall, which I don’t take as a bearish cue.
Energy is the major laggard, and a further decline in the oil and gas space would probably be welcome news, as it would suggest falling energy prices and easing geopolitical risks.
Financials Remain the Missing Piece
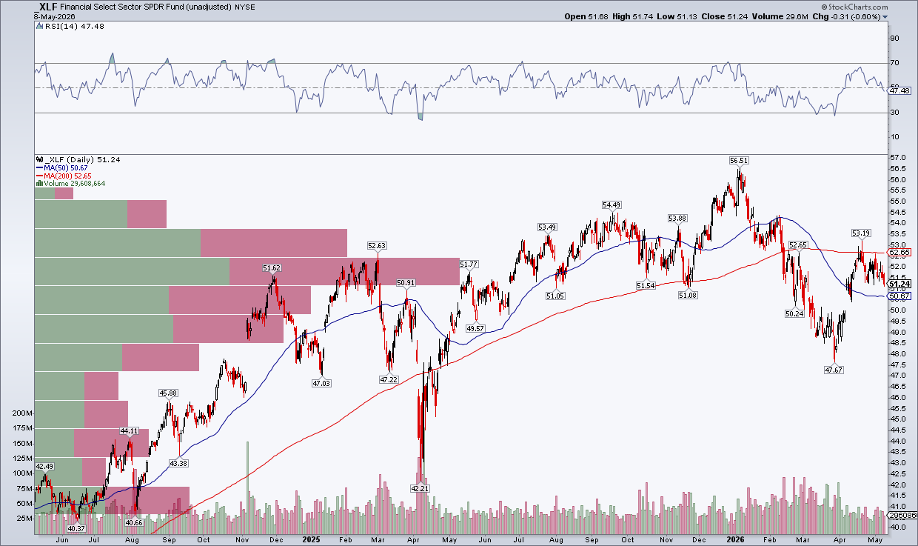
Looking ahead, I’d like to see Financials regain their mojo. This cyclical sector, along with TMT, led the bull charge through 2025. Banks, big and small, have stumbled, resulting in the Financial Select Sector SPDR Fund (XLF) falling about 10% from its January record high.
Now unchanged since December 2024, XLF’s 200-day moving average slopes down, with price below that trend-indicator line. Surely the breadth skeptics would cheer up if XLF staged a mid-year rally. That’s a chart I’ll be watching closely.
The Bottom Line
It’s sort of a choose-your-own-adventure situation when it comes to stock market breadth right now. Sinister stats and concerning charts have littered financial social media and the mainstream press. While a dozen or so powerhouse AI stocks in the storage space have taken Wall Street by storm, the reality is that most global equities have participated in the rally. Many sub-indexes far removed from the S&P 500 are at record highs, outperforming the U.S. large-cap index. Some trouble still lurks under the surface, and the back half of the second quarter could offer key clues on the market’s next move.
Disclaimer: This blog is for educational purposes only and should not be construed as financial advice. The ideas and strategies should never be used without first assessing your own personal and financial situation, or without consulting a financial professional.