Retail Stocks Are Crashing Relative to the S&P 500. Here’s Why It Matters

Key Takeaways
- Consumer stocks continue lagging as AI plays dominate market leadership and investor flows.
- XRT’s bearish technical setup suggests retail industries remain vulnerable.
- Upcoming earnings from major retailers could determine whether XRT weakness deepens or finally stabilizes.
Earnings season’s final hump is next week. NVDA reports Wednesday evening, May 20. Shares have never looked better, now scaling $225 to help keep the S&P 500 near record highs. Retail also turns in financial scorecards, and it has been a tough recent ride for the group.
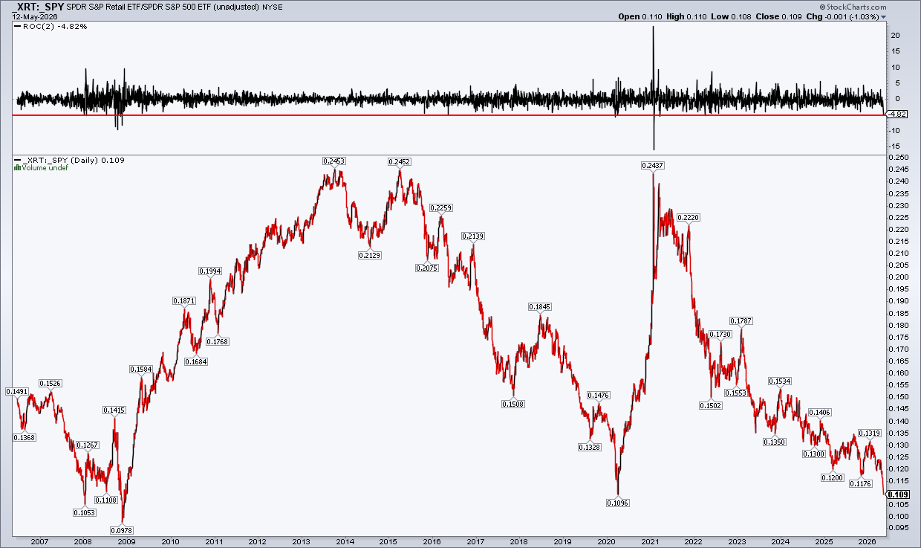
The SPDR S&P Retail ETF (XRT) plunged 3.6% on Monday and another 1.2% on Tuesday. The two-session slide of 4.8% was the worst since last October and nearly the largest back-to-back decline since April 2025. Relative to the SPY, XRT rivaled its worst two-day rout since 2008. Zooming out, the years-long underperformance leaves the retail ETF close to all-time lows compared to SPY.
So while there’s renewed optimism for the world’s most valuable company heading into its quarterly earnings, it’s quite the opposite for retail. But what are the technical and intermarket signals XRT flashing to traders today? Is there opportunity in the chaos, or will the trend of larger degree remain firmly in place? Let’s window-shop the charts.
Digging Through the Damage
For background, I came across surprisingly dreadful momentum readings across much of the retail space on StockCharts Market Summary.
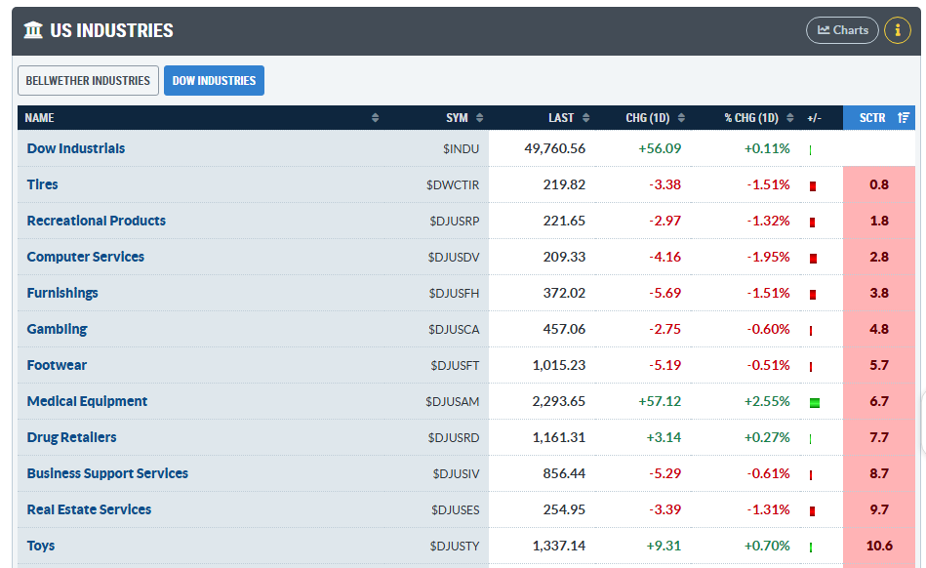
Scroll down to the US Industries panel, then select Dow Industries. There, you’ll see 102 groups, which may be overwhelming. But here’s how to properly sift for the real movers: sort by the SCTR score. This technical ranking system uses six indicators to evaluate a security or, in this case, an industry index. At the top of the stack are the following Dow Jones Industries: Heavy Construction, Aluminum, Semiconductors, Nonferrous Metals, Steel, and Electronic Equipment. All of those tie into the ongoing AI/data-center boom.
If you are concerned about the so-called breadth problem facing the market, you can find more than a dozen ideas here, and not all are pure AI plays.
The Bottom of the Rankings Tells a Different Story
Now, tap the SCTR again. The list flips, with the worst SCTR rankings moving to the top. Tires, Recreational Products, Computer Services, Furnishing, Gambling, and Footwear sport scores not far from zero. Retail is littered throughout the bottom quintile of the DJ Industries.
At a macro level, XRT:SPY is like the K-shaped economy illustrated and has recently tracked consumer sentiment. The retail ETF is equal-weighted, so a high-flyer like AMZN has just a minor sway on price action. What’s more, it’s not all that helpful to assess XRT’s top holdings, as the winners tend to float to the top before periodic rebalances, masking the fund’s weakness.
There are several fundamental reasons for XRT’s sour price action: sustained $4.50+ gas prices, rising inflation leading to negative real wage growth, interest rates creeping higher and, who knows... maybe even the hantavirus spooking the Street. It’s anyone’s guess.
The technicals are not up for debate, however. To be clear, there are upbeat stories, such as Starbucks (SBUX) and even Visa (V), which benefit from a strong upper-end household financial backdrop.
A Bearish Pattern Emerges
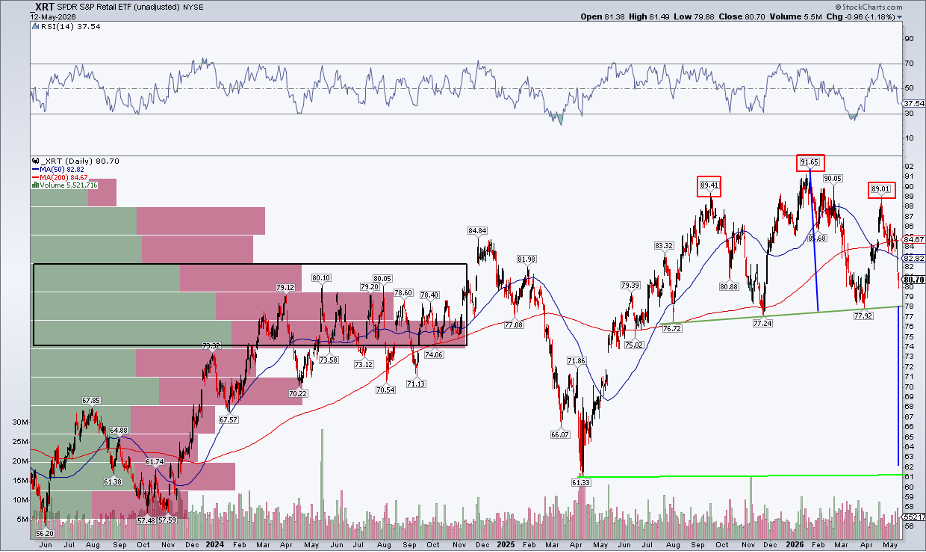
Notice in the chart below that XRT has the look of a bearish head-and-shoulders topping pattern. A neckline comes into play in the $77 to $78 range, while the broad shoulders at $89 sit just below the $92 head. The textbook says a breakdown would portend a measured-move downside price objective to $62, based on the $15 neck-to-head height and the $77–$78 neckline. Interestingly, that target has confluence with the April 2025 low in the low $60s.
Also, take a look at the long-term 200-day moving average. It’s on the rise, which is a positive, but the shorter-term 50-day moving average fell below it in a bearish death-cross pattern. For now, the presumption is that support will hold.
Earnings Week Could Decide the Next Move
The big test could come next week, when major retail companies like Walmart (WMT), Home Depot (HD), Lowe’s (LOW), TJX Cos (TJX), Target (TGT), and Ross Stores (ROST) issue quarterly results. While those stocks are not large XRT holdings, several DJ industries related to the consumer will likely move sharply.
It’s a critical moment for XRT:SPY, too. Long-term relative support is in play. A plunge to $62 would likely imply an all-time low compared to the S&P 500.
The “K” Keeps Widening
What might it take for the trend to reverse? As often happens in markets, one mega-theme’s glory is another’s shame. The AI/data-center story might have to come unraveled for sustained flows back into retail stocks.
Previous alpha periods (2009–2013 and April 2020–January 2021) coincided with economic rebirth hopes. Hence, the “K” might require breaking. Might policymakers on Capitol Hill seek to accomplish that ahead of November? Will a new Fed chair try something different? We’ll leave that to the macro pundits.
Seasonality Offers a Small Ray of Hope
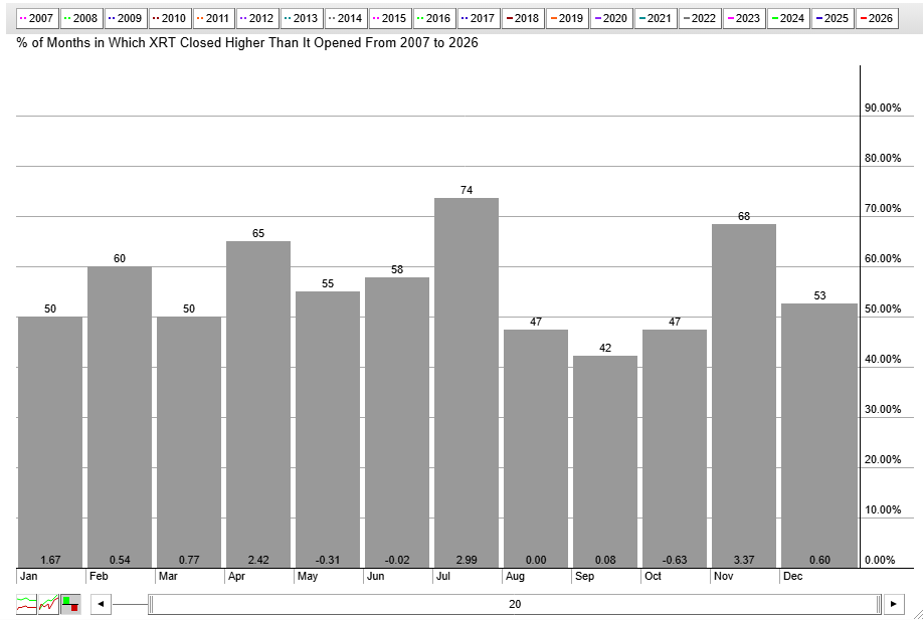
In the here and now, XRT looks forward to the nation’s semiquincentennial. Indeed, July has been the retail ETF’s best month when scanning returns over the last 20 years. Between now and quarter-end, performance tends to be lackluster.
The Bottom Line
What is retail’s underperformance telling investors? Now a stone’s throw from a record low against the S&P 500, small consumer stocks keep sagging. Recalcitrant inflation and soft spending trends among lower-wage households are clear headwinds. We’ll learn more next week when some major industry companies report their quarterly results. For now, monitoring XRT’s absolute and relative charts is critical before putting capital to work.
Disclaimer: This blog is for educational purposes only and should not be construed as financial advice. The ideas and strategies should never be used without first assessing your own personal and financial situation, or without consulting a financial professional.