Bull Flags Are Everywhere. But Are They Confirmed?
Key Takeaways
- Several stocks and the S&P 500 are displaying bull flag patterns, but they're not yet confirmed.
- Trendlines, moving averages, and indicators such as the RSI can help confirm a bull flag pattern.
- A strong move above 7700 in the S&P 500 would complete the bull flag pattern and suggest a higher upside target.
As the S&P 500 ($SPX) has pulled back from its most recent all-time high in August, I’ve noticed a proliferation of bull flag patterns for individual names. This classic continuation pattern, which I first observed in John Murphy’s fantastic Technical Analysis of the Financial Markets, can confirm that a longer-term bullish trend is still in place.
But if you read the literature on this continuation pattern, you’ll learn that recognizing the pattern isn’t enough. The pattern is only confirmed if and when the price resolves the pattern to the upside. With that in mind, let’s review some of those potential bull flag patterns to talk about capturing potential upside and avoiding unnecessary downside!
Use a checklist to validate and confirm price patterns
Five Below (FIVE) looked incredibly strong into the third week of August, finally achieving a new 52-week high after a spring selloff. The price unfortunately stalled out soon after that August breakout, and from there the stock broke below its 21-day moving average, following a brief consolidation near the recent high.
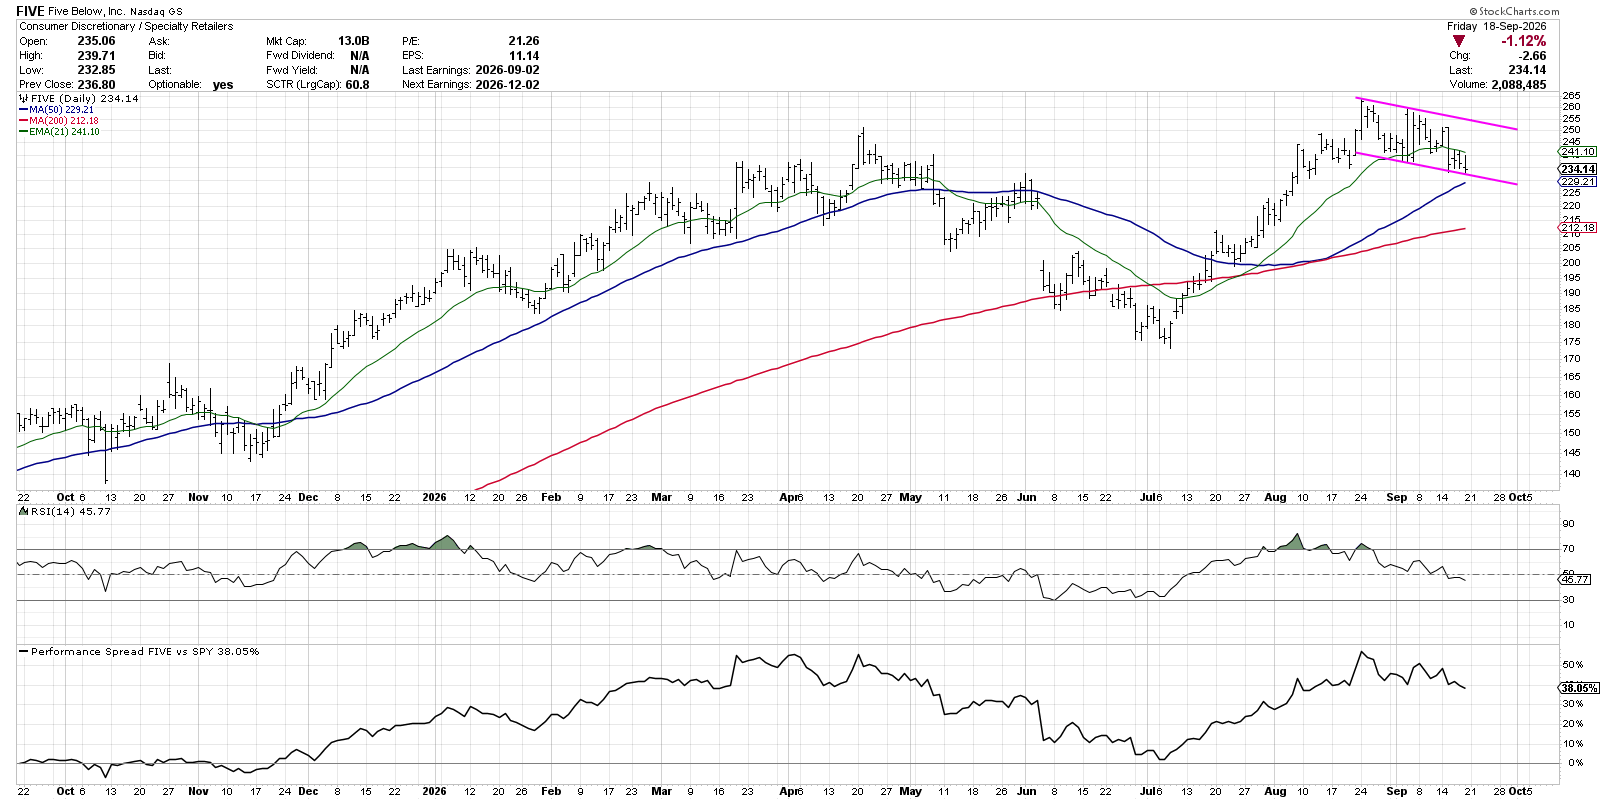
We can recognize a clear bull flag pattern, formed by a set of parallel downtrend channels based on recent swing highs and lows. Until and unless FIVE achieves a confirmed breakout above the upper boundary of the pattern, it’s just a “potential” bull flag pattern as opposed to a “confirmed” bull flag pattern.
Despite the recent pullback, Five Below has remained safely above an upward-sloping 50-day moving average. The RSI also still sits above the 40 level, confirming that the momentum is still in line with a bullish long-term trend.
BioMarin Pharmaceutical (BMRN), in the Health Care sector, is experiencing a similar technical configuration, with a potential bull flag pattern after its most recent 52-week high.
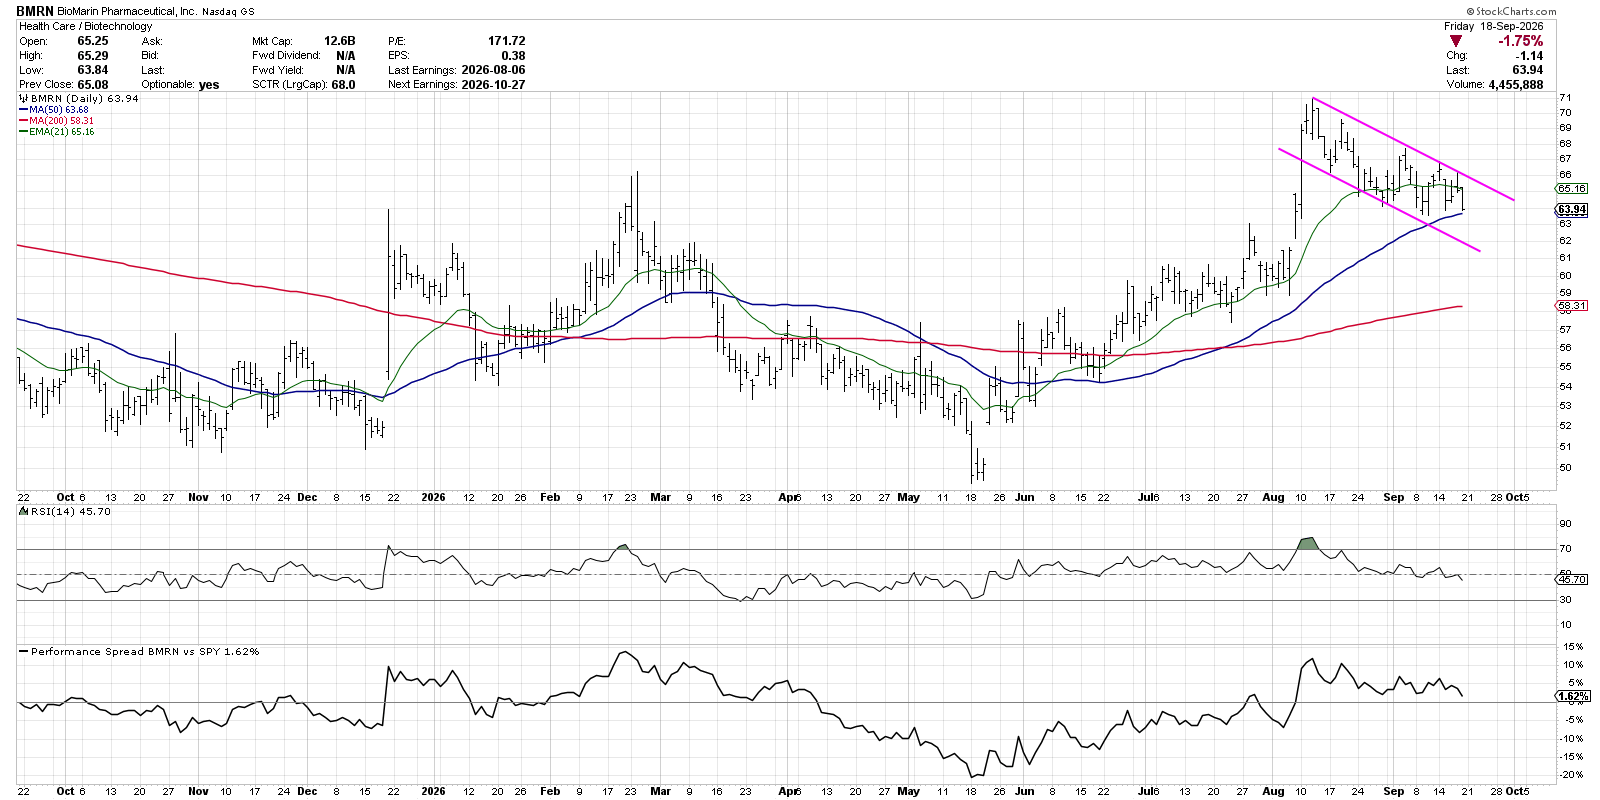
So how do we approach a chart that remains in a potential pattern that has yet to be confirmed? We need to watch for three warning signs that would essentially invalidate the “bull flag” thesis:
- The price breaks below the lower trendline, which would invalidate the entire price pattern.
- The price breaks below the 50-day moving average, which would mean the pattern is less like a potential bull flag and more like a new downtrend phase.
- The RSI pushes below 40, which would imply a more bearish momentum situation.
Moving averages still matter!
Honestly, the chart of Charles Schwab (SCHW) isn’t a great example of a potential bull flag pattern. It could be perhaps better labeled as a bullish wedge pattern, but I think the most important factor here is that in this case, unlike the first two examples, the price has already broken below the 50-day moving average.
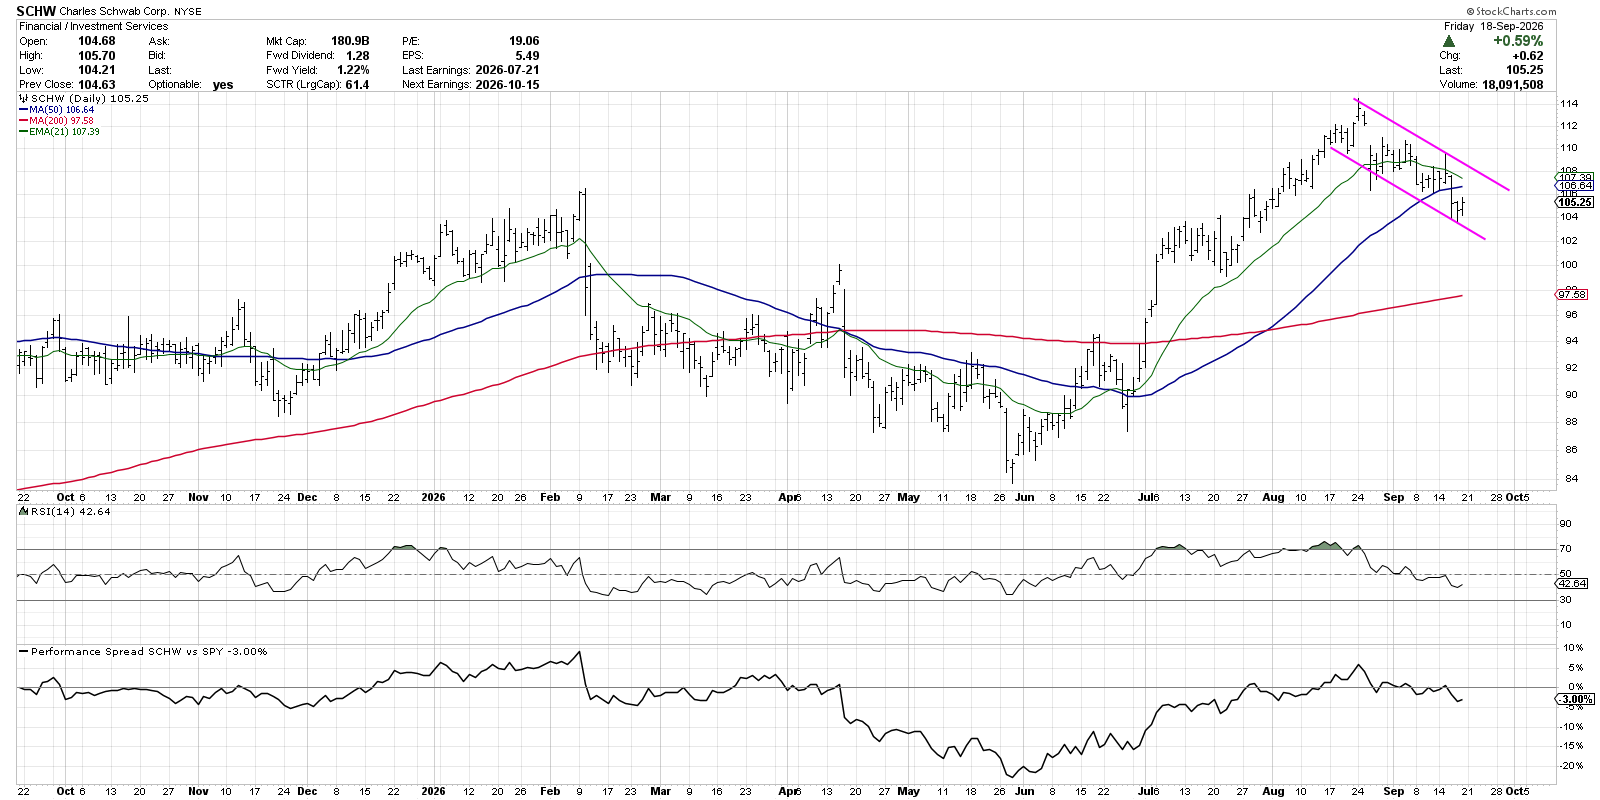
I would say that the price having broken below the 50-day suggests that SCHW is in a less favorable technical setup than the others we’ve reviewed. However, similar to the checklist we discussed above, I would say that the stock needs to break above the upper trendline and maintain a bullish RSI reading to confirm a long-term bullish thesis.
The S&P 500 is demonstrating a similar framework
If these potential bull flag patterns look a little familiar, that may be because the S&P 500 index itself is in a very similar situation. After its first time reaching the 7800 level, the benchmark has established a clear short-term pattern of lower highs and lower lows.
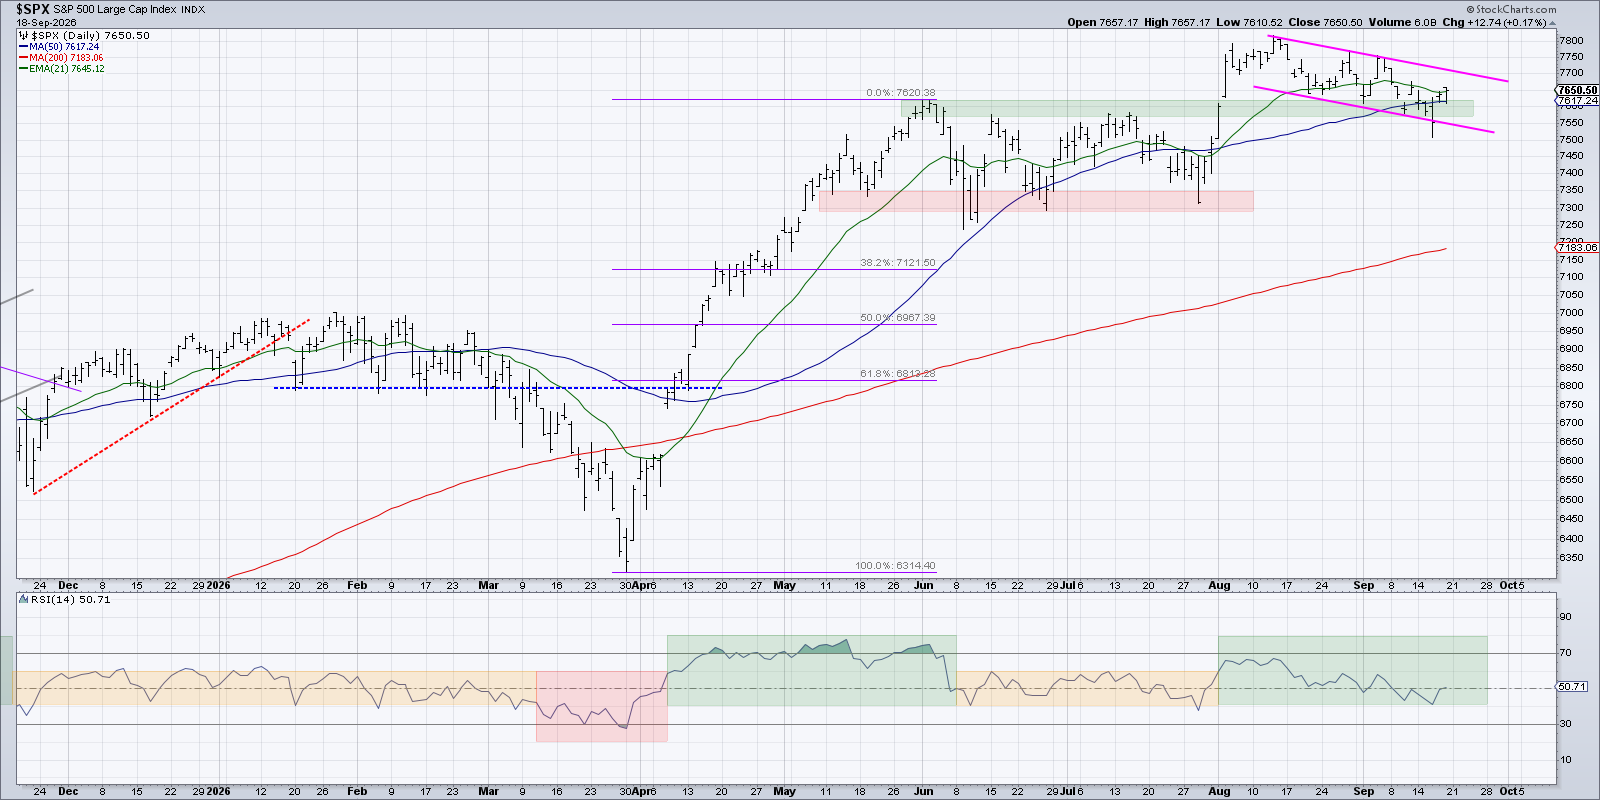
As we mentioned earlier this week to our Market Misbehavior premium members, Wednesday’s breakdown below the lower boundary would only invalidate the pattern if there was a bearish follow through day on Thursday. But after Thursday’s rally and Friday’s strong close, the potential bull flag pattern remains firmly in place going into next week.
So if we observe a strong move above around 7700 next week, the S&P 500 would complete the bull flag pattern and suggest a much higher upside target going into October. But we’ll also be reviewing the checklist for a potential breakdown, as weaker price action and more bearish momentum could rewrite this chart from a bull flag pattern to a new distribution phase for equities.
For a deeper discussion of the three stocks along with others featured in a recent Barron’s article on compelling stocks outside of AI, just head over to the StockCharts TV YouTube channel!
RR#6,
Dave
P.S. Ready to upgrade your investment process? Check out my free behavioral investing course!
David Keller, CMT
President and Chief Strategist
Sierra Alpha Research LLC
marketmisbehavior.com
https://www.youtube.com/c/MarketMisbehavior
Disclaimer: This blog is for educational purposes only and should not be construed as financial advice. The ideas and strategies should never be used without first assessing your own personal and financial situation, or without consulting a financial professional.
The author does not have a position in mentioned securities at the time of publication. Any opinions expressed herein are solely those of the author and do not in any way represent the views or opinions of any other person or entity.