MAGS Takes the Lead and Makes Waves
Key Takeaways
- The Mag 7 ETF (MAGS) is starting to make waves.
- MAGS has broken out of a bullish continuation pattern.
- From there, MAGS has been following through on the breakout with positive relative strength.
The Roundhill Big Tech ETF (MAGS), which is comprised of the Mag 7 stocks, struggled in June–July, but got its mojo back in August with a breakout. Not only did the ETF break out, however, but it also followed through on this breakout with a strong September. MAGS is even starting to outperform.
MAGS: Bullish Continuation Pattern and Break Out
The first chart shows weekly candlesticks for MAGS over the last three years. MAGS moved from 28 in Q4 2023 to 71 this month. There were three corrections and one triangle consolidation along the way. The blue lines define these corrections with the pink lines marking the resistance levels. MAGS followed through on each breakout with a move to new highs.
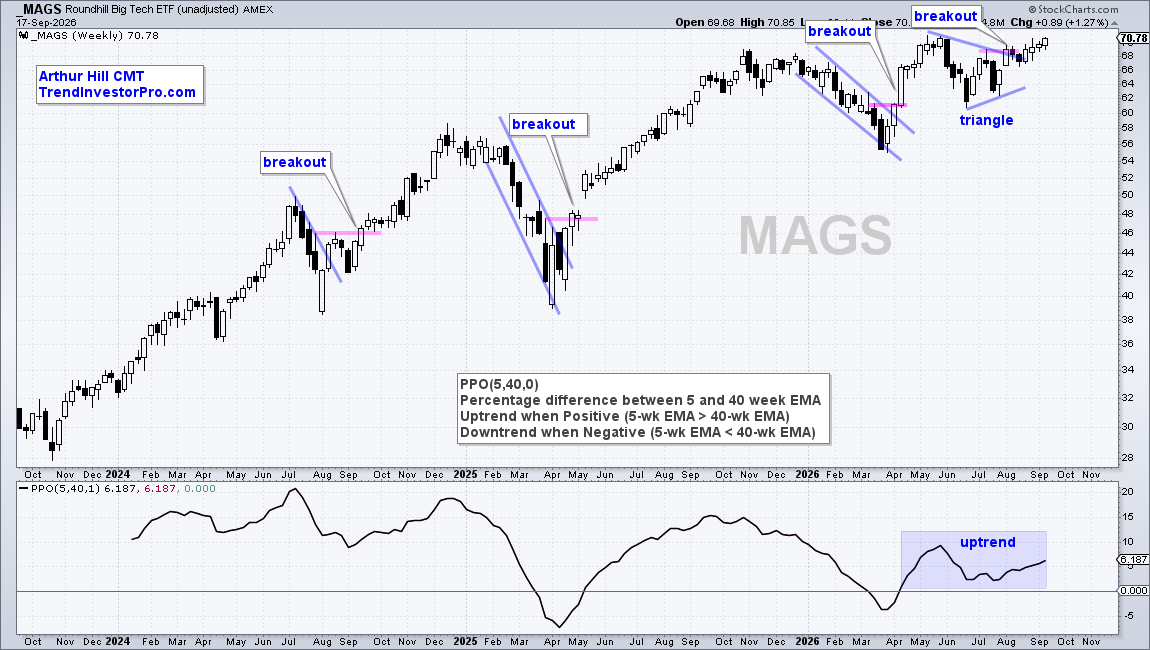
Most recently, MAGS surged to new highs in May and then corrected with a triangle consolidation. Triangles are typically continuation patterns that take their trading bias from the direction of the prior move, which, in this case, was up. Thus, the triangle is a bullish continuation pattern and the breakout signals a continuation of the bigger uptrend.
The bottom window shows the PPO (5,40,0), which serves as a litmus test for the trend. The Percentage Price Oscillator (PPO) turned negative in March–April the last two years as MAGS fell rather sharply, but turned positive just after the breakouts in April 2025 and April 2026. This trend indicator currently signals an uptrend with a positive reading.
This is the first of two reports/videos on the MAG7. The second report analyzes the seven stocks. We identify two clear leaders and two stocks that are setting up bullish. Two charts show excessive volatility, which excludes them from my watchlist. One stock is clearly the weakest, and there is even a bearish setup working. Click here to take a trial and gain immediate access.
MAGS Extends on Breakout, Shows Relative Strength
The next chart shows daily bars with a relative performance indicator. MAGS surged 29% with a strong advance to 70 in May. It then corrected hard with a decline to 61 in June. Despite this sharp decline, the move retraced 61.8% of the prior advance, which is normal for a correction.
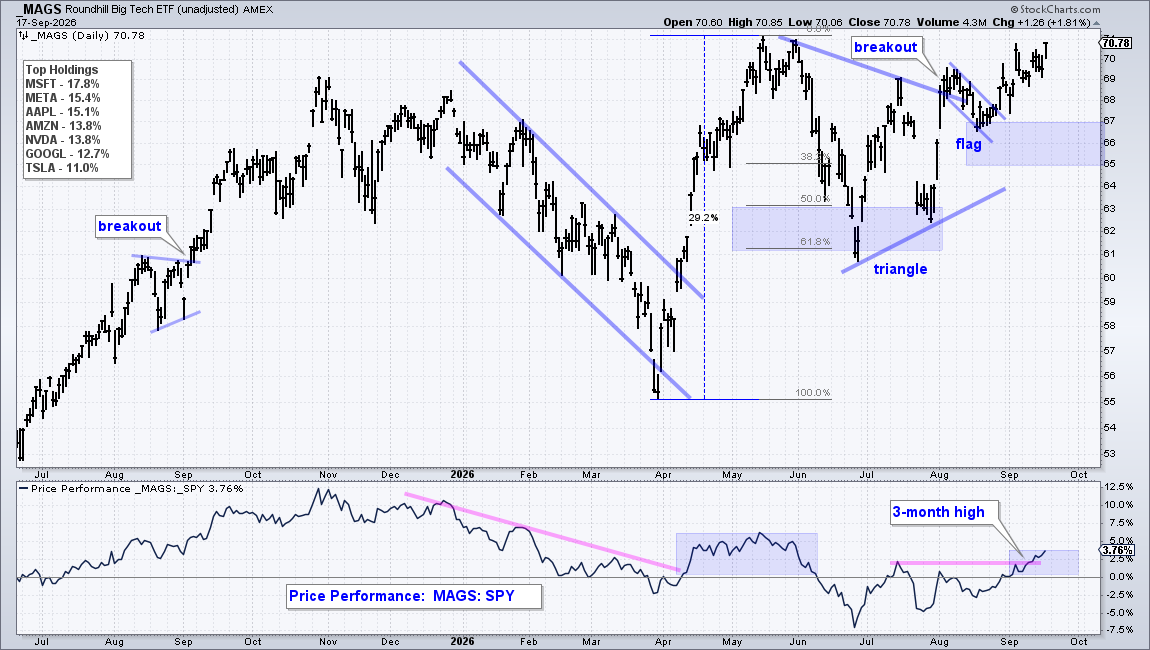
Trading was quite volatile in June–July as the ETF produced four price swings greater than 9% (down, up, down, up). Chartists need to push volatility aside and focus on the patterns at work. A triangle ultimately formed and MAGS broke out in early August. Just as importantly, MAGS followed through on this breakout with an advance above 70. New highs are expected, and a close below 65 would call for a re-evaluation.
The indicator window shows Price Performance (_MAGS:_SPY) turning positive in September and exceeding its July high. This positive turn means MAGS is outperforming again. A triangle breakout and relative strength are a bullish combo.
Click here to take a trial to TrendInvestorPro and gain access to our follow up report covering the seven stocks in MAGS.