Don't Chase Breakouts! Wait for Confirmation

It’s easy to get super bullish before a chart has proven itself. As the price approaches a key level of resistance, it’s tempting to just hope (a four-letter word for investors!) that the price will break right through resistance and continue to further highs. But mindful investors know that once we have identified a clear level of resistance, it’s crucial to wait for a breakout and then confirmation, because only then can we determine the new accumulation phase.
Here are three charts that have all shown recent strength and are testing key levels of resistance, but still need confirmation to validate a new breakout phase.
DoorDash Inc. (DASH)
DASH spent much of the last four months bouncing off support in the $145–150 range. From that latest bounce in mid-June, the stock has trended higher to finally reach a confluence of resistance.
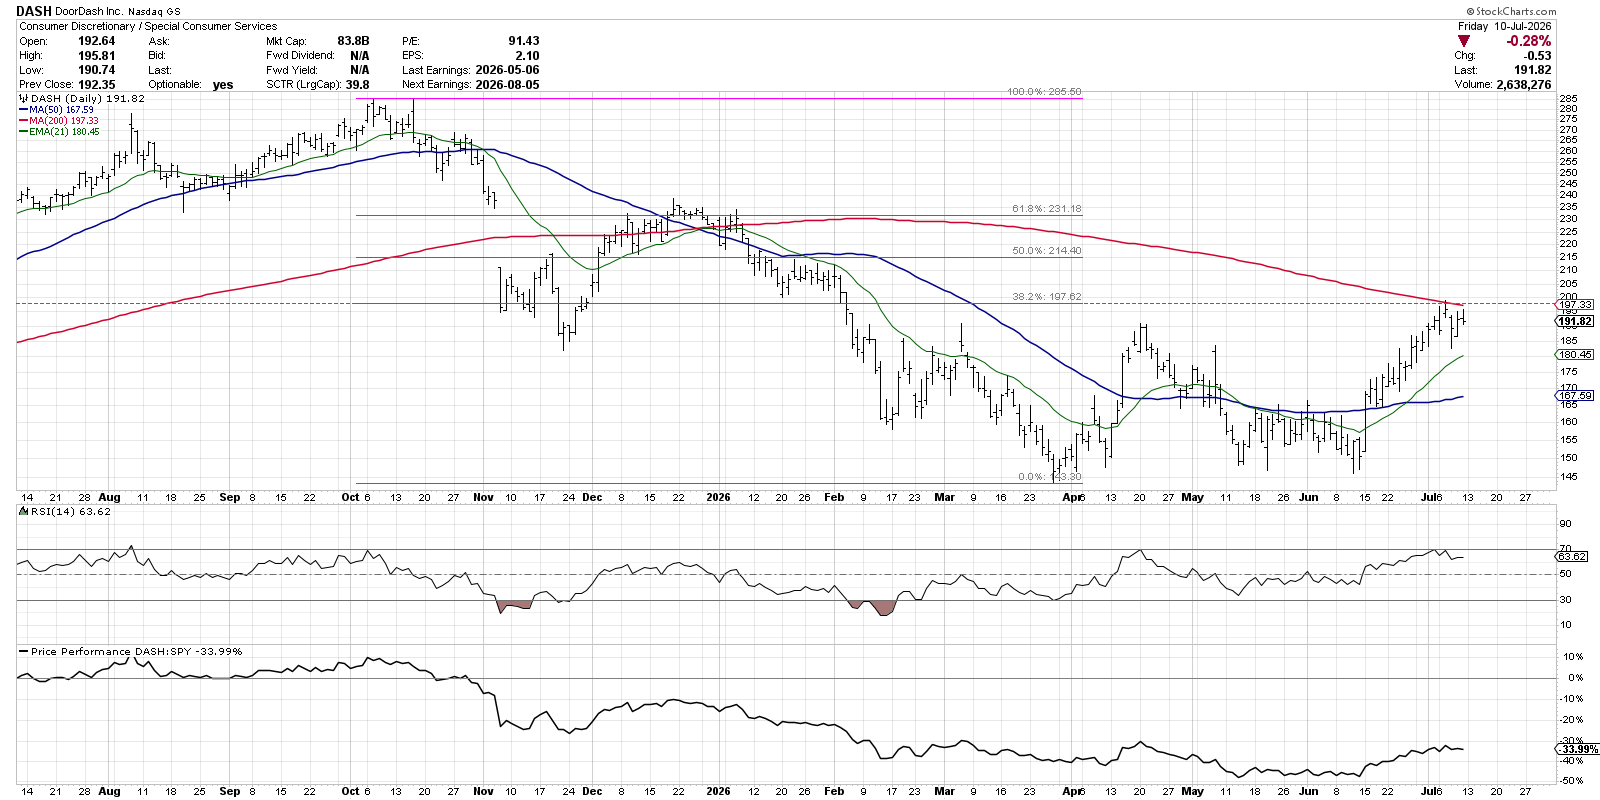
Here, we can see that the 200-day moving average lines up well with the 38.20% Fibonacci retracement level, suggesting an important region of resistance. If DoorDash can power above this crucial threshold, then we would consider the price to be in a new accumulation phase. But without a valid close above $198 and then a “follow through” move in that same direction, we would consider the stock to still be in a larger consolidation phase. We are looking for charts that trade not just to resistance, but through resistance!
SPDR S&P Aerospace & Defense ETF (XAR)
For pretty much the entirety of 2026, XAR has been in a basing pattern, which basically means a rectangular shape on the chart. With fairly consistent support and resistance levels, the price is in equilibrium as buying power and selling pressure are fairly balanced.
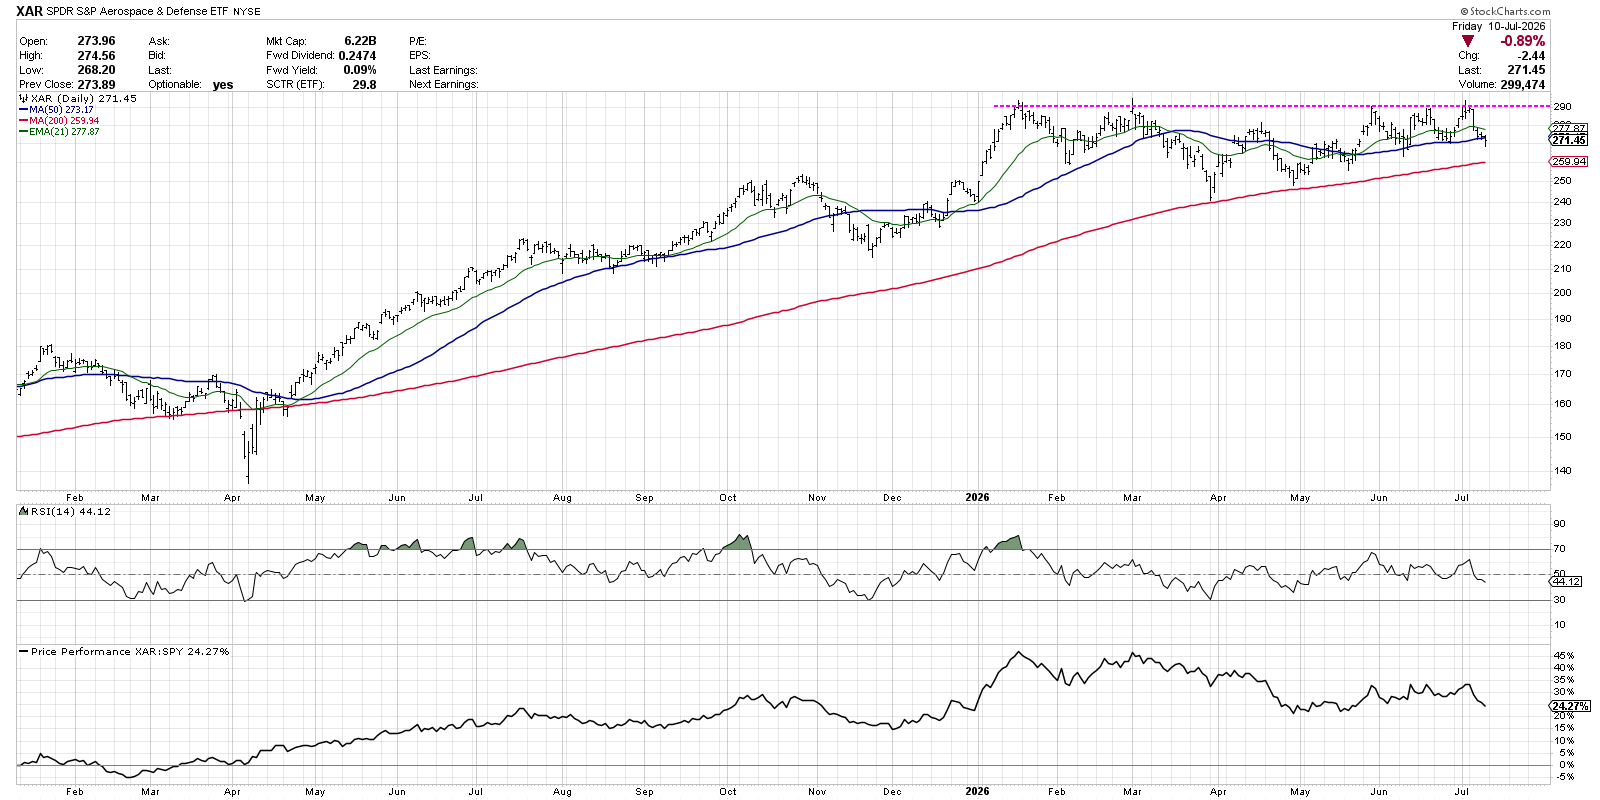
In this case, we’re looking for the infamous “Big Base Breakout” where the price finally breaks out of a sideways range after months of failing to do so. If XAR can pop above $290, that would imply a new accumulation phase as anecdotal buyers have now taken control. Unless that happens, though, we’d consider this aerospace & defense ETF to still be in a sideways trend.
The lesson: Don’t force an opportunity; wait for the price to tell you the opportunity is now!
Defiance Quantum ETF (QTUM)
Finally, we have an ETF built around quantum names and related businesses. Similar to XAR, this chart has been in a sideways trend, though for a much shorter time. In this case, the momentum indicators can confirm the consolidation phase, as well as help identify when that phase is over.
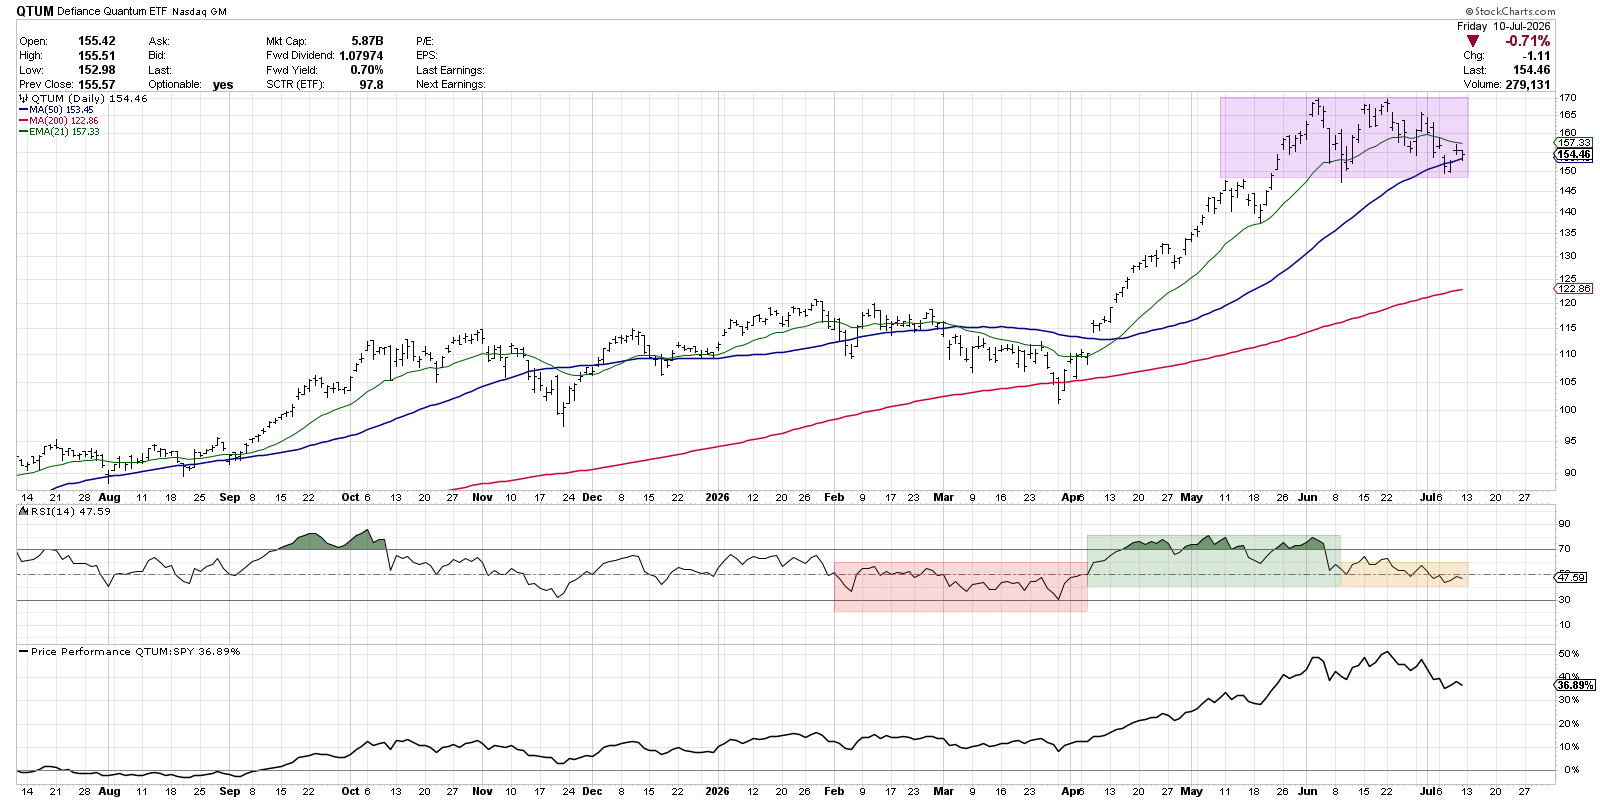
QTUM has been rangebound between resistance at $170 and support around $150. Notice the RSI at the bottom and how, in recent weeks, the indicator has settled into a neutral range between 40 and 60. In this example, the neutral momentum readings help us to confirm the lack of conviction in the price.
To be honest, a pattern like this could resolve in either direction, and there’s nothing specific on the chart today that tells me which way it will break. What I do know is that, by watching for a price breakout and confirming that breakout with a strong move in price momentum, we can improve our chances to follow the next big directional shift for QTUM.
As much as we can be tempted to “force a trade” by just taking a position and hoping it works out, these breakout strategies hopefully will help you focus on actionable charts where price moves and momentum shifts are confirmed.
By the way, two of these charts were featured in our recent video covering the top ten charts to watch for July 2026, which you can find on the StockCharts TV YouTube channel!
RR#6,
Dave
P.S. Ready to upgrade your investment process? Check out my free behavioral investing course!
David Keller, CMT
President and Chief Strategist
Sierra Alpha Research LLC
marketmisbehavior.com
https://www.youtube.com/c/MarketMisbehavior
Disclaimer: This blog is for educational purposes only and should not be construed as financial advice. The ideas and strategies should never be used without first assessing your own personal and financial situation, or without consulting a financial professional.
The author does not have a position in mentioned securities at the time of publication. Any opinions expressed herein are solely those of the author and do not in any way represent the views or opinions of any other person or entity.