The Mag 7 Just Woke Up. Can Tech Lead the Market Higher?

Key Takeaways
- Chip stocks led Thursday’s stock market rally, but semiconductor ETF SMH needs follow-through above its 21-day moving average.
- Big Tech stocks are showing early signs of recovery, with MAGS bouncing from its 200-day moving average and META gaining strength.
- Risk appetite may be improving as oil pulls back, Bitcoin firms up, and the S&P 500 breaks through a key level.
It felt like a semiconductor kind of day in the stock market.
Renewed geopolitical tensions between the U.S. and Iran weren’t enough to keep chip stocks down. Wall Street appears less concerned about the recent developments in the Middle East than it was on Wednesday. The Cboe Volatility Index ($VIX) is below 20, oil prices have pulled back, and stocks are pushing higher.
Semiconductors Take the Lead
That optimism showed up in Thursday’s price action across most chip stocks. The VanEck Semiconductor ETF (SMH) closed up 2.48%, although it closed near the lower end of its daily range and just below its 21-day exponential moving average (EMA). This is a reminder that in the stock market, sentiment can turn on a dime.
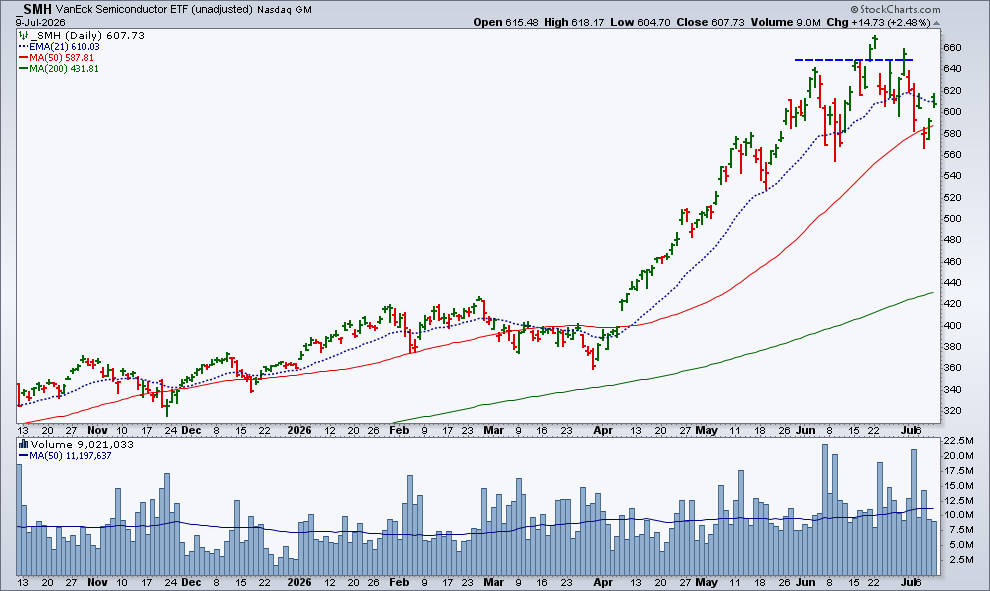
Also note that volume is below average, although this could be because July tends to generally be a light trading month.
Can the Mag 7 Reclaim Leadership?
The Roundhill Big Tech ETF (MAGS) also closed higher, bouncing off the 200-day simple moving average (SMA). Since it’s been a while since the Magnificent Seven have gotten some love, let’s take a closer look at MAGS.
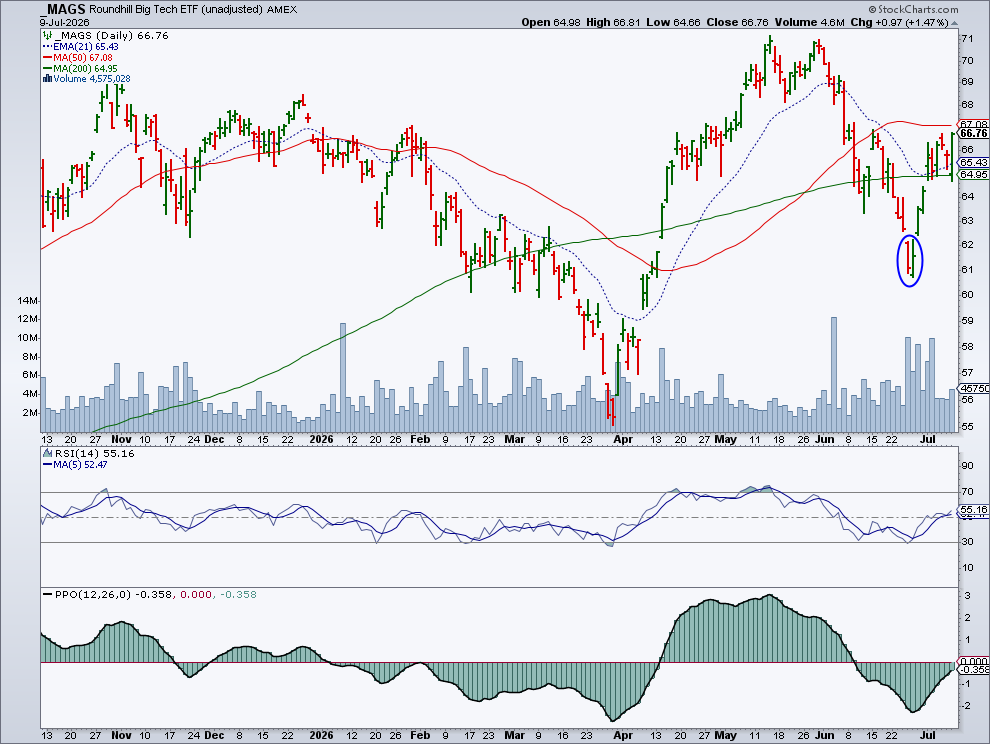
After it bounced off the 200-day SMA, MAGS closed near its high of the day. Since its June 26 low, the ETF has posted several strong up days on above-average volume. The 50-day SMA could act as resistance but, if MAGS overcomes that level with strong momentum behind it, the Mag 7 could step back into a leadership role.
Momentum is still soft, but there are signs of improvement. The Relative Strength Index (RSI) and Percentage Price Oscillator (PPO) are beginning to recover.
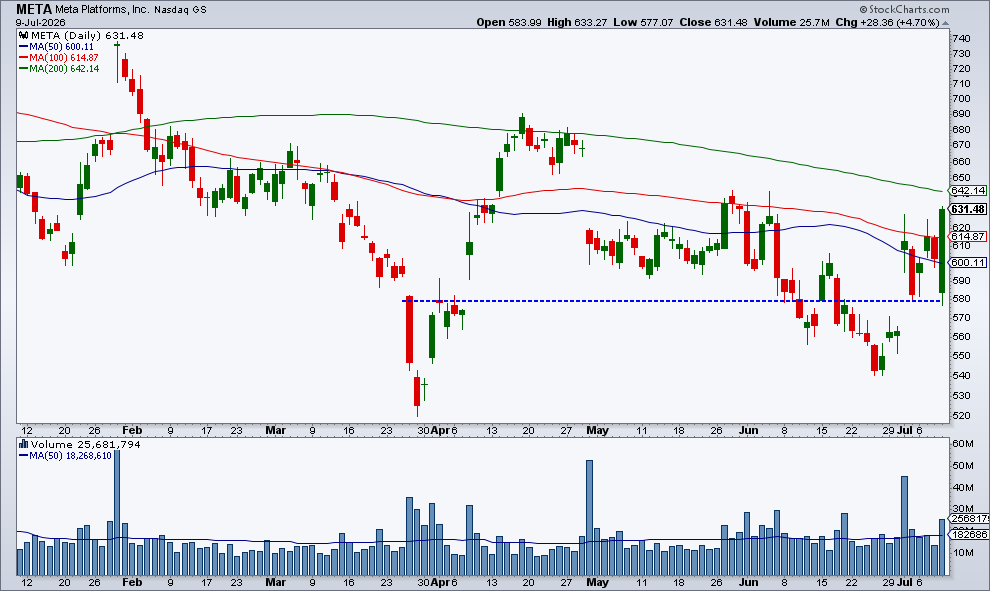
The biggest Mag 7 mover on Thursday was Meta Platforms (META), which gained 4.70%. The bullish engulfing pattern in META’s chart is worth a closer look. The stock bounced off a key support level (blue dashed horizontal line), closed at the high of the day’s trading range, and is moving closer to its 200-day SMA.
Technology stocks are showing signs of life. If this renewed optimism continues, don’t be surprised if the broader market makes another attempt at new highs.
The PerfChart below shows that, year-to-date, MAGS has lagged the SPDR S&P 500 ETF (SPY), Invesco QQQ Trust (QQQ), Invesco S&P 500 Equal Weight ETF (RSP), SPDR S&P MidCap 400 ETF (MDY), and iShares Russell 2000 ETF (IWM).
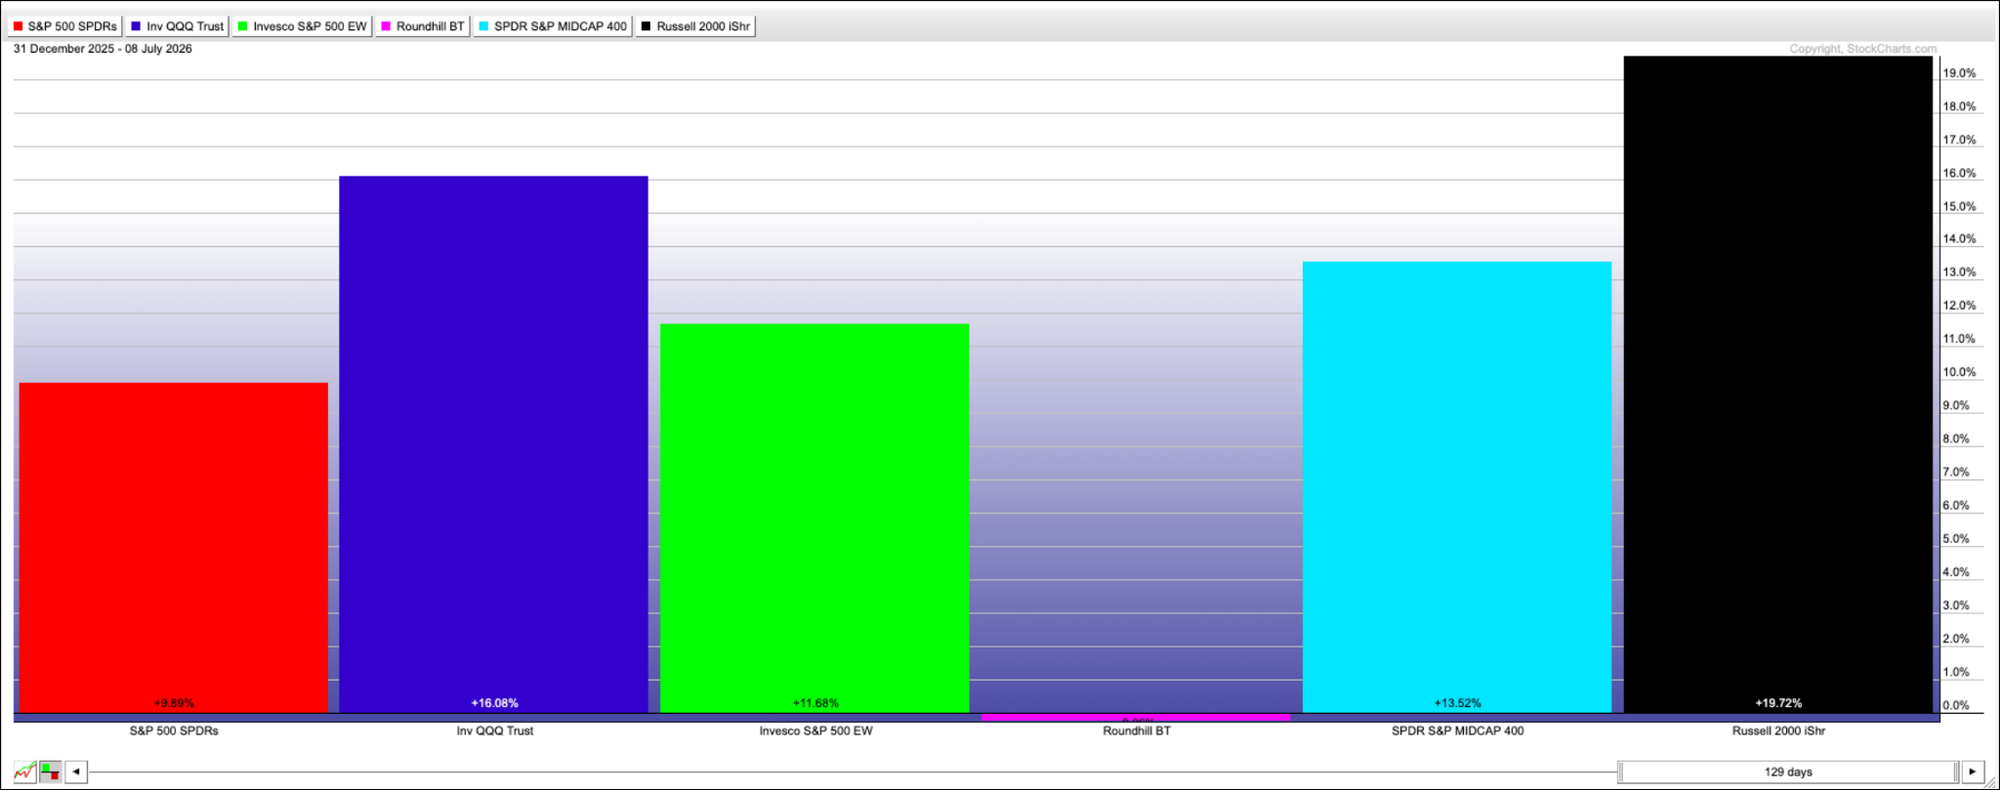
Will MAGS catch up with the rest of the pack? That will depend on follow-through. Earnings season is coming up, and strong reports from these companies could give the group a chance to make up some lost ground.
S&P 500 Breadth Still Looks Healthy
Strength in technology stocks helped the S&P 500 ($SPX) break through 7,500. If the index holds above this level, it could make another run toward its all-time high, although it could face resistance around the 7,560 level.
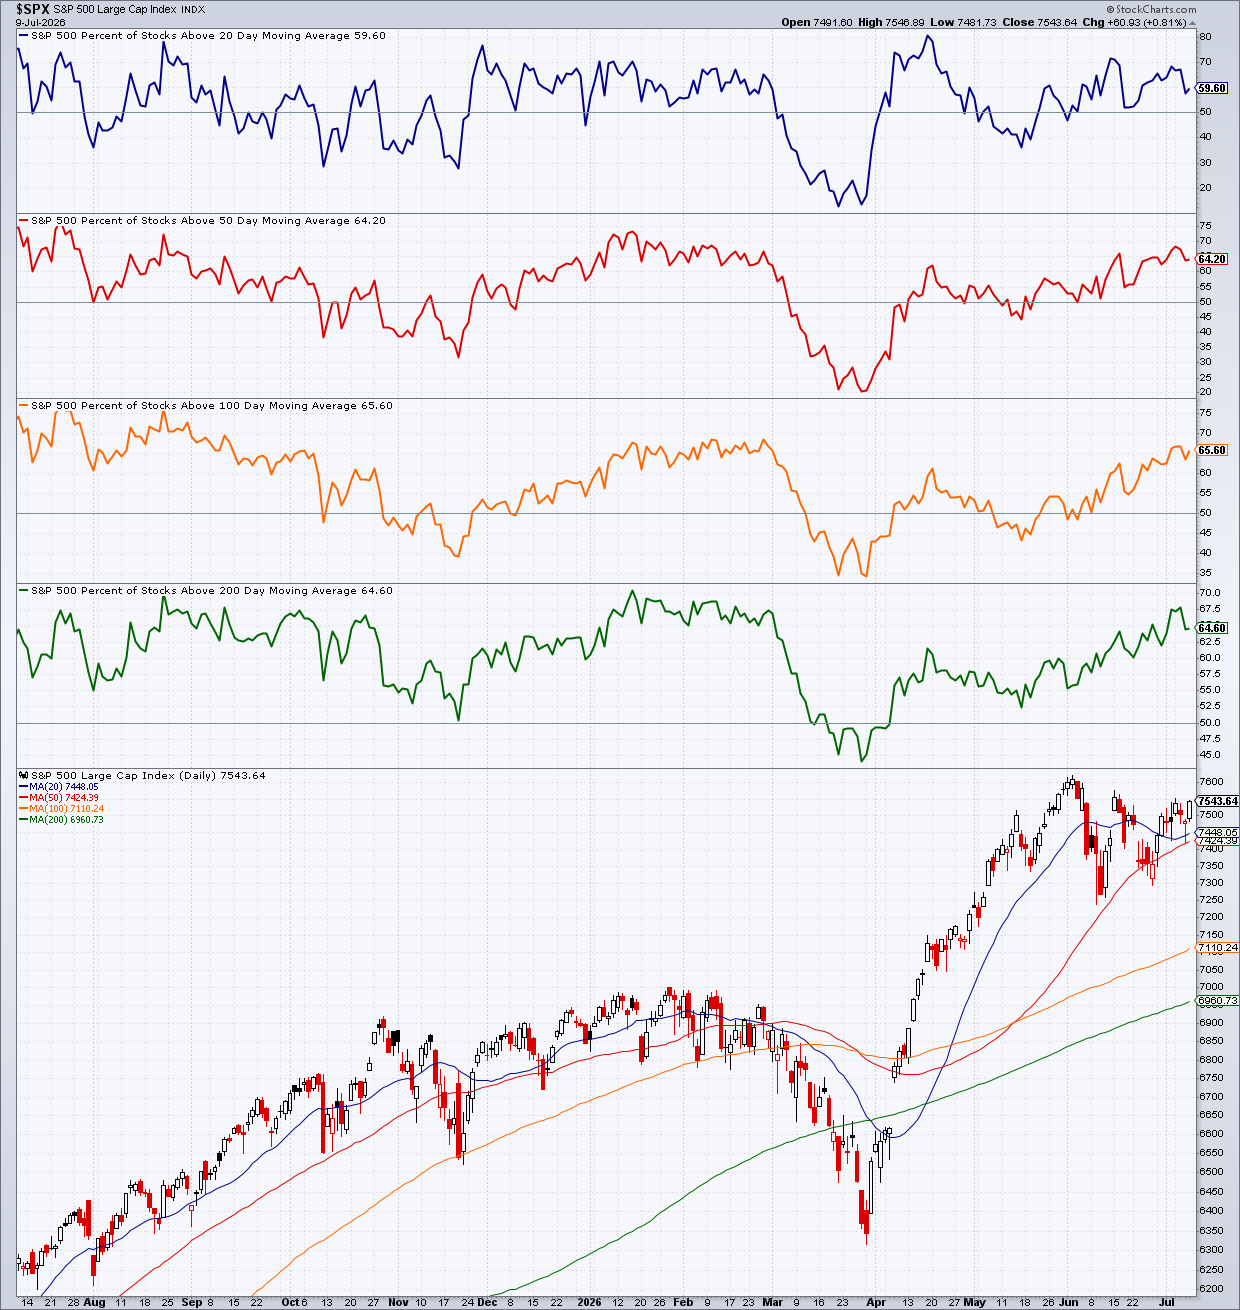
If the S&P 500 fails to stay above 7,500, the next downside level to watch is the 50-day SMA, currently at around the 7425 level. Below that, the 7,260–7,300 zone becomes an important support area. That range lines up with the May 5 close and the mid-June lows.
When the broader market hesitates to move higher, it’s natural to question whether the market has reached a top. Right now, the evidence doesn’t point that way, with Thursday’s price action suggesting this market may still have some legs.
In the chart of the S&P 500, the lower panels show the percentage of S&P 500 stocks trading above their 20-, 50-, 100-, and 200-day moving averages. More than 50% of stocks are trading above these moving averages. This suggests that the market internals are relatively healthy.
Is Risk Appetite Returning?
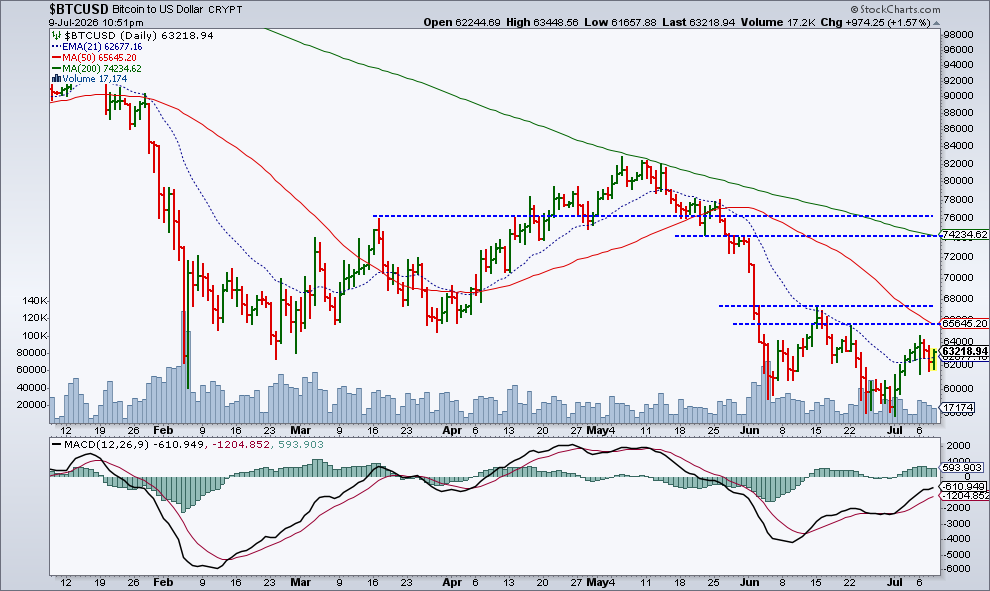
One asset group showing early signs of recovery is cryptocurrencies. After a rough stretch, crypto is beginning to show signs of life. It’s not enough yet to confirm a strong reversal, but it’s worth watching.
The chart of Bitcoin to US Dollar ($BTCUSD) below shows Bitcoin trading above its 21-day EMA. Several resistance levels (horizontal blue dashed lines) still need to be cleared before a stronger upside move is confirmed. If that happens, it would suggest investor risk appetite is improving, which would be a big plus for stocks.
Oil Pulls Back
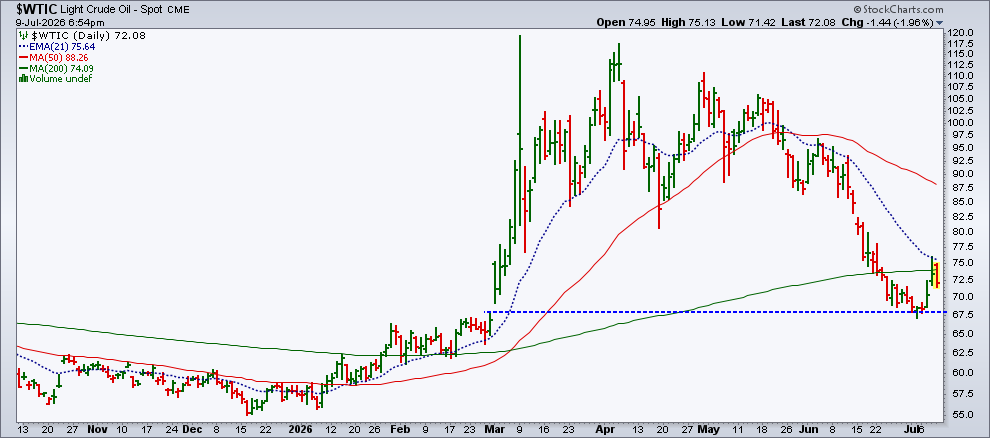
After rising 4.37% on Wednesday, Light Crude Oil ($WTIC) fell 2.35% on Thursday. This further suggests the stock market isn’t being pressured by the latest Middle East headlines. One possible reason is that, despite the tensions, oil tankers are still moving through the Strait of Hormuz.
From the chart below, oil prices remain in a downtrend. The 21-day EMA has continued to act as an important resistance level.
What to Watch Next
On Friday, SK Hynix, the South Korean chipmaker, starts trading on the Nasdaq. Could it give semiconductors another lift? That’s one thing to watch as this trading week comes to a close.
Additionally, keep an eye on cryptocurrencies and crude oil. The stock market can make erratic moves from one day to the next. You can’t control what the market does, but you can control how you manage your positions.
Disclaimer: This blog is for educational purposes only and should not be construed as financial advice. The ideas and strategies should never be used without first assessing your own personal and financial situation, or without consulting a financial professional.