Earnings Season Chart Watch: Breakout, Breakdown, or Bounce?

With about 20% of the S&P 500 members reporting earnings this week, investors are understandably focused on how key charts are fluctuating as they go into and come out of the quarterly earnings release. While investors are often most interested in a backward-looking assessment of whether a company beat or missed their estimates, experts have shared with me that it’s way more important to evaluate forward-looking expectations for future earnings growth.
With that premise in mind, let’s see how three S&P 500 members have reacted following this week’s earnings release, in order to appreciate what the charts can tell us about expectations going forward for these key large-cap names.
The Big Breakout: CSX
We’ve been tracking the surge higher in freight, logistics, and railroad stocks on our daily market recap show. One key question for this week was whether these names would come out of Q1 earnings season reflecting upgraded expectations or deteriorating outlooks.
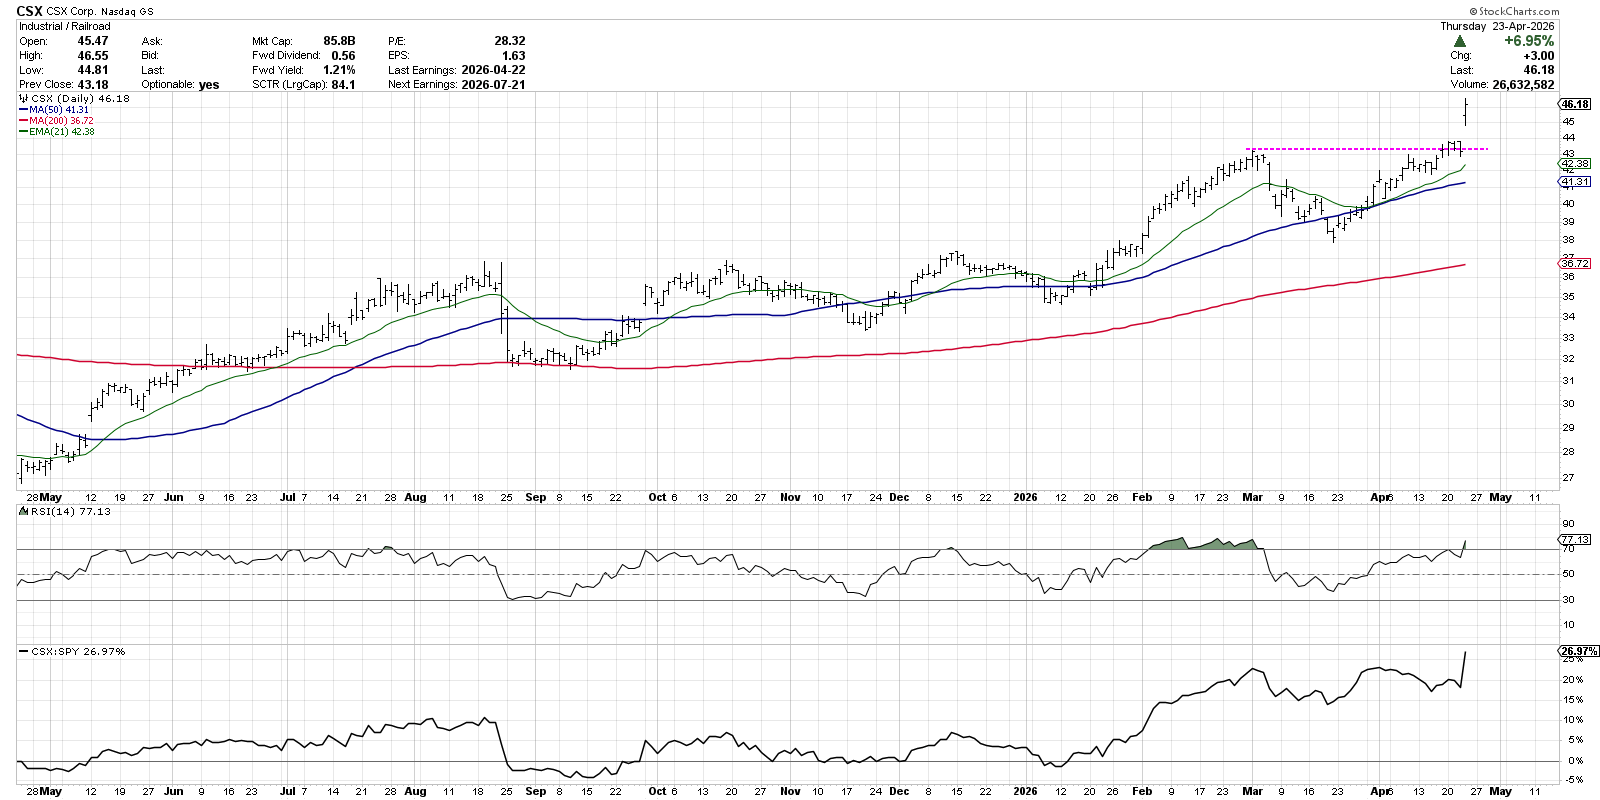
Shares of CSX Corp. (CSX) popped higher on Thursday after reporting earnings on Wednesday after the close. The stock had stalled out this week as the price retested its previous all-time high from early March. This post-earnings jump higher implies plenty of optimism for this railroad giant, and confirms a bullish trend structure with the price remaining above three upward-sloping moving averages.
After a gap higher after earnings, I’m always watching to see if that gap higher is validated by further buying power. If we see further upside in the days to come, that would result in a bullish “gap and run” pattern. If the stock fails going into next week, a “gap and fail” pattern could result in a quick retest of the breakout level around $43.50.
Waiting for Confirmation: HCA
Health care provider HCA Healthcare (HCA) is set to report earnings on Friday of this week. Going into earnings, I’m noting an absolutely crucial support level at $460. This level was first established in December 2025, and the price has continued to respect this key “line in the sand” into this week.
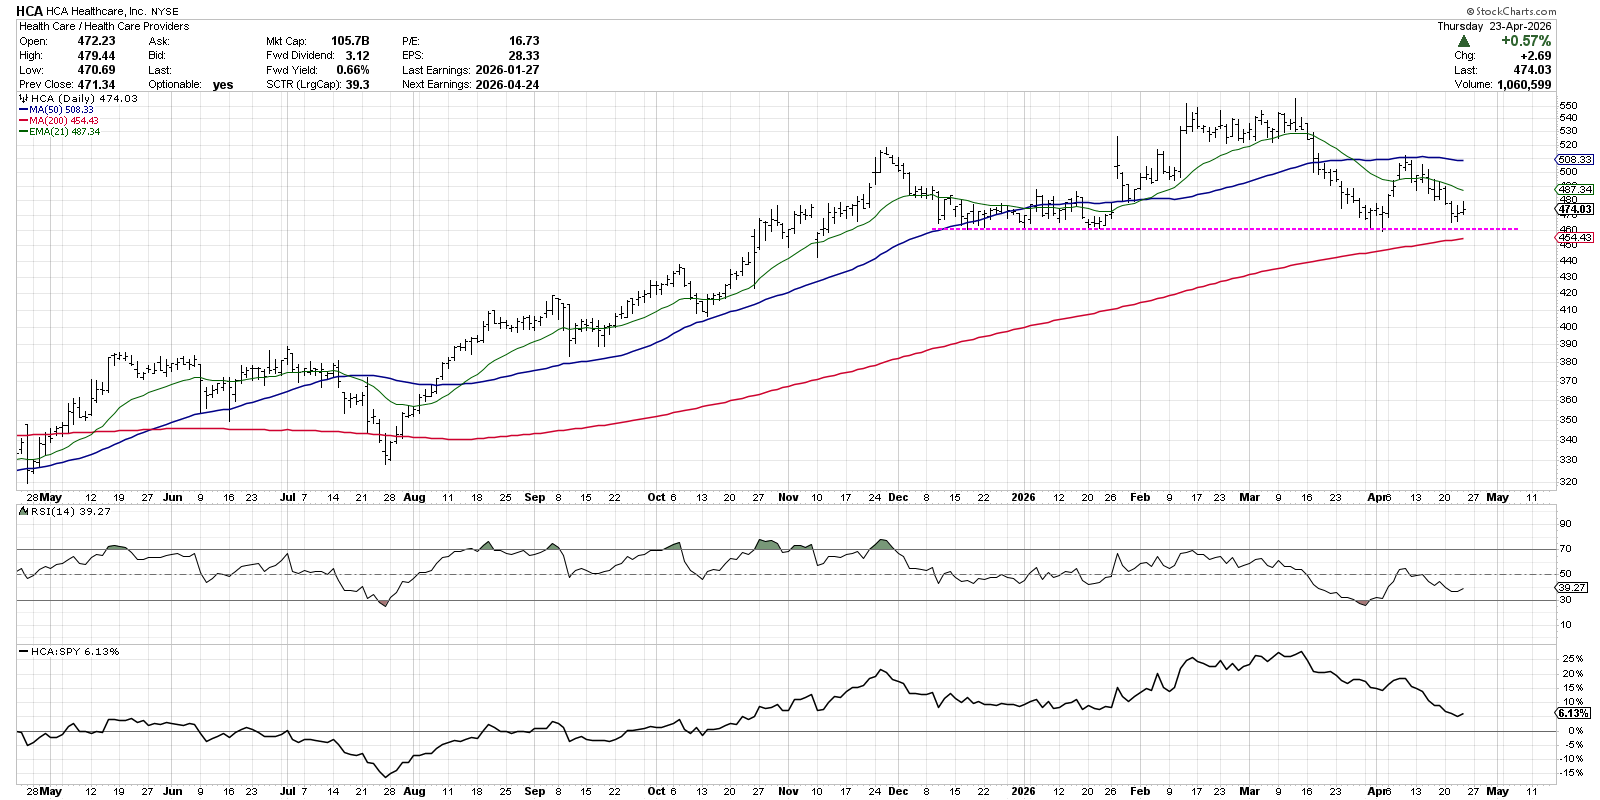
I’d hesitate to label this a “head-and-shoulders” pattern, mainly because of the asymmetry between the left and right sides of the pattern. However, if there are further tests of support at $460, HCA could eventually develop a “complex head-and-shoulders” topping pattern.
No matter how we label this pattern, it seems clear that a break below $460 would take the stock below a significant support level and the 200-day moving average. If we see lowered expectations from the Street after this week’s earnings, a break below this “line in the sand” would be a likely scenario. On the other hand, a boost to analysts’ expectations could unlock a move above the 50-day moving average around $508, and imply much greater potential upside.
A Painful Breakdown: RTX
Aerospace names, including Raytheon Technologies (RTX) are providing a classic example of the famous market maxim, “Buy the rumor, sell the news.” These stocks all rallied strongly as conflicts in the Middle East and Ukraine were continuing to evolve. But once hostilities finally broke out between the US and Iran, charts like RTX immediately started to push lower.
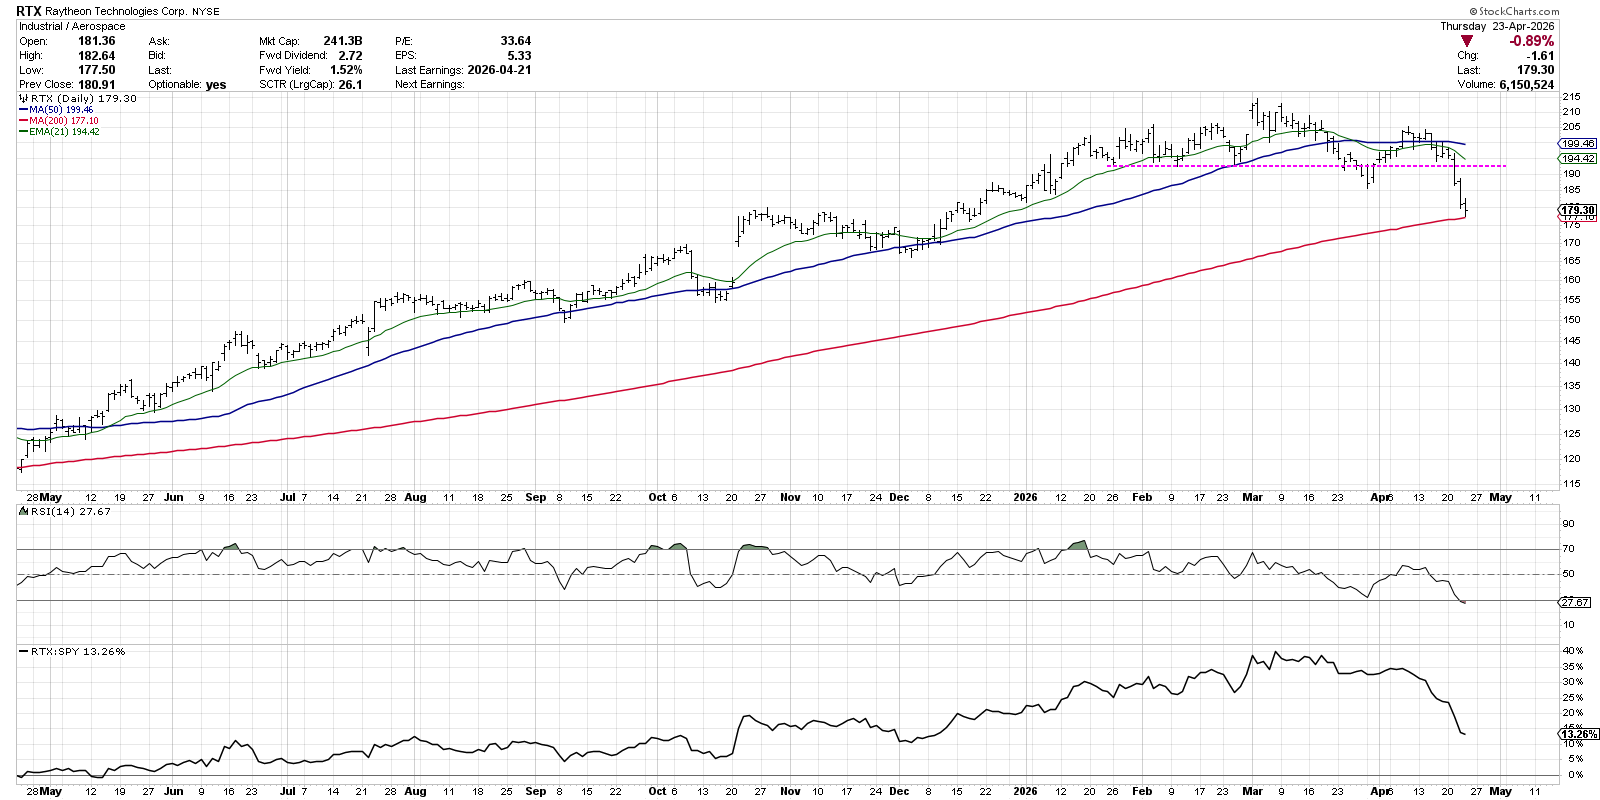
Similar to the chart of HCA, I wouldn’t consider this to be an ideal example of a head-and-shoulders topping pattern. However, the break below key support around $193 provided an important signal of increasingly negative price momentum. Now the stock is facing its 200-day moving average, providing one final level of potential support before this chart declines into a full-on bearish trend.
This distribution phase is perhaps best illustrated with the RSI indicator, which has become oversold for the first time since April 2025. Note how the most recent upswing earlier in April brought the RSI just above 50, but not quite to the 60 level. This suggests a bearish rotation for RTX with no real signs of stability. If the stock finds support at the 200-day moving average, only an upswing combined with much stronger momentum could change the bearish outlook.
While some investors believe in stepping away from the charts during earnings season, I have found that price action can provide an essential read on investor sentiment. If investors are encouraged about the future prospects of a company’s earnings potential, the stock price will start to reflect that optimism!
RR#6,
Dave
P.S. Ready to upgrade your investment process? Check out my free behavioral investing course!
David Keller, CMT
President and Chief Strategist
Sierra Alpha Research LLC
marketmisbehavior.com
https://www.youtube.com/c/MarketMisbehavior
Disclaimer: This blog is for educational purposes only and should not be construed as financial advice. The ideas and strategies should never be used without first assessing your own personal and financial situation, or without consulting a financial professional.
The author does not have a position in mentioned securities at the time of publication. Any opinions expressed herein are solely those of the author and do not in any way represent the views or opinions of any other person or entity.