Health Care Looks Healthy Again with Participation Surge and Price Breakout
Key Takeaways
- Long-term breadth is improving for the Health Care sector.
- The percentage of healthcare stocks above the 50-day EMA has been surging.
- The Health Care Select Sector SPDR (XLV) hit a key retracement zone and reversed with a breakout.
Chartists looking for participation shifts can monitor the percentage of stocks above their 200- and 50-day exponential moving averages (EMAs). StockCharts tracks these indicators for the major indexes and the sector SPDRs. Today's report will focus on big participation shift in sector breadth and chart analysis for the Healthcare SPDR (XLV).
Long-Term Breadth Improves for Health Care Sector
The table below shows the percentage of stocks above their 200-day EMAs for the 11 sectors and the S&P 500, which serves as the benchmark (blue outline). Sectors with a higher percentage of stocks above their 200-day EMAs than the S&P 500 show more internal strength than the benchmark. Keep in mind that stocks above the 200-day EMA are in long-term uptrends.
Energy, REITs, Tech, Industrials, Materials, and Utilities have more stocks in long-term uptrends than the S&P 500. Health Care, Communication Services, Finance, Consumer Discretionary, and Consumer Staples have fewer stocks above their 200-day EMAs than the S&P 500 (relative weakness).
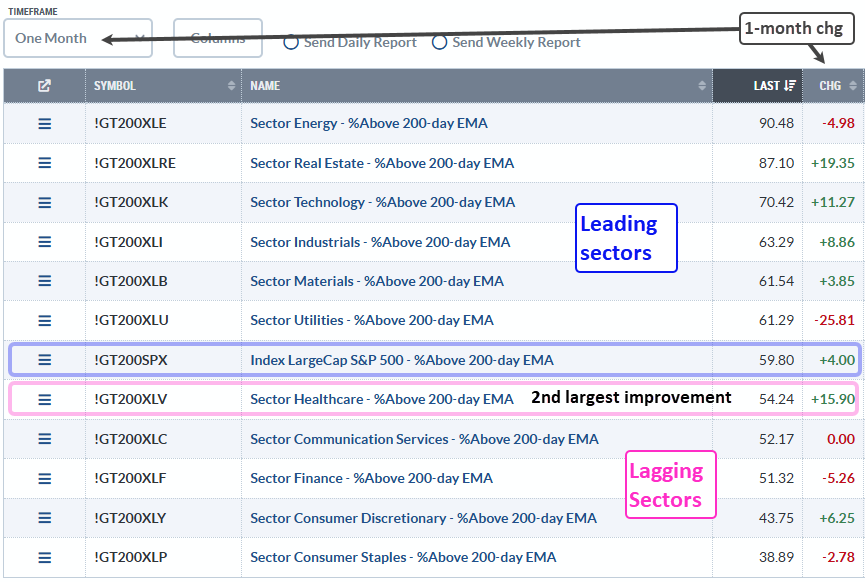
Even though Health Care is in the lower half, this sector caught my attention because XLV %Above 200-day EMA (!GT200XLV) improved over the past month. In fact, the 15.90-point improvement was the second best of the sectors. This means the percentage of XLV stocks above their 200-day EMA improved from 38.34% to 54.24% (+15.90). Healthcare stocks are making a move.
Percentage of Healthcare Stocks above 50-day EMA Surges
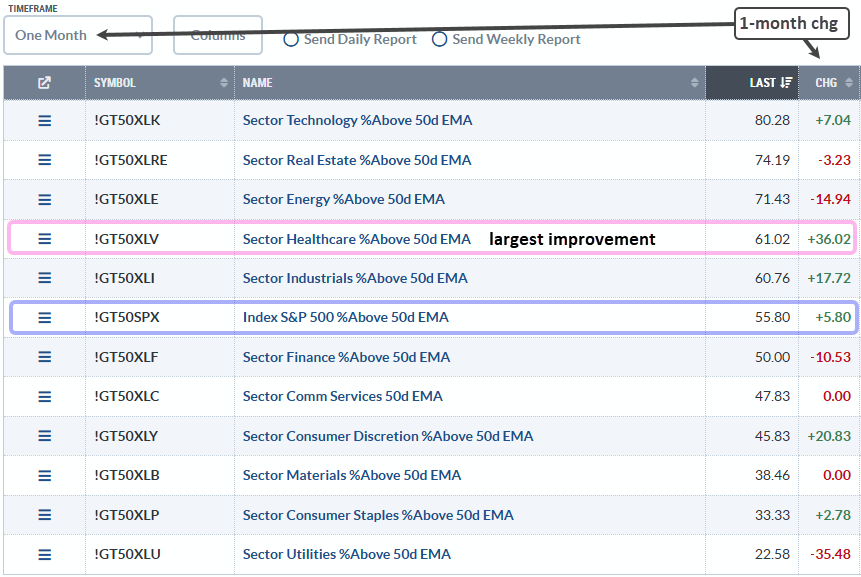
The next table shows the percentage of stocks above the 50-day EMA for the 11 sectors and the S&P 500. In contrast to the 200-day EMA, this is a medium-term moving average. Healthcare is showing relative strength because it has more stocks above their 50-day EMA than the S&P 500 (61.02% vs 55.80%). In addition, this number more than doubled over the past month as it moved from 25% to 61.02% (+36.02). This is a participation thrust that shows money moving into healthcare stocks as more break above their 50-day EMAs.
Recent Reports and Videos on TrendInvestorPro
- Gold Gets Interesting as Copper Miners Break Out
- Consolidation Setups in Industrials, Finance and Comm Services
- Stock Setups in Energy, Industrials and Utilities
- A Split Market, but Pockets of Strength Prevail
Click here to take a trial and get immeidate access.
XLV Hits Key Retracement Zone; Reverses with Breakout
After a big move or within an uptrend, chartists can use retracement zones to identify areas of support during corrections. XLV surged some 25% from August to early January and then corrected hard in March with a decline from 160 to 144. Where were the key retracements?
The blue shading on the chart below marks a retracement zone using the 50 and 61.8% retracements. According to Elliott Wave, corrections typically retrace between 38.2% and 61.8%, which are based on Fibonacci numbers. According to Charles Dow, corrections within uptrends typically retrace one to two thirds of the prior advance, with 50% as the base case.
The 25% advance represents two steps forward, while the decline back to the 142–144 area is one step backward (~50% retracement). Once prices hit this 50% zone, chartists should watch for signs of firming and a reversal.
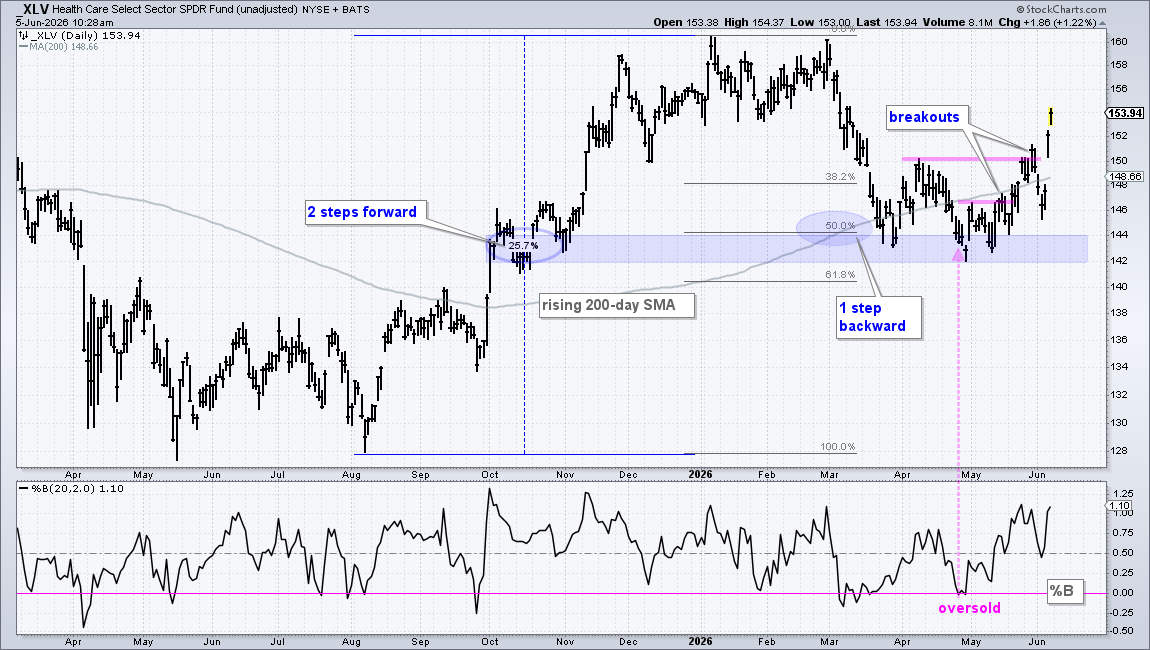
In addition to the retracement levels, notice that XLV was also battling the rising 200-day SMA from late March to early June. The rising 200-day can act as a support cushion during a correction. Also note that %B became oversold in late April as XLV tested the Bullish Setup Zone (pink arrow line). A %B dip below zero means the close was below the lower Bollinger Bands (20,2). This is a short-term oversold condition that can lead to a bounce.
XLV established support in the 142–144 area from late March to mid May. This was the basing process, and the time to watch for a breakout. TrendInvestorPro identified the oversold setup on April 28th and the breakout-surge on May 26th. After a dip to 146, XLV renewed this breakout with a surge to 152 on Thursday. These breakouts signal an end to the corrective period and a resumption of the uptrend. A close below 142 would call for a re-evaluation.