The Stock Market Still Looks Bullish, But These Economic Charts Deserve Attention

Key Takeaways
- The broader market trend remains bullish despite Thursday's selloff, with major indexes still showing strength.
- Consumer sentiment is softening, although it's not reflected in the charts.
- Friday's jobs report could be a key catalyst if the data confirms or challenges the market's risk-on mood.
Despite Thursday’s selloff, investors still appear to be in risk-on mode.
The trading session started with equities pushing higher as the S&P 500 and Nasdaq Composite hit all-time highs. But things shifted as the day progressed. Oil prices bounced off their lows, stocks moved lower, and the major indexes closed in negative territory.
But one day doesn’t change the stock market’s price structure. The trend remains bullish for stocks, especially in the Nasdaq, where Bullish Percent Indexes are favoring the bulls. The Dow Industrials and Transports are also holding up well, while the S&P 500 remains neutral.
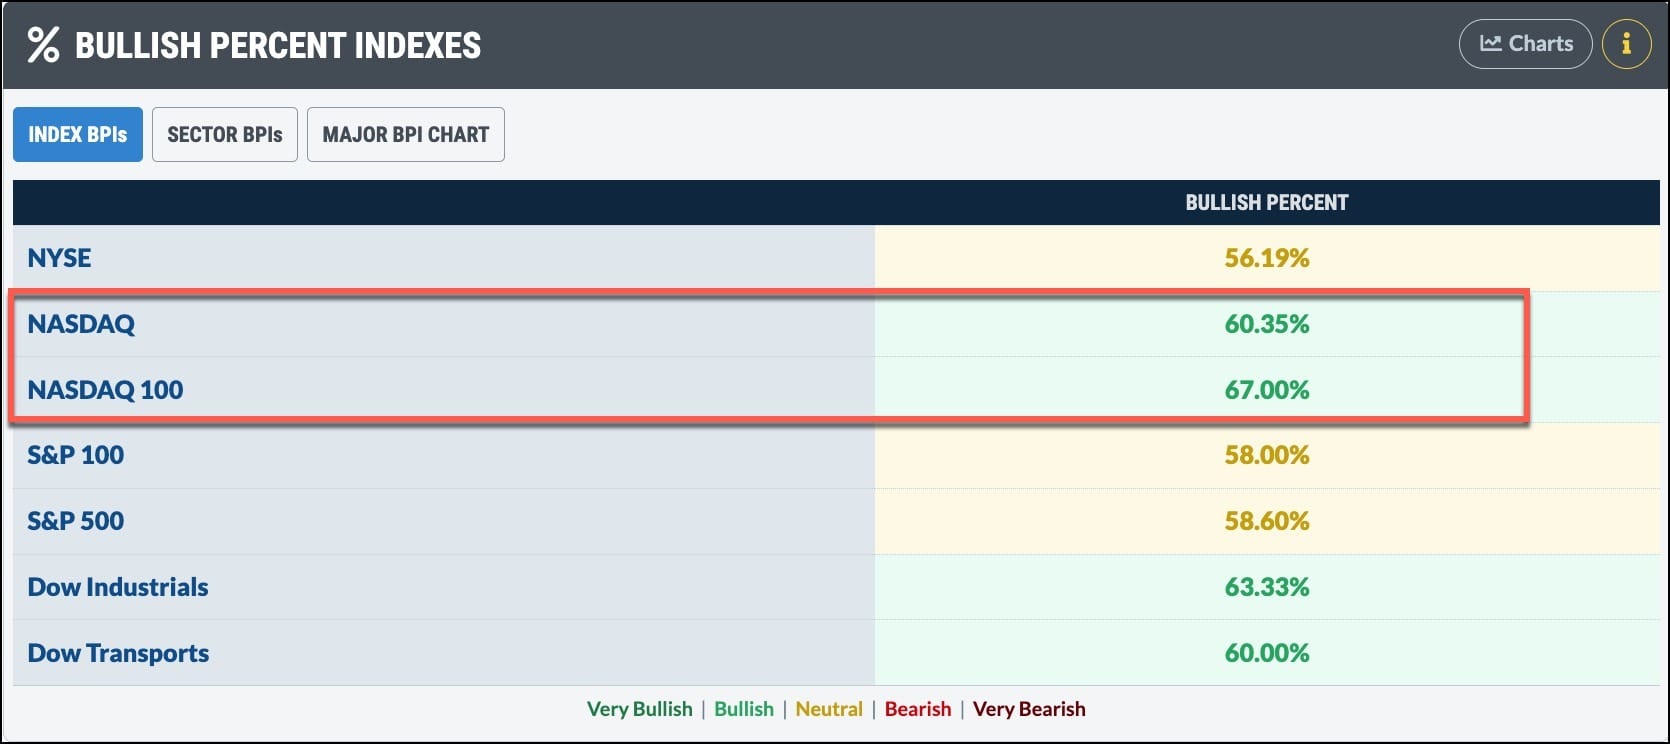
Looking through the Market Summary page, advancers are outpacing decliners, offensive sectors are outperforming defensive ones, and investment sentiment is much more bullish than it was in March.
Early Warning Signs
While earnings have been strong, we are starting to see some early signs that rising oil prices may be weighing on consumers.
McDonald’s (MCD) and Whirlpool (WHR) both reported earnings and revenues that beat analyst expectations. However, their guidance pointed to some softening in consumer sentiment.
We’re not seeing signs of weakening consumer sentiment in the charts. But with the April nonfarm payrolls report due Friday, it’s worth watching the health of the labor market. This will influence consumer spending, which, in turn, is a key force behind the economy. So even if stocks continue their bullish run, I’ll be keeping a close eye on the following economic indicator charts.
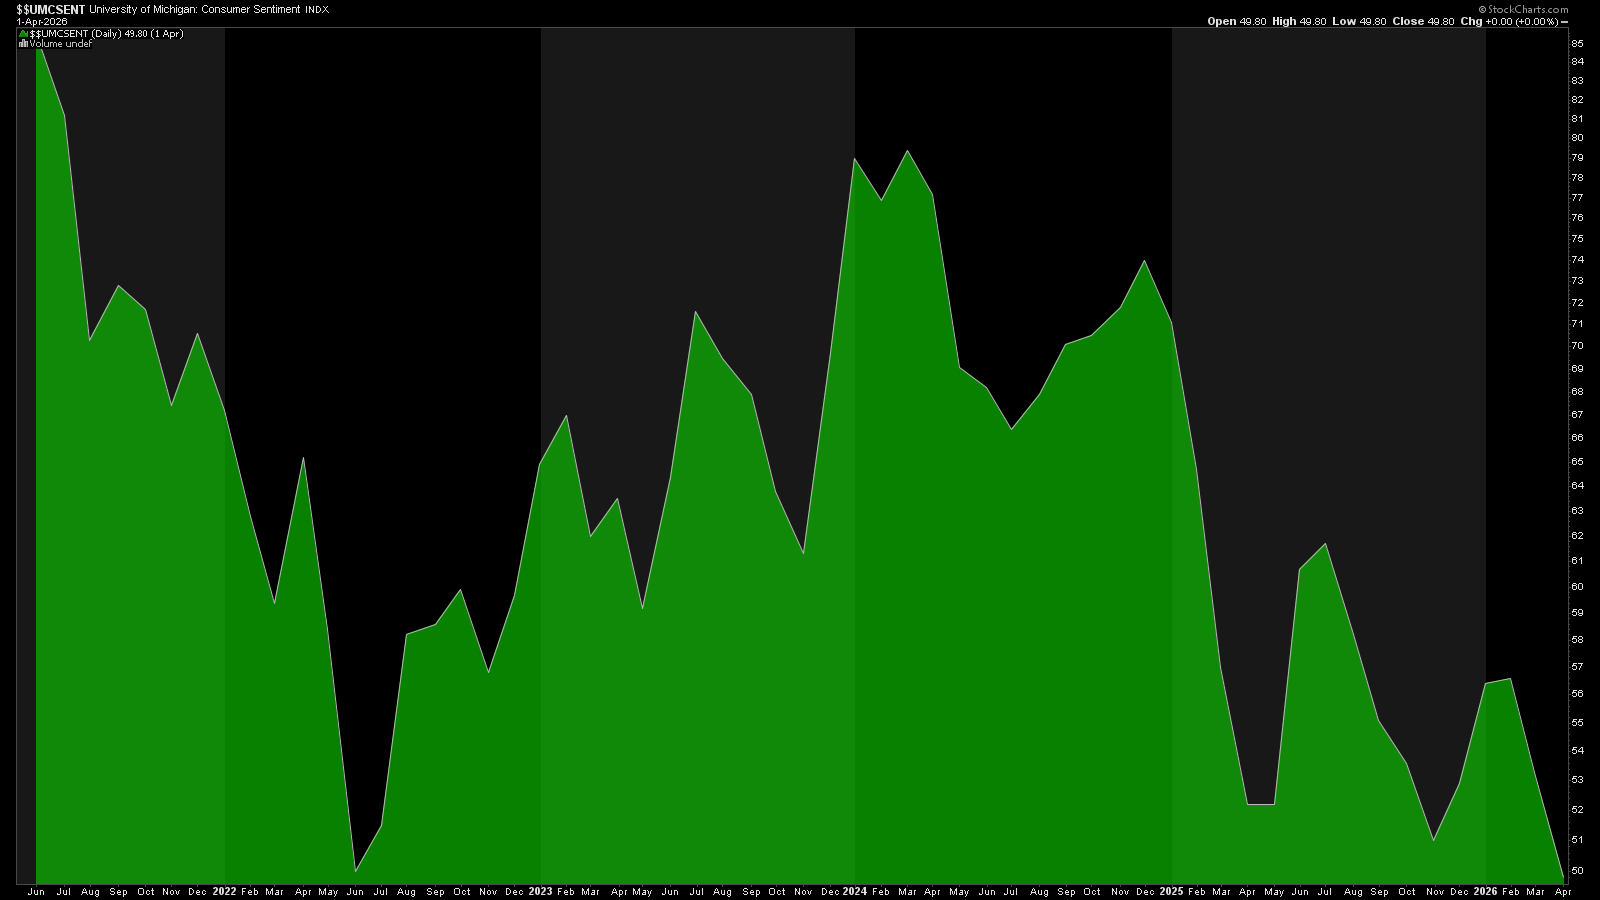
Consumer Sentiment
The University of Michigan Consumer Sentiment Index ($$UMCSENT) measures U.S. consumer confidence, which can influence consumer spending behavior, investment decisions, and economic momentum.
The three-year chart below shows that consumer sentiment declined in April, pressured by the Iran-U.S conflict and rising oil prices.
The Business Cycle
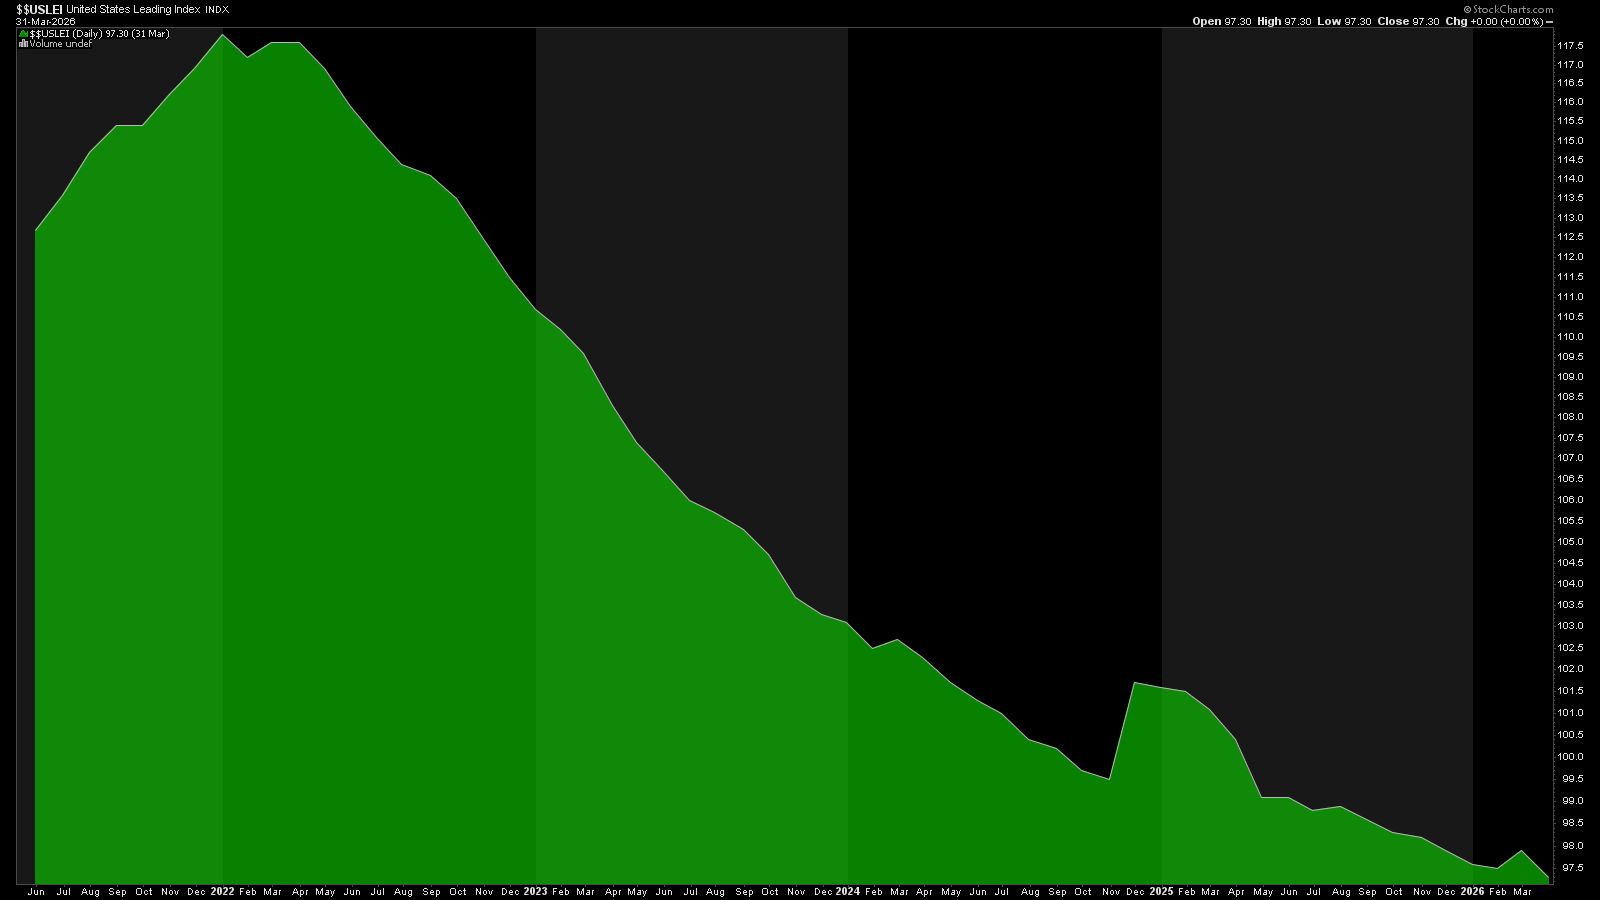
The United States Leading Index ($$USLEI) tracks several key economic components, including weekly hours in manufacturing, jobless claims, manufacturers’ new orders, building permits, and stock prices. It’s designed to signal peaks and troughs in the business cycle and can act as a leading indicator of economic turning points.
In the five-year chart below, the US LEI fell in March, suggesting that certain components could be slowing down economic growth. There were short-term reversals in October 2024 and a slight uptick in February 2026, but the overall trend has been lower since 2022. Even so, the US economy continues to grow, and the stock market remains bullish.
AAII Survey
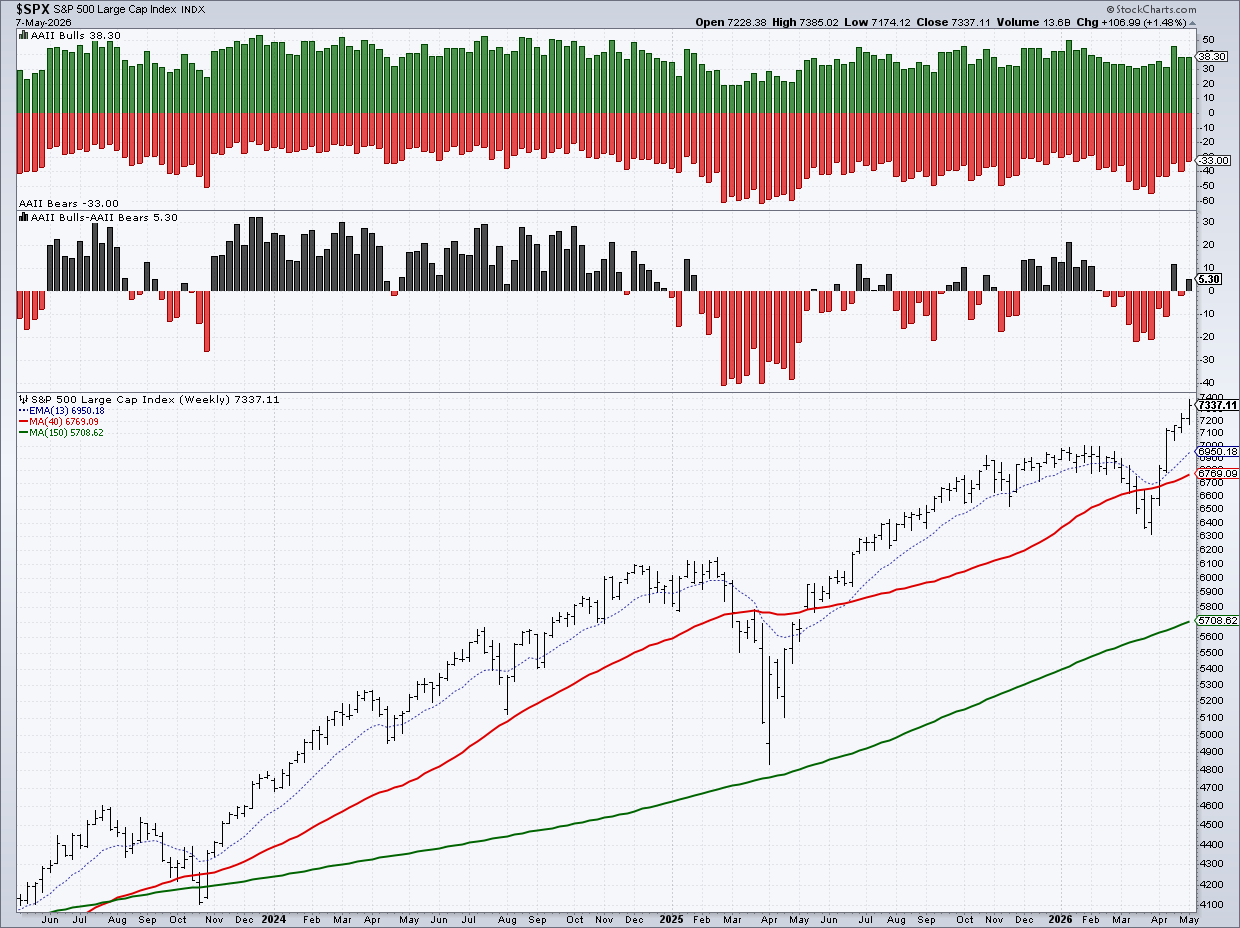
The Sentiment panel in the Market Summary page includes a chart of the AAII Bulls-Bears. Bullish sentiment is slightly higher than bearish sentiment, which aligns with the S&P 500’s healthy run.
Investor Fear
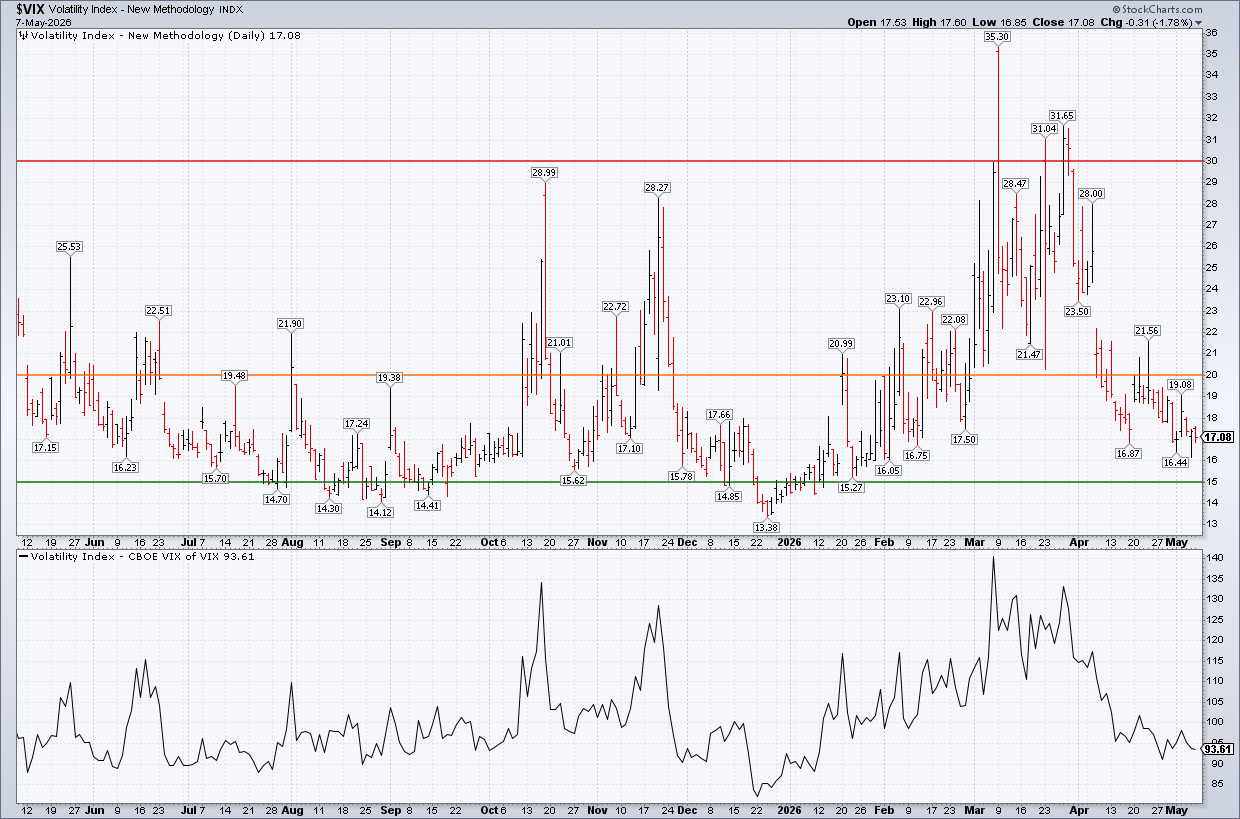
The Cboe Volatility Index ($VIX), also found in the Sentiment panel of the Market Summary page, is hovering around 17. This suggests investors are relatively complacent. The VIX of VIX, shown in the lower panel, is also at relatively low levels.
The Bottom Line
Overall, the stock market remains strong, supported by solid corporate earnings, increased capex, and rising GDP. At the same time, weakening consumer sentiment and softness in othe key economic indicators are worth monitoring.
Friday’s jobs report could be an important test. A weaker-than-expected number could trigger some selling. But if we get positive news from the Middle East, investors may look past a soft labor report.
If we get a strong jobs report and encouraging geopolitical news, the risk-on rally could be here for longer.
Disclaimer: This blog is for educational purposes only and should not be construed as financial advice. The ideas and strategies should never be used without first assessing your own personal and financial situation, or without consulting a financial professional.