Why a Little Year-End Pain Could Set Up a Big 2027 Rally

Key Takeaways
- The S&P 500 faces a critical technical test near its rising 200-day moving average, with 7000 emerging as the next major support level if selling intensifies.
- Elevated volatility, AI-related concerns, and deceiving market breadth have raised correction risk, but a VIX spike could help pave the way for a durable rally.
- A final fall in the 10-year yield might be the ultimate tell, and I've spotted where rates could find major support.
The post-midterm price action hasn't been what the bulls wanted.
Last Wednesday's relief rally was more than countered by Thursday's broadest-based selloff of the year. Friday's trade was a dead-cat bounce at best. Over the weekend, news broke that NVIDIA (NVDA) opened an investigation into CEO Jensen Huang's relationship with a suspected Chinese spy; its shares plunged nearly 5% amid a sea of S&P 500 green to kick off inflation week.
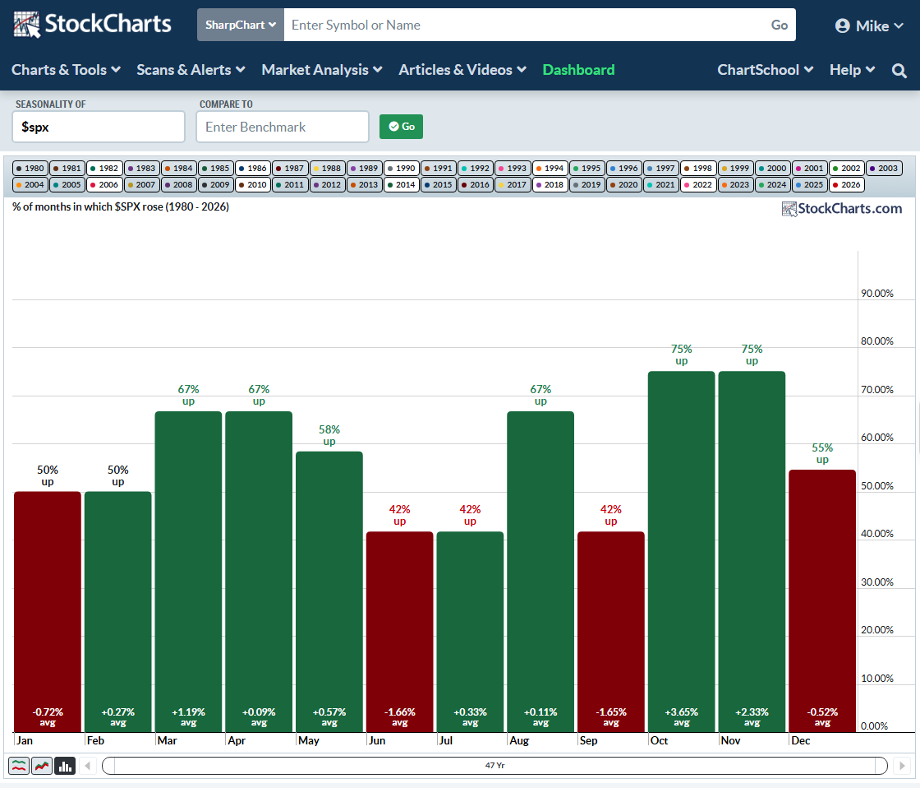
Elevated volatility and macro uncertainty rekindle 2018 memories. That was also a midterm year, and one that featured a steep S&P 500 ($SPX) decline into Christmas Eve. It might be now or never for the bulls, as the SPX tends to struggle in December of midterm years before sanguine trends take hold early in the pre-election year.
For now, traders will get a dose of Fed speak and October inflation data to mull over. Like last week's firm jobs report, though, even surprising economic updates could fall by the wayside in terms of market catalysts. The AI trade is on thinner ice following the elections, with the NVIDIA news adding yet another potential peril.
Let's first take stock of where the S&P 500 stands ahead of CPI and PPI this week, then NVIDIA earnings next week (and who knows when Anthropic (ANT) will come to market).
S&P 500: Where to Find Support, and How Far It Could Drop
Last Thursday's drubbing, which was the worst since March 2020 in some market corners, came after a months-long consolidation with a minor new high notched in early October. The SPX plunged from its now-falling 50-day moving average to within earshot of the rising 200-DMA. This range, from 7240 to 7310 (with the 200-DMA near 7325), appears to be a solid support confluence.
The problem for the bulls is that the August through early November range has the look of bearish distribution. I make that assertion based on the RSI momentum oscillator's series of lower highs as the tepid rally progressed, along with breadth's trend from Q3 into Q4. Even casual market watchers know that equities have flip-flopped from bullish AI in one stretch to bullish cyclicals and defensives in another.
That can only last so long, since areas like Consumer Staples and Health Care can only become so richly valued. Eventually, growth has to regain some leadership, along with the cyclicals. After all, it's probably too much to ask Procter & Gamble (PG) to reach and sustain a 30x P/E multiple.
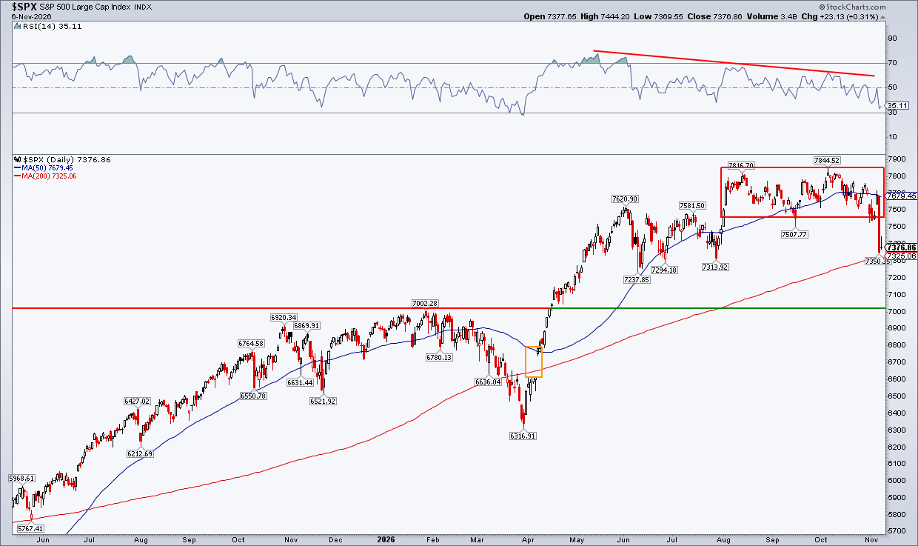
So, for the S&P 500, the aforementioned zone is key. Below it, the pre-war high and psychologically important 7000 spot would be the next stop (also the 61.8% Fibonacci retracement of the April 2025 to August 2026 rally). Such a dip would be almost precisely a 10% correction, too, potentially laying the groundwork for a jolly Santa Claus Rally period and a pre-election-year bull run.
I hate to dust off this old stat, but the median S&P 500 midterm year decline since 1950 is 16%. Under a very dour outcome, that April 8 gap near 6600, if filled, would be a 16% drawdown.
The VIX Offers Signal Amid So Much Macro and Political Noise
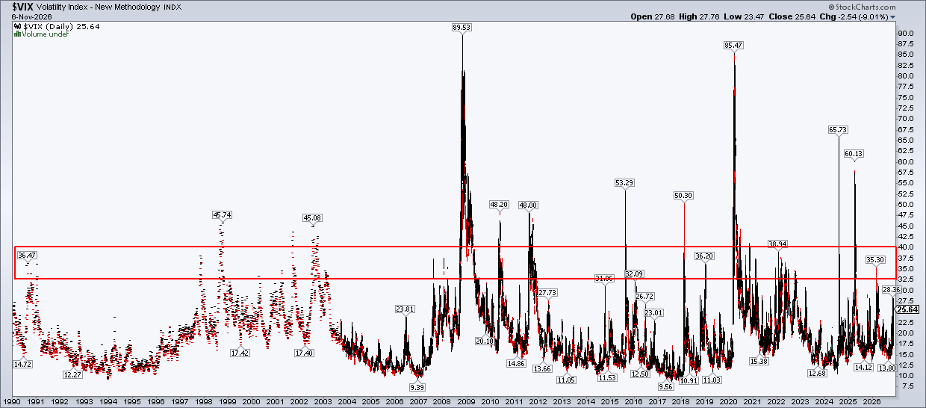
The Cboe Volatility Index ($VIX) may offer clues. Historically, when Wall Street's fear gauge hovers in the mid-20s, weak price action tends to ensue. The bulls would prefer a fast retreat into the teens or a sudden spike to 35+ to clear out the weak hands and set up a V-shaped equity response.
We don't have to go back far to find such an event. March 30's VIX jumped to 35.3, clearing the decks for what might have been an eventual blow-off summer top in some AI-related stocks.
Why We Want Higher Rates
Now, here's what might ruffle some feathers. The 10-year Treasury yield could be the ultimate tell. For a bullish reversal in stocks, a rate rise could be the catalyst. Notice in the chart below that amid the broadening trade in equities (and as the SPX has fallen), the benchmark yield has given back about half a percentage point.
I see long-term support down at 4.70%, which would be the spot from which TNX exploded to the upside in August and where the 38.2% Fibonacci retracement of the February-to-October climb comes into play. The 200-DMA will soon ascend to that spot, as well. Oil and energy prices would bear watching should a bearish price reversal in Treasuries commence.
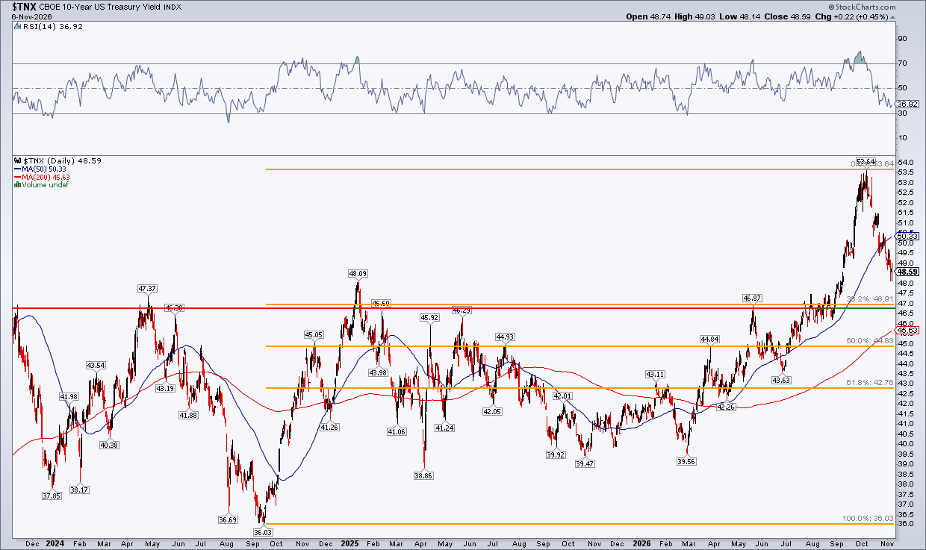
Now, if rates regain their footing, what does that mean for AI? Actually, probably bullish tidings. You see, AI drives yields, not the other way around. If there are healthy data center buildout trends and hefty demand for compute, the cost of capital naturally goes up. When fears mount in AI, a flight to safety in Treasuries ensues, along with a bid for defensive stocks. That's otherwise known as a growth scare and, at its worst, a bear market.
A fascinating trend since October 2022 is that stocks and bonds have been positively correlated day to day, but zoom out, and you see a negative relationship over weeks and months. Of course, during these periodic growth scares, equities get sold, and bonds go green.
The Bottom Line
All told, watch for that VIX spike and a 4.70% test on the 10-year. A little year-end violence may be required to set the stage for a 2027 rally.
Disclaimer: This blog is for educational purposes only and should not be construed as financial advice. The ideas and strategies should never be used without first assessing your own personal and financial situation, or without consulting a financial professional.