NVIDIA's Wild Ride: Is the Worst Finally Behind NVDA? Here's What the Chart Says.

Key Takeaways
- NVIDIA is approaching long-term support between $153 and $164, with Fibonacci levels reinforcing the zone.
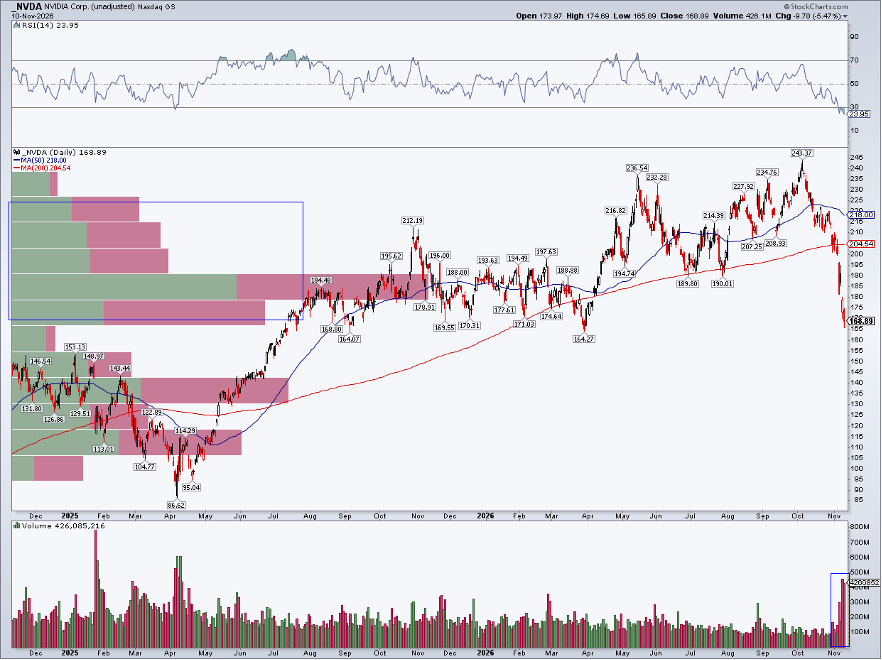
- Heavy selling volume & washed-out momentum are capitulation signs, but overhead supply between $180 and $220 poses challenges for a fast recovery.
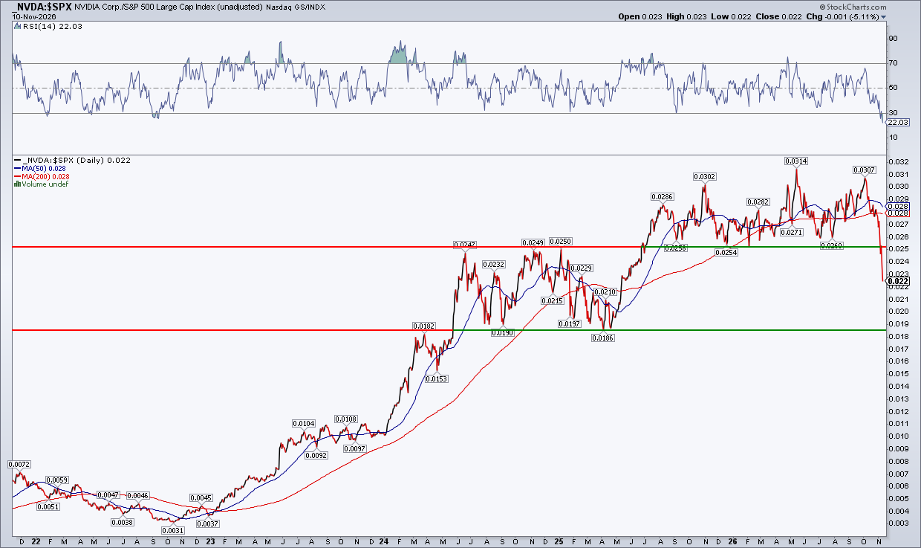
- The relative chart suggests more downside is possible ahead of the company’s Q3 earnings report next week.
NVIDIA (NVDA) snapped back on Veterans Day, rallying from an early-week low under $166 to near $180 with its Q3 earnings report coming closer into view (with a high 8.4% options-implied move priced in). Sanguine sentiment is spreading across the tech & AI spaces with CoreWeave (CRWV)'s Q3 report in hand.
Zooming out slightly, it would be wrong to call the NVDA decline a roller coaster. There have been few snapbacks along the ride from the all-time high near $244 tagged on October 6 to this week's local low.
$153–$164 Revisited
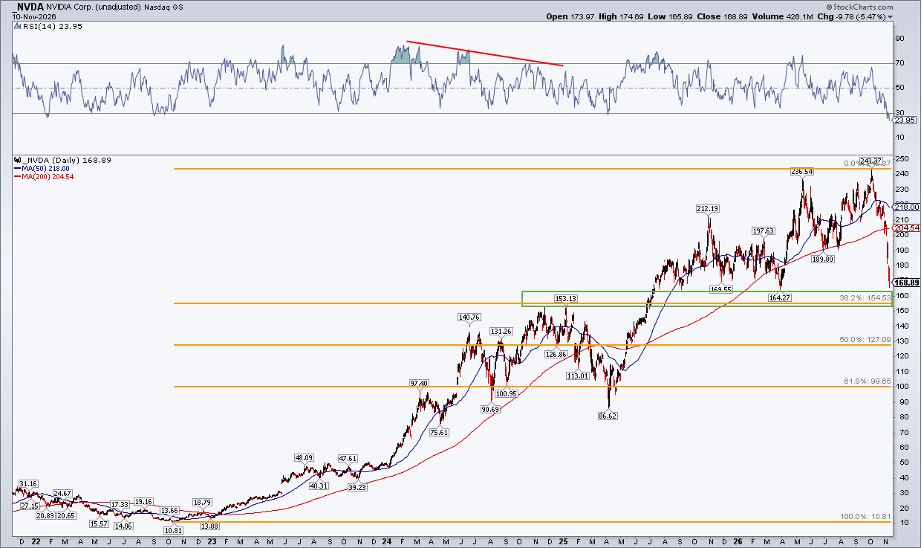
Pull back the time scale further and it's clear where long-term support comes into play. Notice in the chart below that $153 to $164 is the line in the sand. The bulls must defend it, and I assert that they will. That was where shares peaked in early 2025, before China's DeepSeek arrived and before the tariff tantrum that came with Liberation Day.
NVDA had already been losing significant momentum at the turn of that year, making the subsequent 43% drawdown gut-wrenching for the longs (but not unexpected). Further back, recall that NVDA plunged 69% during the 2022 bear market.
A Bullish Long-Term Story Riddled with Pockets of Fear
To that point, NVDA has been the poster child of the bull market, soaring from $10.81 a month before ChatGPT launched to the October 2026 record high. The 24-bagger return has not come without a bout of volatility and outright fear, though.
Technically, the current pullback has Fibonacci retracement support based on its 49-month rally, too. The 38.2% spot is $154–$155, obviously very close to the previously mentioned $153 polarity mark. Additionally, the stock fell to $164 this past March, offering further evidence that buyers should appear in this zone.
Momentum Fear Reaches a Multi-Year Extreme
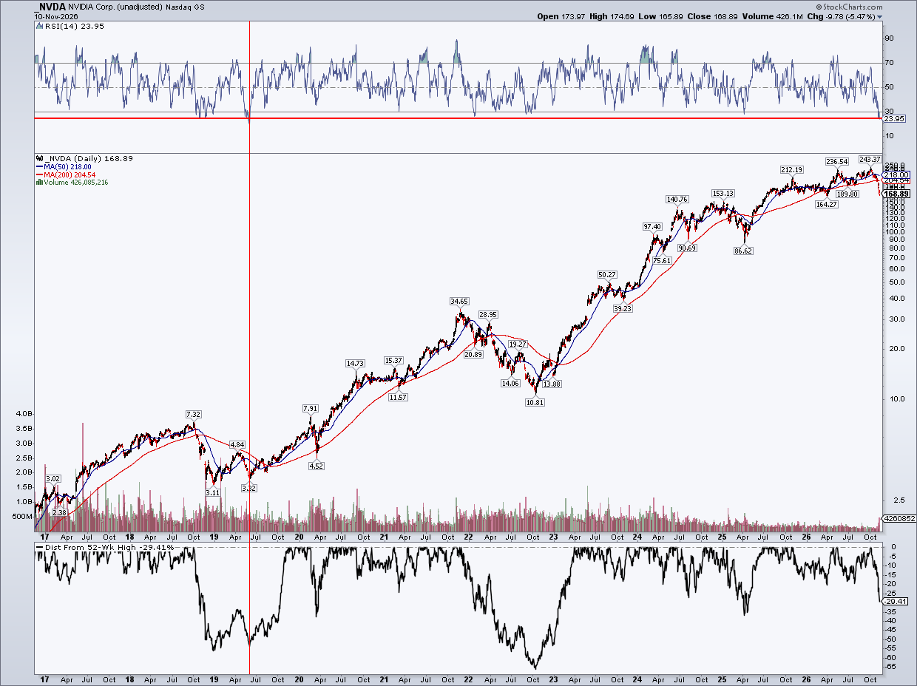
Let's take another view. The log-scale SharpChart below looks back 10 years. I've plotted the RSI momentum oscillator at the top and the distance from highs gauge at the bottom. Two things stand out.
First, the RSI hit its lowest level since May 2019, back when NVIDIA was a mere 'large' cap; for perspective, it was smaller than Nike (NKE) at the time. Readers know that I prefer to annotate SharpCharts using horizontal and vertical lines to capture precise historically significant dates and percentages. Technical data confirm just how palpable fear is surrounding what was briefly, on Tuesday, the world's third-largest company by market cap.
Second, StockCharts' new distance from highs indicator illustrates the depths of past declines. This Q4 drawdown reached 30% at the week's low, but, by historical measure, that's not a dramatic fall. Sure, the speed of the drop is eye-popping, but NVDA routinely sheds 30%, 40%, or more when price action turns bearish.
Record Selling Volume Creates an Overhead Hurdle
There's also a signal from volume trends. Separating the volume pane from the price chart, the data show that selling has been more intense this week than perhaps at any other time in the stock's history. Consider that today's share price is much higher than it was, say, four years ago. So, upwards of half a billion shares traded is incredible.
Unfortunately for the bulls, there's now a high amount of volume-by-price from $180 to $220. That will make rally attempts challenging leading into and after the Q3 report next week. While it's likely that most weak hands have been shaken out, there remains heavy congestion and overhead supply above the current price.
The Gap Troika
It's important to mind those gaps on the upside. Last Friday's close, before news broke of CEO Jensen Huang's affair with an alleged Chinese spy, was $186.64. NVDA gapped down to $173.06. That's gap No. 1.
Gap No. 2 is between $196.07 and $200.13, which was the smaller close-to-open drop leading into the tech-led selloff on Thursday, November 5. There's even a third up at $213.66, carved out ahead of Halloween.
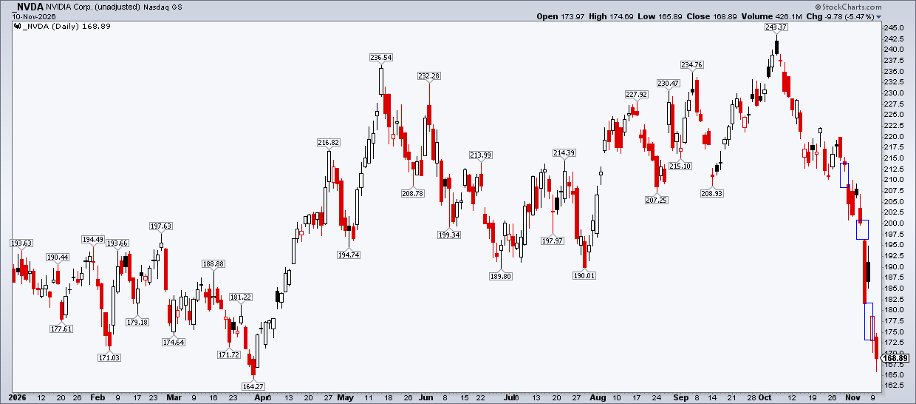
Gaps are like unfinished business on the chart, but it can take time for past price action to be resolved. What's more, technicians like to classify gaps as common, breakaway, runaway, and exhaustion. Unfortunately, it's difficult to determine their type in real time.
The bulls beg for a final exhaustion gap, but I don't see confirming signs that we've etched one yet. The November 9 gap had potential (NVDA closed well above the open on big volume), but the following session was outright bearish, with price closing below the open.
Relative Weakness is Another Warning
Finally, the relative chart offers further clues that NVDA's bearish affair might be closer to the end than the beginning. NVDA vs. the S&P 500 ($SPX) broke down through long-term support and polarity this week. The 0.025 ratio was resistance several times in 2024, then support on a handful of occasions in the past 18 months. Well, it's now resistance again.
NVDA returned to its 2Q24–2Q25 zone, with support from 0.018 to 0.019. Shareholders shouldn't be shocked by a further decline to that point. Of course, much hinges on what the S&P 500 does, along with NVDA. Still, that level is not very much lower, and it could be hit upon a classic post-midterm market rally, with NVDA relegated to the bench.
The Bottom Line
Volatility bulls have not been cheated this week since word of Jensen's affair broke. NVDA, as a result, broke down. Long-term support is in sight, with other technical clues pointing to limited downside but also significant challenges for the bulls on the way back up. With conference commitments on tap and earnings in the offing, more volatility is likely ahead.
Disclaimer: This blog is for educational purposes only and should not be construed as financial advice. The ideas and strategies should never be used without first assessing your own personal and financial situation, or without consulting a financial professional.