Week Ahead: After Nifty's Vertical Rally, Focus Shifts to Holding Recent Gains

The Indian equity market staged a spectacular rally during the week, ending with substantial gains as investors gave a resounding thumbs-up to the outcome of the U.S. midterm elections, in which Republicans suffer major setbacks. The Nifty witnessed an exceptionally strong directional move, opening the week on a firm footing and extending its gains as the week progressed, with the index trading in a remarkably wide range of 1,823.30 points. The sharp rise in equities was accompanied by an equally sharp increase in volatility as India VIX surged 14.18% to 17.47. The headline index ended the week with a massive gain of 1,977.25 points (+8.58%).
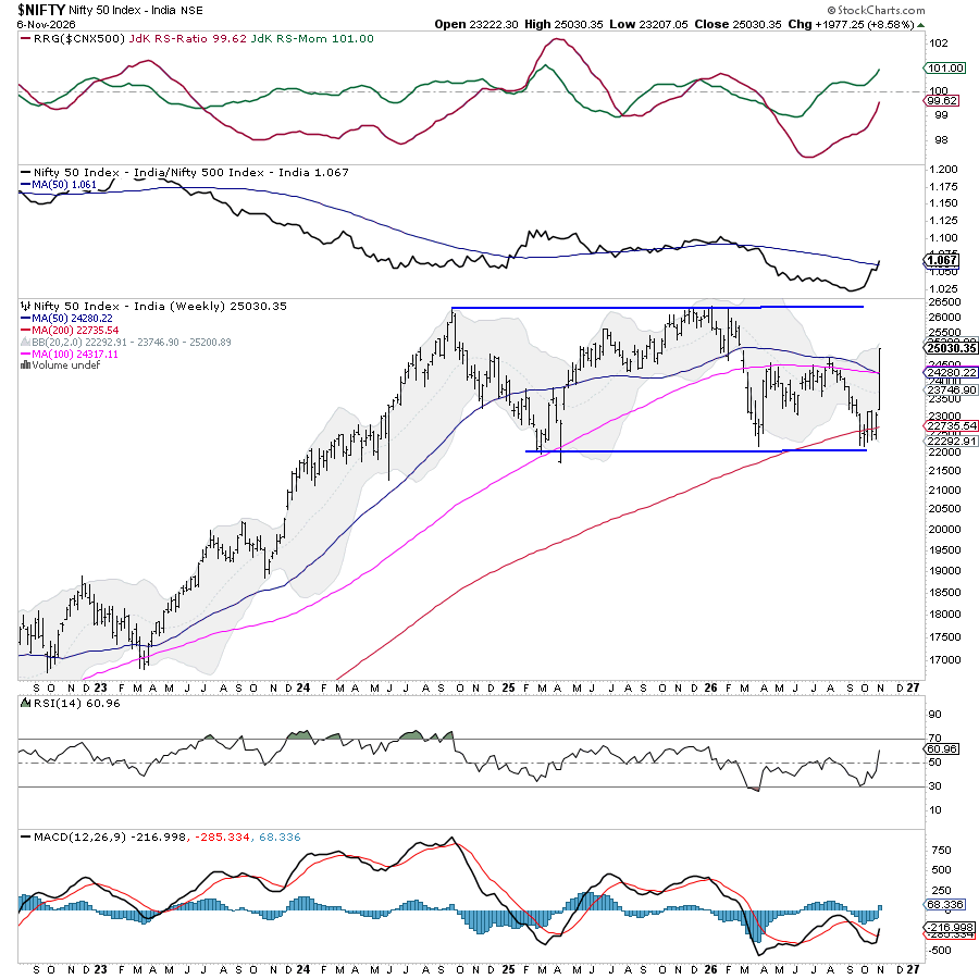
The market has witnessed a significant improvement in its technical structure in the aftermath of the sharp rebound from the important long-term support zone near 22,700–22,800. The Nifty has reclaimed its 50-week and 100-week moving averages, currently placed at 24,280 and 24,317, respectively, and has closed near the upper Bollinger Band. However, the sheer magnitude and velocity of the recent advance have left the index somewhat overextended in the immediate term. While the strong upward thrust has materially improved the near-term outlook, the Nifty is now approaching a broader resistance zone around 25,000–25,200. A sustained move above this area would be required to extend the rally towards the previous major highs. However, some consolidation or a measured retracement can be expected. Such a consolidation is healthy and desirable to absorb the recent gains and prevent the advance from becoming technically unsustainable.
The coming week is likely to see a stable start, with the customary one-hour Muhurat trading session scheduled for Sunday, November 8. The trading holiday on Tuesday, November 10, will make this a truncated week. Given the sharp rise already witnessed, some profit-taking and consolidation at higher levels cannot be ruled out. The levels of 25,050 and 25,300 are likely to act as immediate resistance points. Supports are expected to come in at 24,730 and 24,500.
The weekly Relative Strength Index (RSI) stands at 60.96. It has marked a fresh 14-period high, but remains neutral and doesn't show any divergence against the price. The weekly Moving Average Convergence/Divergence (MACD) has shown a positive crossover and is holding above its signal line. On the candlestick charts, the Nifty has formed a large bullish candle with a strong real body, reflecting aggressive buying interest throughout the week.
From a pattern-analysis perspective, the Nifty has staged a powerful rebound from a crucial confluence of supports comprising the rising long-term trendline and the 200-week moving average, currently placed near 22,736. The recovery has pushed the index back above the closely placed 50-week and 100-week moving averages, reversing the immediate bearish pressure that developed during the preceding decline.
For the coming week, market participants would be better served by adopting a measured and selective approach rather than aggressively chasing the rally. Existing profitable positions may be protected through appropriately trailed stop-losses, while fresh purchases should preferably be considered during consolidation or modest retracements rather than during sharp upward extensions. With volatility remaining elevated and the trading week shortened, position sizing and risk management will assume greater importance throughout the coming week.
Sector Analysis for the Coming Week
In our look at Relative Rotation Graphs®, we compared various sectors against the CNX500 (NIFTY 500 Index), representing over 95% of the free-float market cap of all the listed stocks.
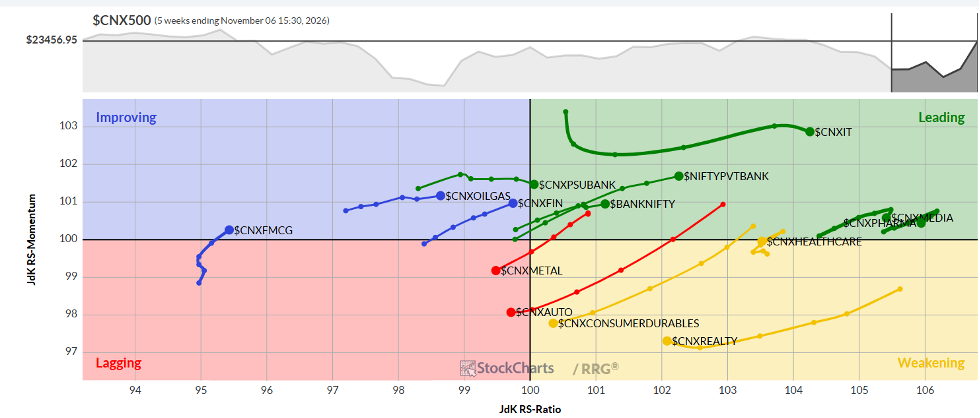
The Relative Rotation Graph (RRG) shows that the Nifty PSU Bank Index has rolled inside the leading quadrant. The BankNifty, Nifty Services Sector, Media, Pharma, and IT indices are also inside the leading quadrant. While Pharma and the Media Indices are showing some slowdown in their relative momentum, these Indices are likely to outperform the broader markets relatively.
The Nifty Realty Index is inside the weakening quadrant. However, it is showing some improvement in its relative momentum.
The Nifty MidCap 100 and Auto Indices have rolled inside the lagging quadrant. Along with the Metal Index, these groups may relatively underperform the Nifty 500 index. The Nifty Energy Index is also inside the lagging quadrant, but looks to be improving its relative momentum against the broader markets.
The FMCG Index has rolled into the improving quadrant. Besides this, the Financial Services Index, PSE, and the Infrastructure Indices are also inside the Improving quadrant of the RRG when benchmarked against the broader Nifty 500 Index.
Important Note: RRG™ charts show the relative strength and momentum of a group of stocks. In the above chart, they show relative performance against the NIFTY500 Index (Broader Markets) and should not be used directly as buy or sell signals.
Milan Vaishnav, CMT, MSTA
Consulting Technical Analyst
www.EquityResearch.asia | www.ChartWizard.ae