Microsoft Just Broke Out. Which Tech Stock Could Be Next?
You heard the news. The Strait of Hormuz may reopen within the next seven days. That headline sent oil prices lower and equity indexes higher on Friday, capping off another wild, headline-driven week.
Through all the noise, though, the technical structure of the S&P 500 ($SPX) and Nasdaq Composite ($COMPQ) remains bullish. Treasury yields remain elevated, which is something to watch, although there was an encouraging shift late Friday. Yields began to move lower, with the 5-year yield finishing the day down.
Does this mean we can expect an important headline over the weekend? Maybe, but, for now, there are some developments worth paying attention to.
This week’s update:
- Technology takes the lead, and Microsoft breaks out
- SharpCharts gets a high-definition upgrade
- A five-part course on finding potential breakout stocks
Tech takes the lead
Technology stocks are back in the spotlight, helped by several major headlines. Meta’s Muse generated plenty of attention, while President Xi’s U.S. visit added to further optimism surrounding AI-related stocks.
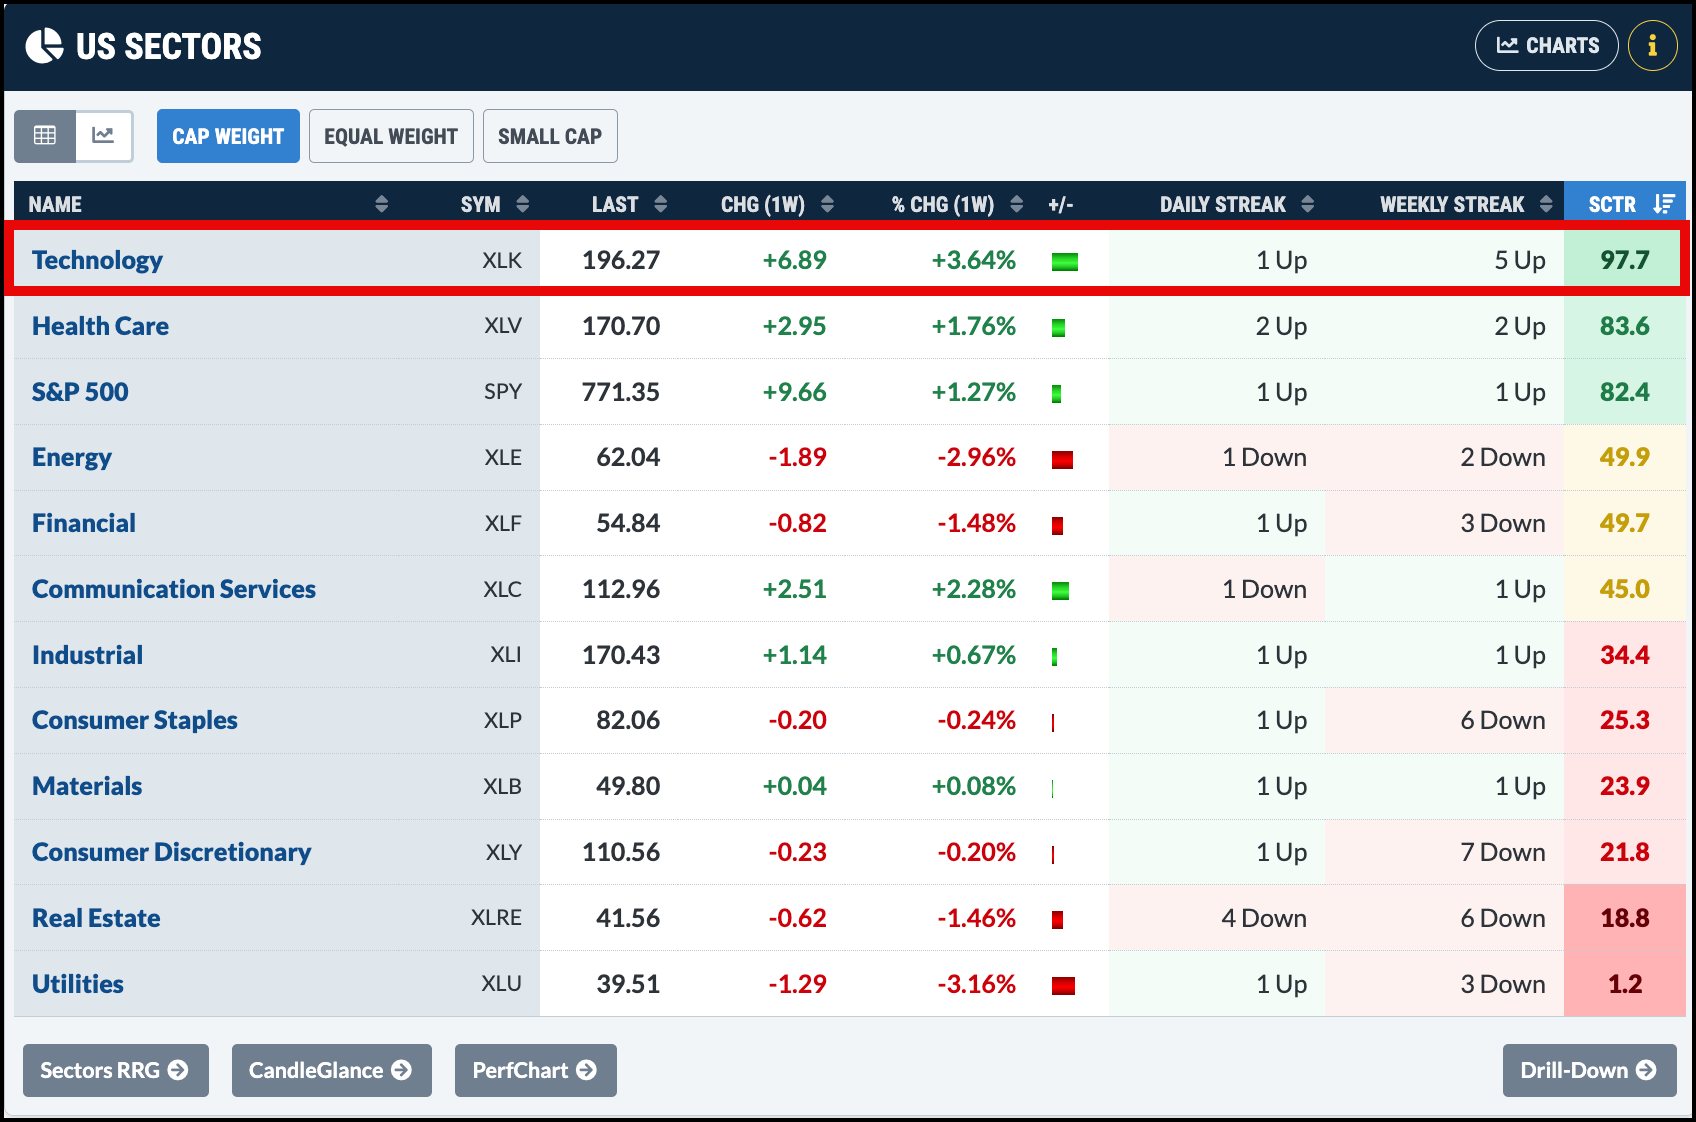
For the week, the Technology Select Sector SPDR Fund (XLK) has moved into the top spot among U.S. sectors and, with a StockCharts Technical Rank (SCTR) of 97.7, technology remains resilient.
Next week could bring even more action. Micron Technology (MU) reports earnings on Wednesday, and its results could provide the next catalyst for semiconductor stocks.
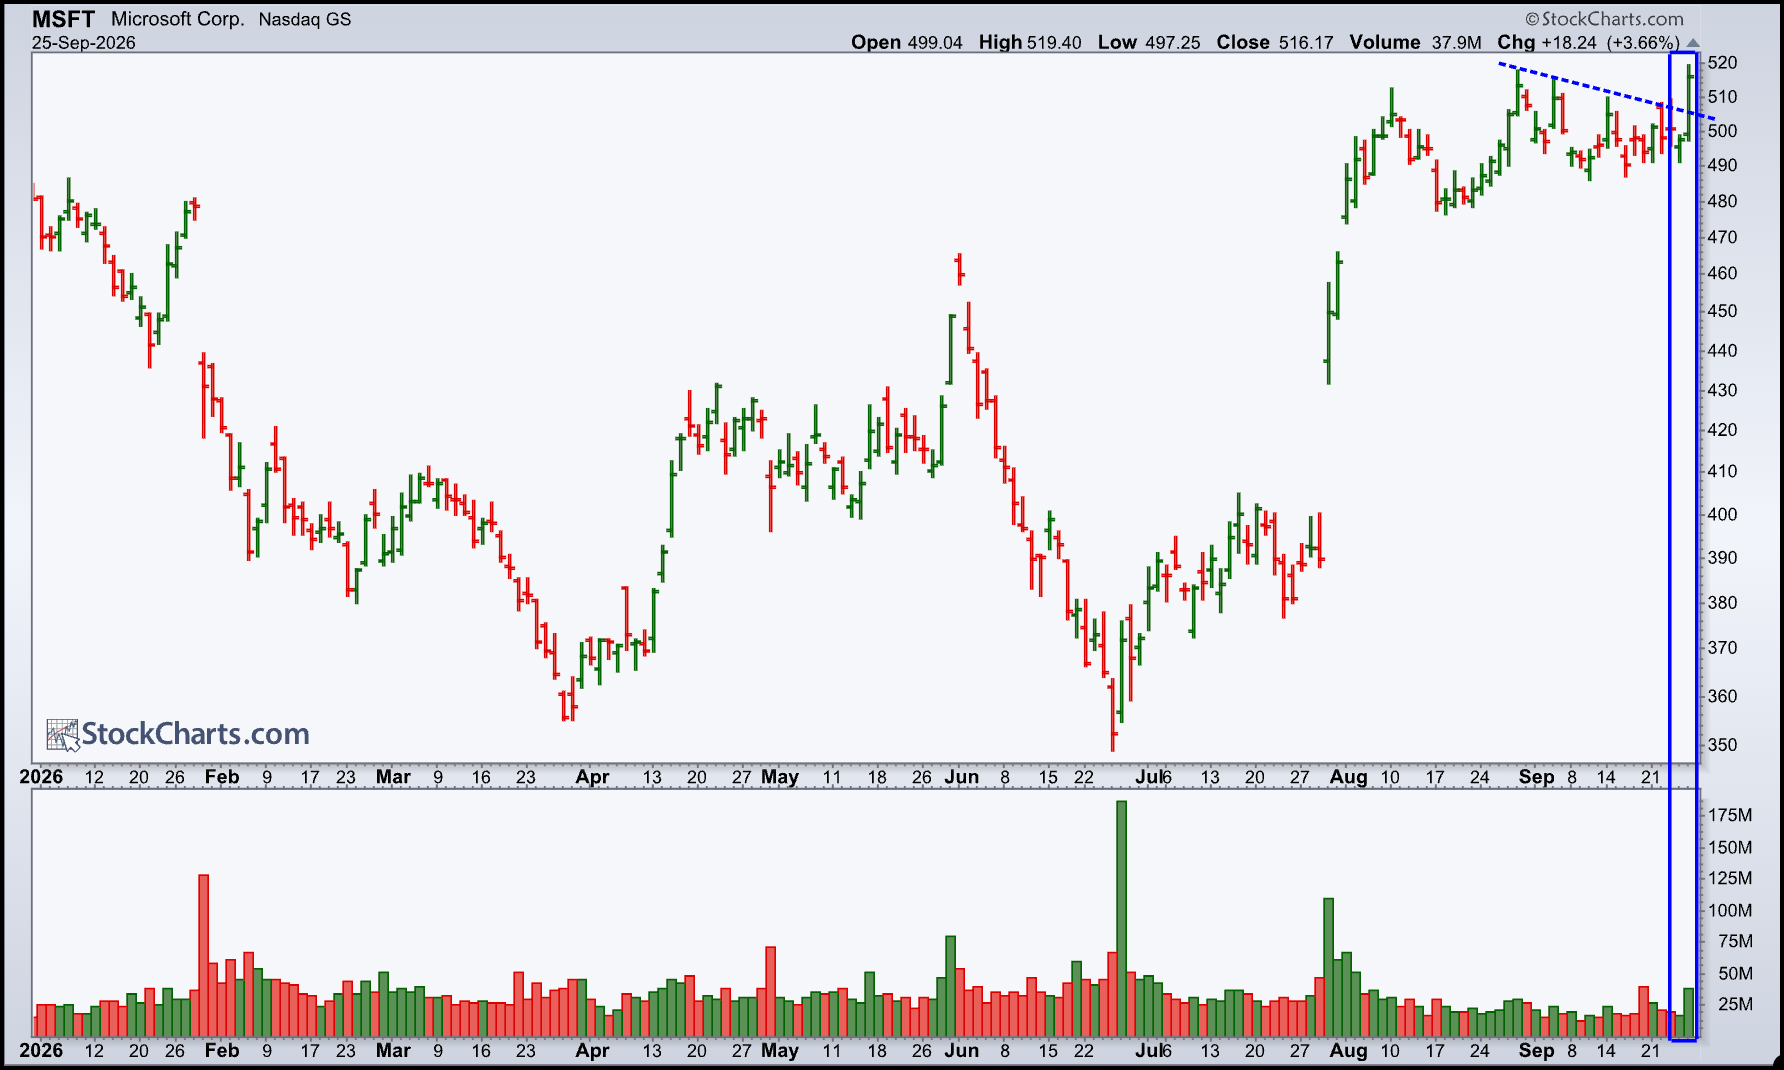
Will MU deliver the kind of breakout move we saw from Microsoft (MSFT) on Friday?
Did that chart look sharper?
Your eyes aren’t playing tricks on you. The MSFT chart above is crisper than usual. We’ve added a High-Definition Charts setting to SharpCharts, giving your charts a cleaner and sharper look.
Turning it on is easy. Click the gears icon in the upper-right corner of SharpCharts, enable “High Definition Charts,” and you’re ready to go.
It’s a small change, but, when you look at so many charts, it makes a difference.
And that brings us back to the MSFT chart.
Could you have spotted the breakout earlier?
In hindsight, the MSFT breakout is easy to spot. But were there clues before the move happened?
No one can know with 100% certainty what a stock will do next. But with a repeatable process, you can recognize the characteristics that often appear before strong moves.
Several signals can separate promising setups from the stock or ETF universe. That’s what Mary Ellen McGonagle teaches in her five-part course, “The Art of Spotting Winning Stocks.” She walks through the technique she uses to find stocks with the potential to outperform, giving you a practical process you can apply to your charts.
Learn more about the full course in the StockCharts Marketplace.
👉 Start spotting breakouts like a pro!
Have a wonderful weekend!