StockCharts Insider: My 10-Minute Morning Routine in the New ACP2
Before We Dive In…
Every morning, before the opening bell, the market floods you with information. Often, it's more information than you can possibly digest. Index moves, gainers and decliners, yields, oil, sector rotations, earnings, and so on. Without a routine, it’ll feel like you’re standing in the middle of a data stampede.
Rather than try to make sense of all that just by myself, I'd prefer to run a process, and I have a few for different situations. StockCharts’ ACP2 - Beta 1 just gave me a few new ideas to reorganize my approach, which I’m going to share with you.
My ACP2 routine has two simple parts: get a broad read on the market, then narrow it down to one stock. There’s nothing new here; everyone does this. But ACP2 hits differently when you run it through this process. I’ll show you what I mean.
A quick caveat: There are tons of features on ACP2 - Beta 1. I am not going to run through everything. This isn’t a “how to” post. What I’m going to show you instead is how I quickly use ACP2 to gauge what’s happening in the market, in order to find a few stocks to monitor.
Part 1 - Get a Broad Read on the Market
Take a look at the default chart settings.
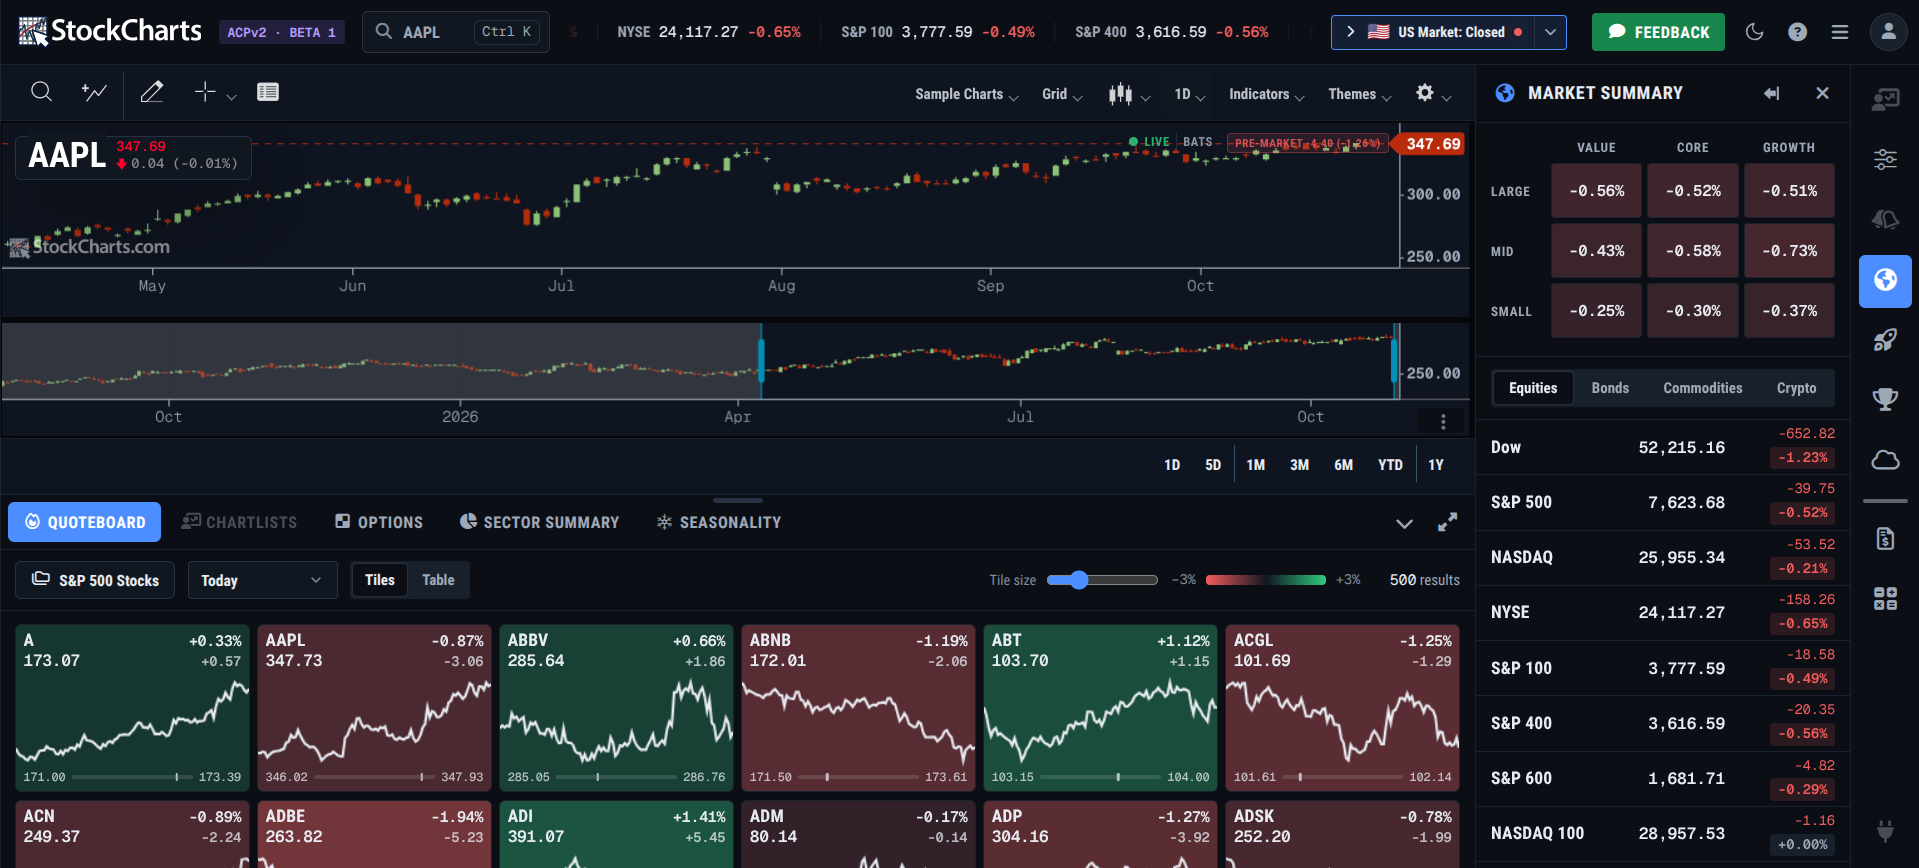
As I said, there’s a lot there and it’s easy to get lost at first. Here’s what I’d do:
Step 1 - Check the Market’s Temperature
See the scrolling ticker at the top? That’s my first read on the major indexes and also the $VIX. I compare that against last week’s close (all three indexes slipped).
Step 2 - Broad or Narrow?
Next, I expand the Market Summary in the right sidebar.
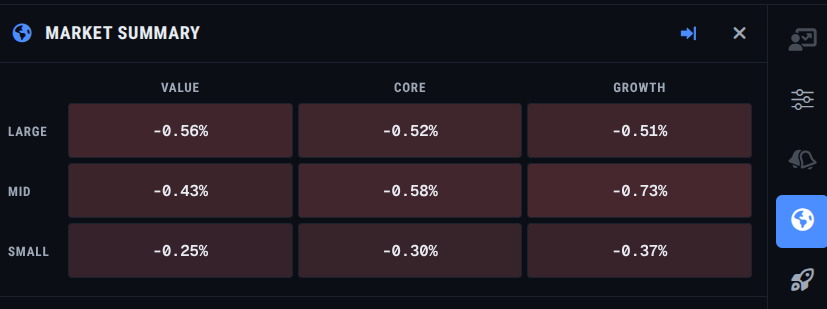
The market sold off on the last Friday at the time of writing. You can see the declines across all nine windows. That’s broad; a narrower move would see concentration in a few boxes rather than all nine. Interestingly, small caps held up the best. Mid-cap growth stocks were hit the hardest. Could it be that money isn’t leaving the market, but shuffling between different categories?
Step 3 - Check Yields and Crypto
Why bonds and crypto? The yields tell me about rate fears (at the time of writing, the 10-year had been hovering above 5% for some time) intensifying or easing. The crypto market tells me about speculative sentiment.
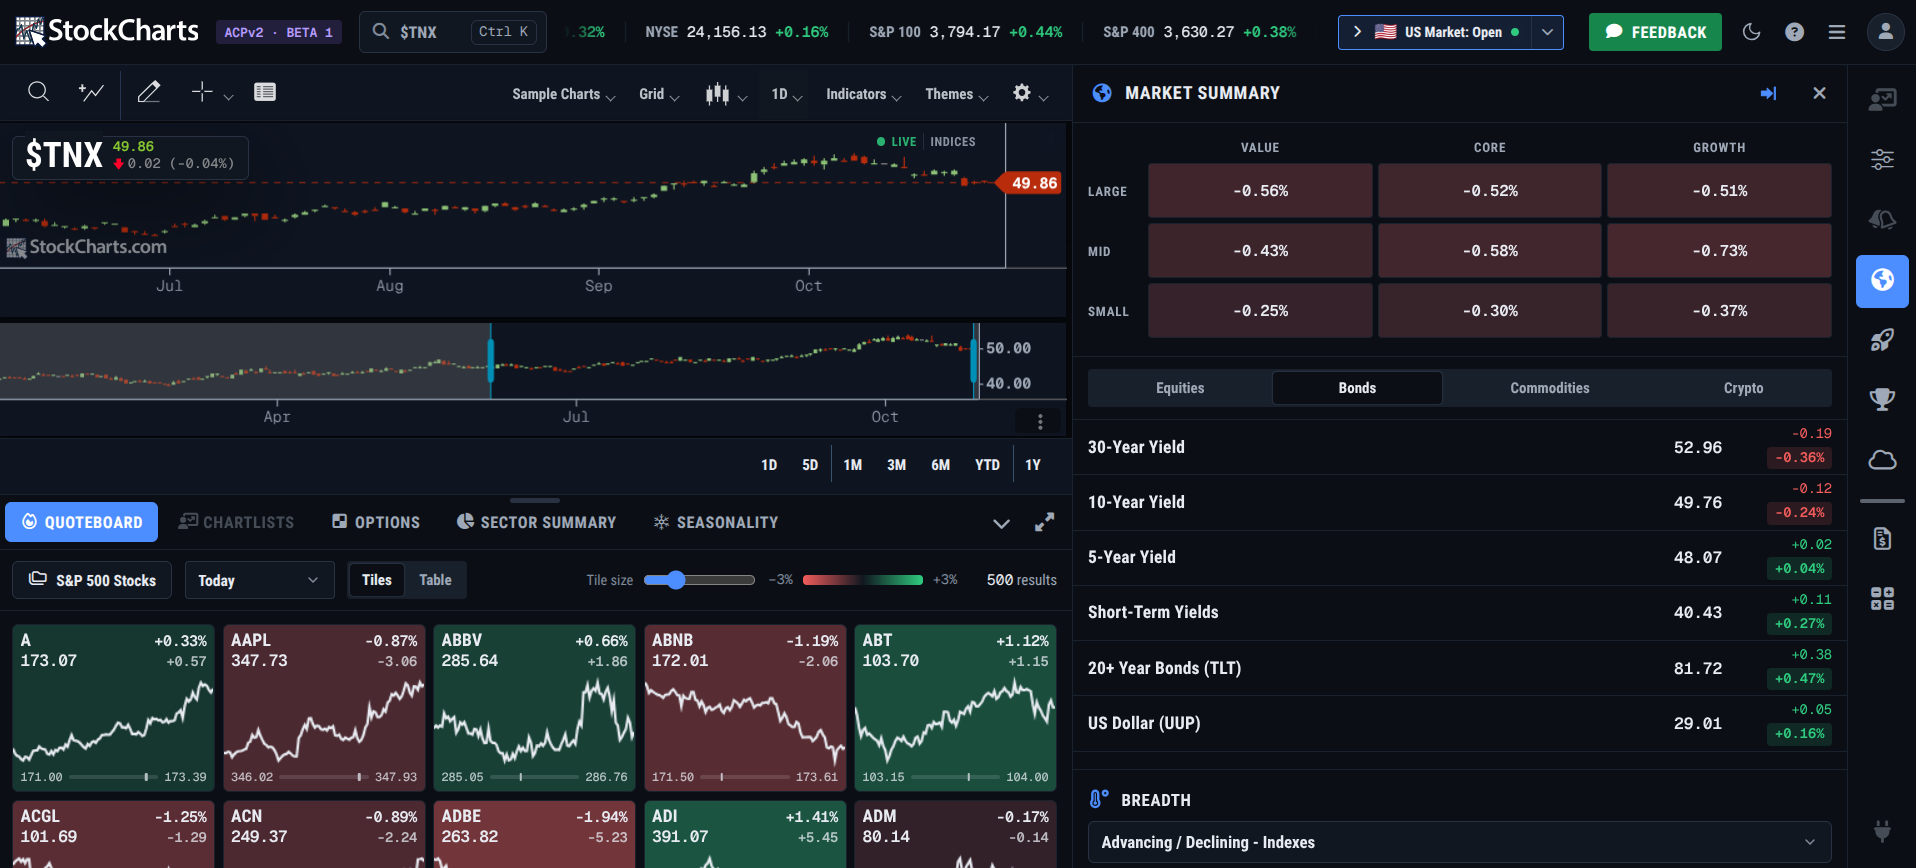
For example, I clicked on the 10-year slot to chart its proxy, $TNX. As you can see, the 10-year drifted from above 54.00 (read: 5.40%) to 49.88 (or 4.988%).
Step 4 - Get a Quick Read on Commodities
I like to check gold, silver, WTI crude, and Brent crude prices. Your list might look different, and that’s fine.
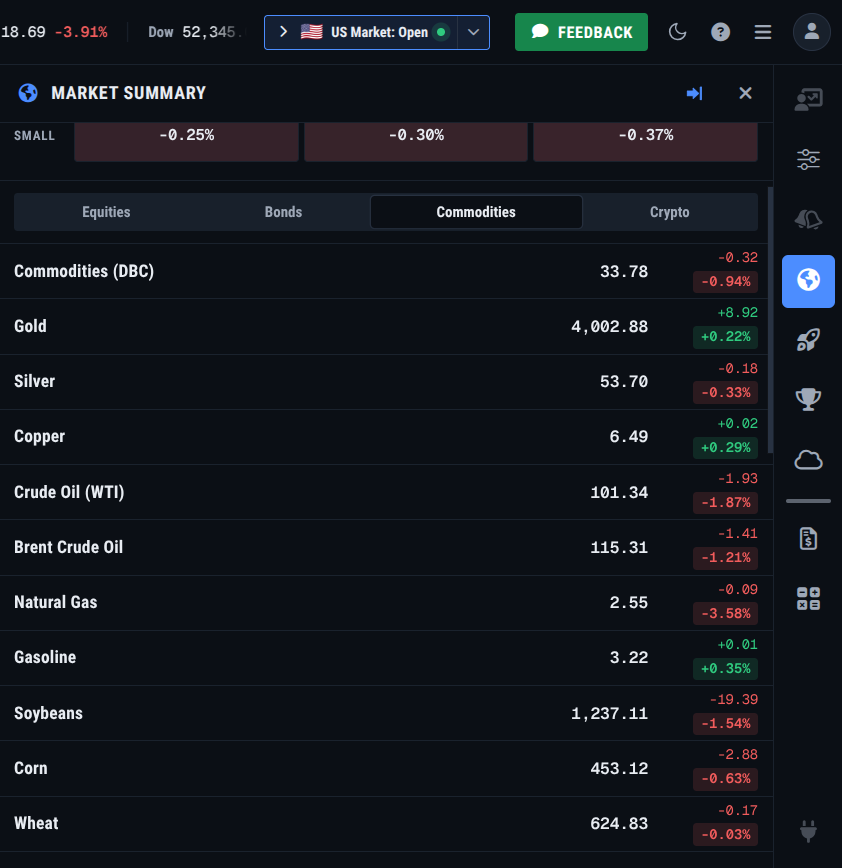
In a nutshell, oil is my inflation gauge, and gold and silver give me a read on monetary sentiment. Pretty simple.
Part 2 - Zoom In On Stocks
Now that I have a quick view of the market, I want to see if there are any interesting stocks out there making moves.
Step 5 - Find the Market Movers
The Market Movers tab is right there on the side. I just click it to glance at the Most Active, Gainers, and Decliners.
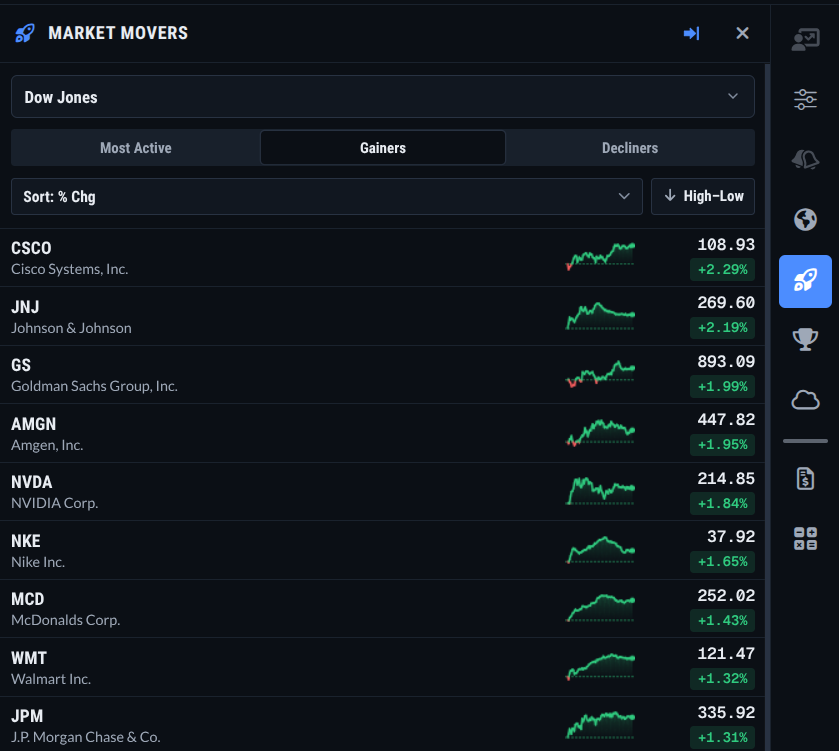
That’s an interesting picture. You have five different sectors in the top nine. You even have staples (WMT) and discretionary (MCD) in there as well. This gives me a few ideas, but, before I drill down, I want to check technical leaders.
Step 6 - Check the StockCharts Technical Rank (SCTR)
The interesting thing here is how different the list is from the Market Movers.
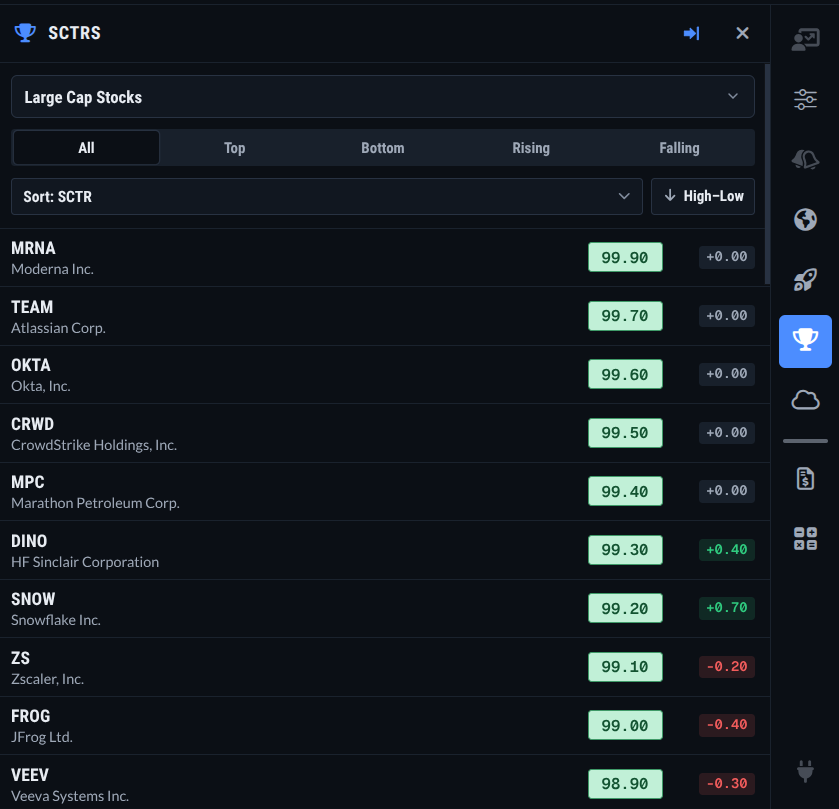
Obviously, there are plenty of stocks to vet. There are hardly any stocks showing up on both panels (I found a few by scrolling down). The bulk of the selection work is going to happen here.
So, suppose I were interested in Atlassian Corp. (TEAM), which is second from the top in the SCTR panel. I click on it to see its chart on the left-hand side. I can see that it’s making new highs.
Step 7 - Check the Symbol Summary
But is TEAM about to report earnings anytime soon, or did it just report? How’s its business doing overall? I used to have to go to the actual Symbol Summary page, but, in ACP2, there’s a panel for it.
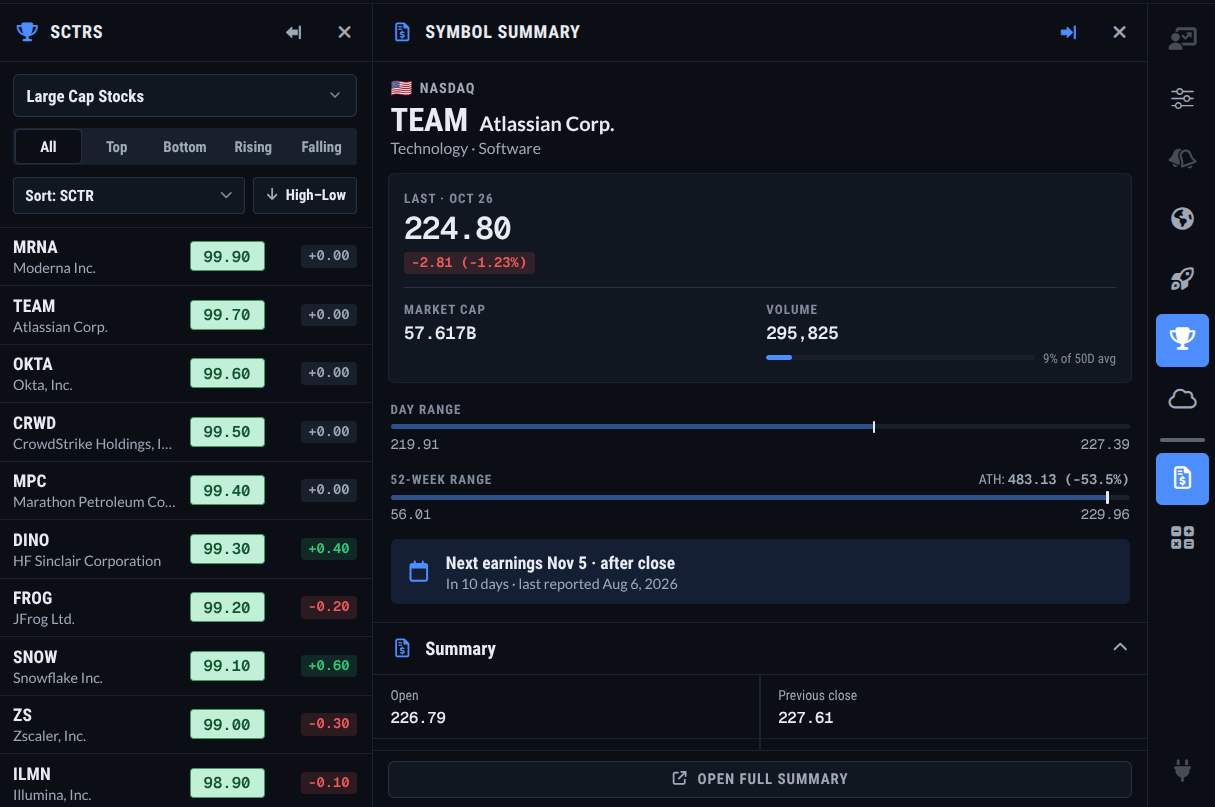
I’ll keep the SCTR panel open as well in case I want to click on other stocks. The Symbol Summary panel holds a lot of information. Like the SCTR panel, you’ll have to scroll down to find the info you’re looking for. But let's suppose TEAM is looking like it will earn a spot in my ChartList. Personally, I like to take one more step.
Step 8 - Check the Seasonality Calendar
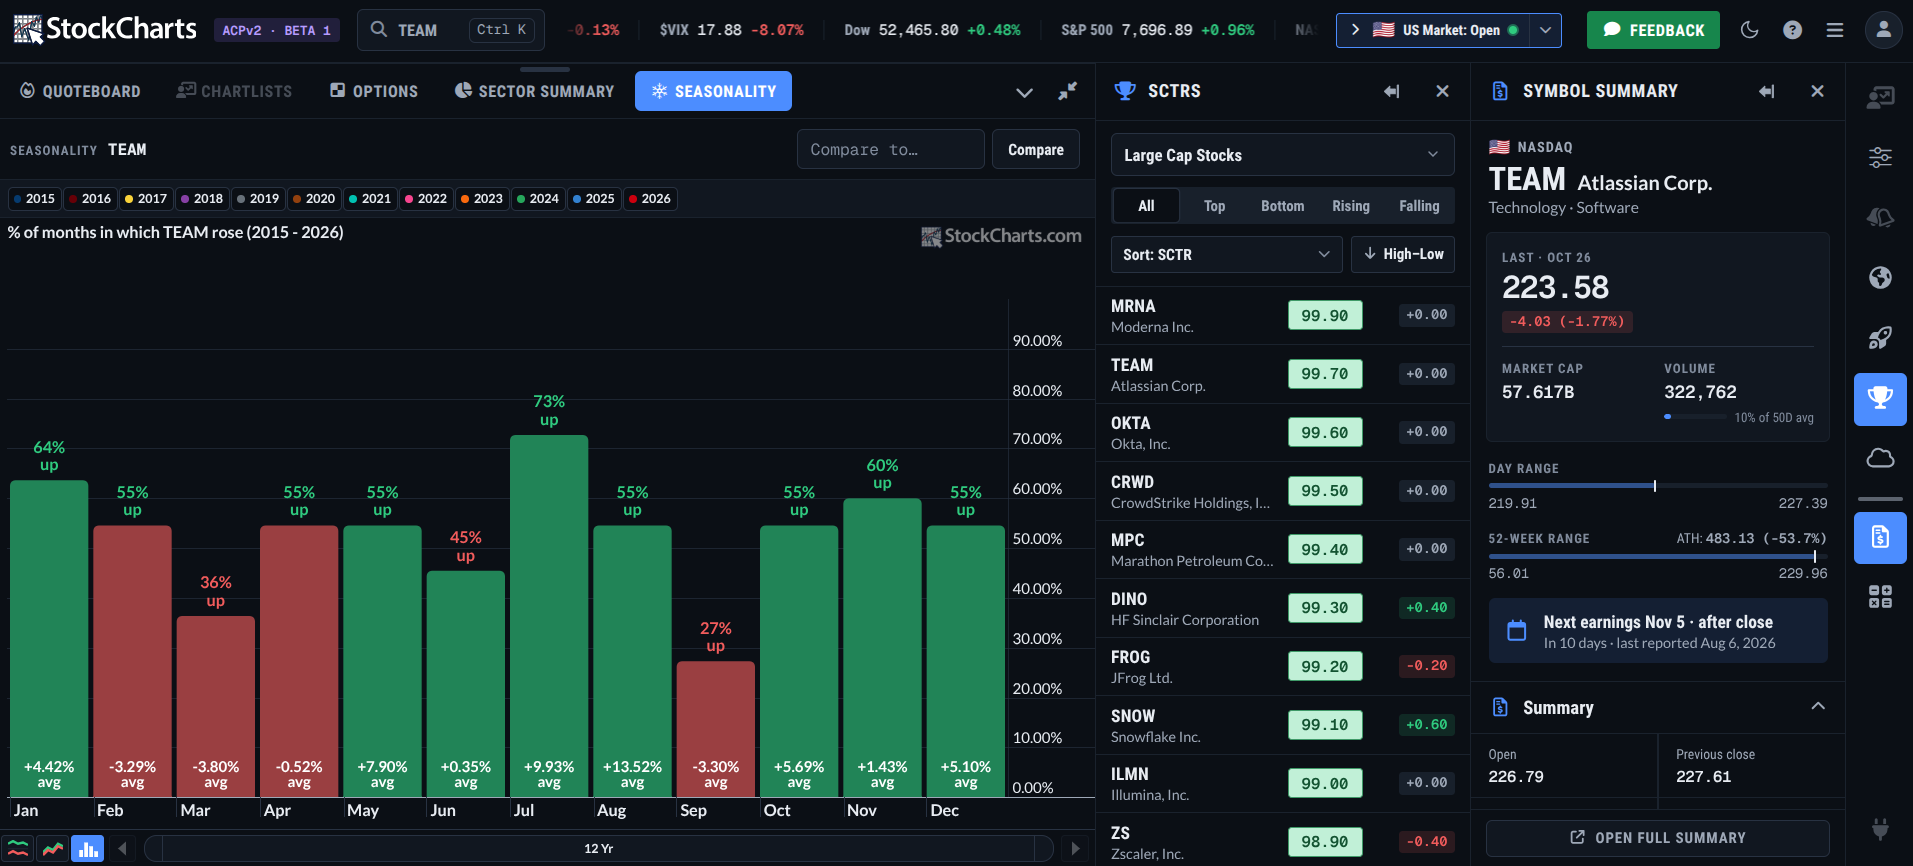
October through January are decent months for the stock. It closed higher more than half the time, and October, December, and January posted solid average returns. But none match July, its strongest month, with a 73% higher-close rate and an average 9.93% return.
But what about relative seasonality compared with the S&P 500? To see that, I’ll type in SPY in the box at the right that says “Compare to…” and I’ll expand the seasonality panel to get a better look. Here’s what I got:
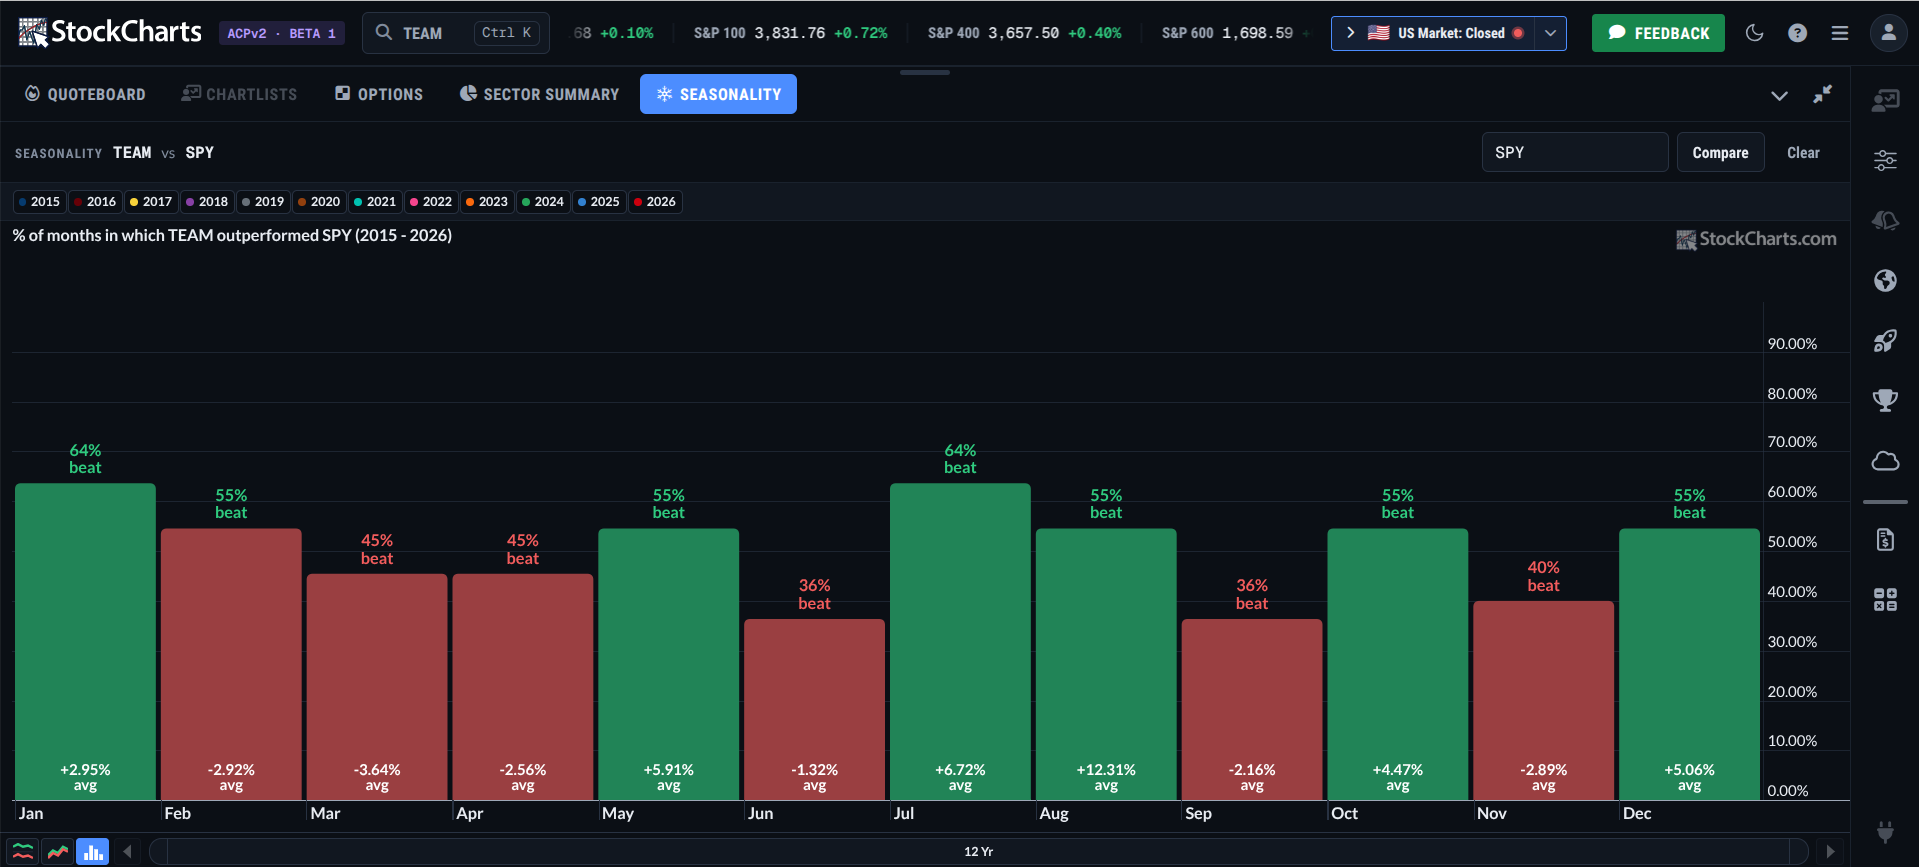
Stacked up against SPY, January and July are the top months. Both have higher closes relative to SPY 64% of the time. August has the biggest average outperformance, at over 12%, but closes higher only half the time relative to SPY. I suspect August’s outperformance might be skewed by a few years of big gains. October through January still looks decent, minus November, which lags against the broader market.
Step 9 - Save It to a ChartList and Set an Alert (coming soon)
At this point, I’d save TEAM to a ChartList. That feature hasn’t made its way into ACP2 yet, but it's on the way. For now, I’ll skip to the important part and write down why TEAM earned a spot on the list: the SCTR rank that surfaced it and its strongest seasonal months. I’d also set an alert for when price hits a potential entry trigger, and that one’s coming soon as well.
Insider Tip #1: Use the Ticker Cloud as a Crowding Check.
The Ticker Cloud shows the symbols other members are charting most. It’s arranged by popularity. If your stock pick is showing up in giant type, you’re not early. In the example above, TEAM is nowhere to be seen.
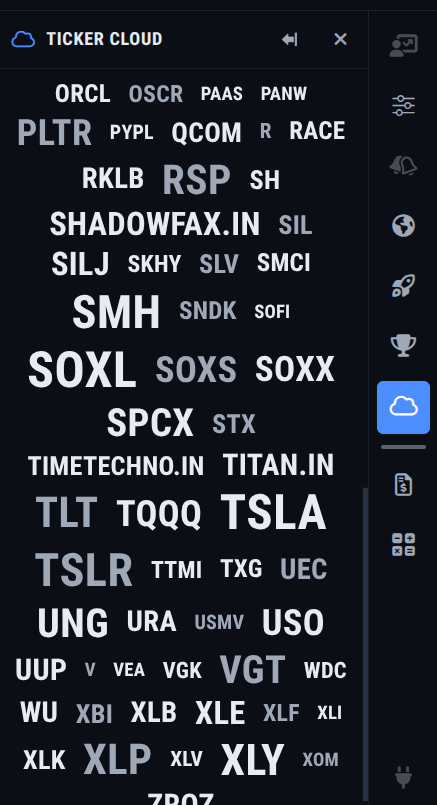
This is neither good nor bad. It just shows that TEAM isn’t among the more popular stocks with members on an intraday basis.
Insider Tip #2: Don’t Forget the SCTR Rising Tab.
In the example above, I glanced at the All tab. That shows the stocks that are already leading. The Rising tab shows which stocks are catching up, sorted by how much their SCTR score jumped. If you’re looking to catch names that are rapidly increasing in technical strength, this is the tab to use.
Insider Tip #3: Shrink the Quoteboard for an Even Faster Read.
Load up the S&P 500 and drag the Tile Size slider to its lowest setting. You might not be able to see the numbers, but that’s okay. The color pattern tells you what’s rising and what’s falling at a glance.
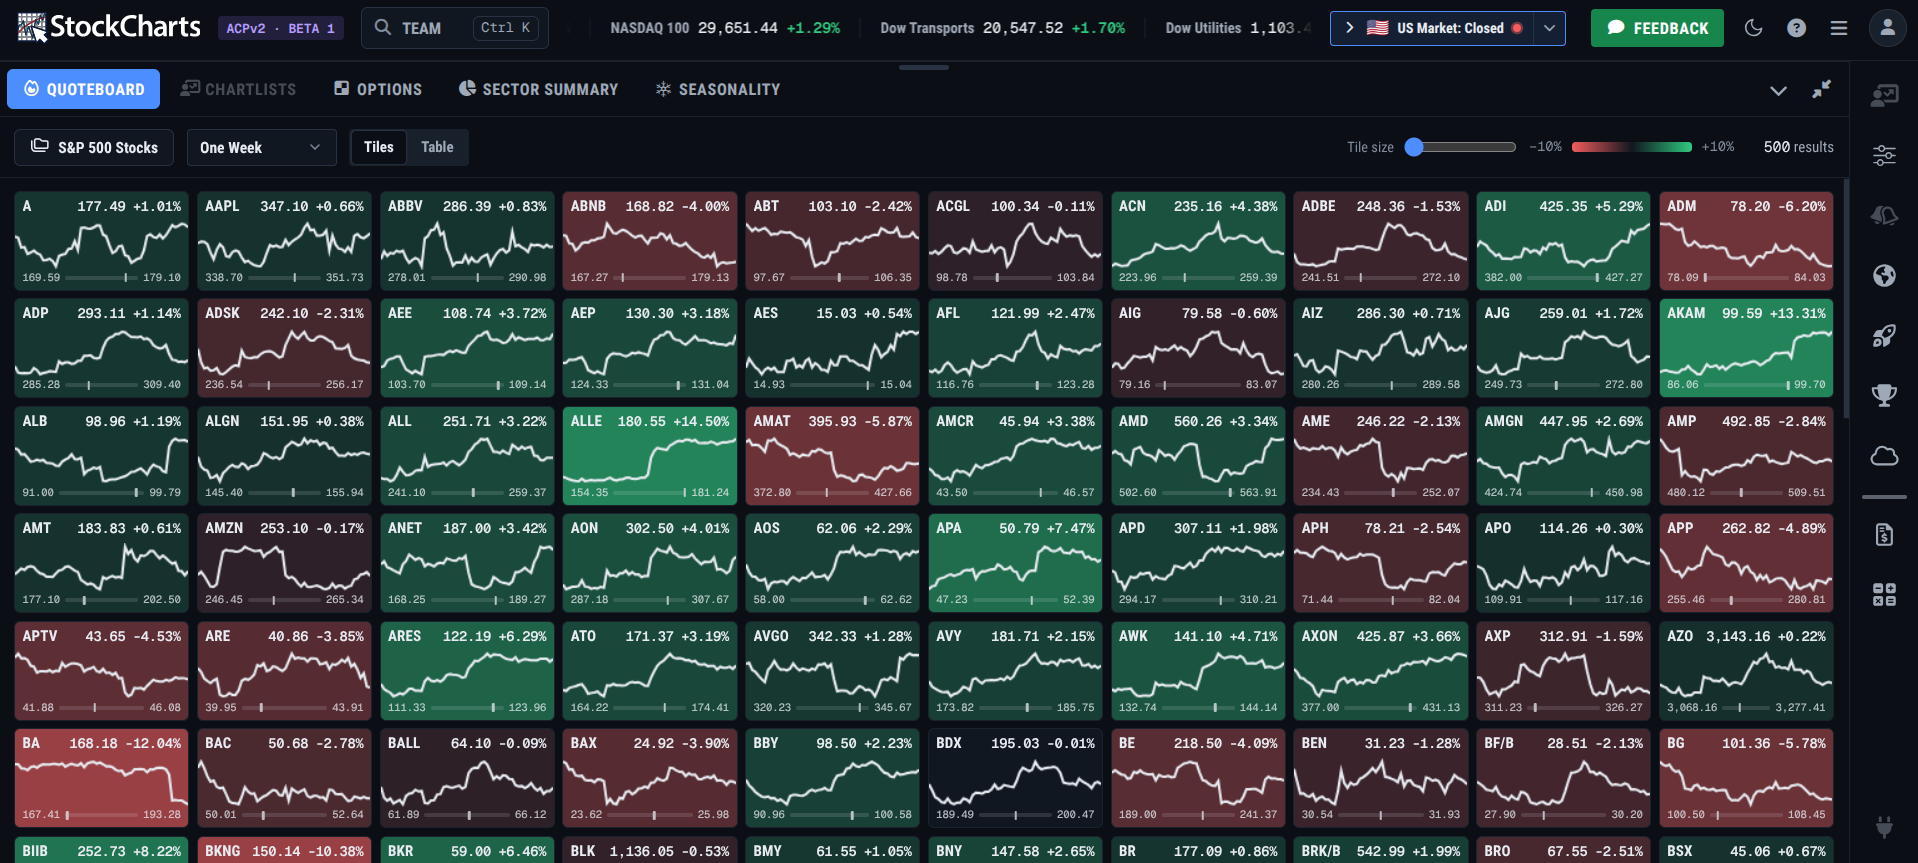
I personally like to go through the entire process above, but, for some people, particularly intraday traders, this is a fast way to find what’s moving right now.
And That’s a Wrap
As of writing, ACP2 is still in Beta, and it's obvious from all the features listed “Coming Soon.” But I had to write about it anyway because it allowed me to work at a certain speed that I thought was remarkable. Give it a try yourself. You might find a different workflow that matches your style better than mine.
Disclaimer: This article is for educational purposes only and is not investment advice. Examples are for illustration, not recommendations. Do your own research or consult a financial professional before investing.