Panic Selling in AI and Semiconductors Creates Opportunities Elsewhere

It's hard to fathom that the iShares Semiconductors ETF (SOXX) traded at 198.81 on October 2, just five weeks ago. On Thursday of this week, the SOXX hit a low of 130.75, a drop of more than 34% in just over a month. That was roughly what happened to the S&P 500 in five weeks when the COVID pandemic surfaced in February 2020. Fortunately, much of the selling this time was concentrated in technology (XLK).
But if we look at it from another angle, the same SOXX traded at 49.07 at the S&P 500 low on April 7, 2025. Even after all the selling over the past five weeks, the SOXX is still up 167% in a little more than 1 1/2 years.
That's called perspective. But it's also called confusing.
Should we be buying AI- and semi-related stocks or should we be selling? Well, that's a discussion for another day while we let the trade settle down a bit. It's simply too volatile and too emotional right now to make a proper call. However, I plan to have a FREE LiveStream event on YouTube, "The Great AI Shakeout." It'll be held on Monday, November 16, just after the stock market closes, at 4:05pm ET. You can get more information, register for the event, and save your seat by CLICKING HERE.
For now, let's get back to what we know. Semiconductors were bludgeoned.
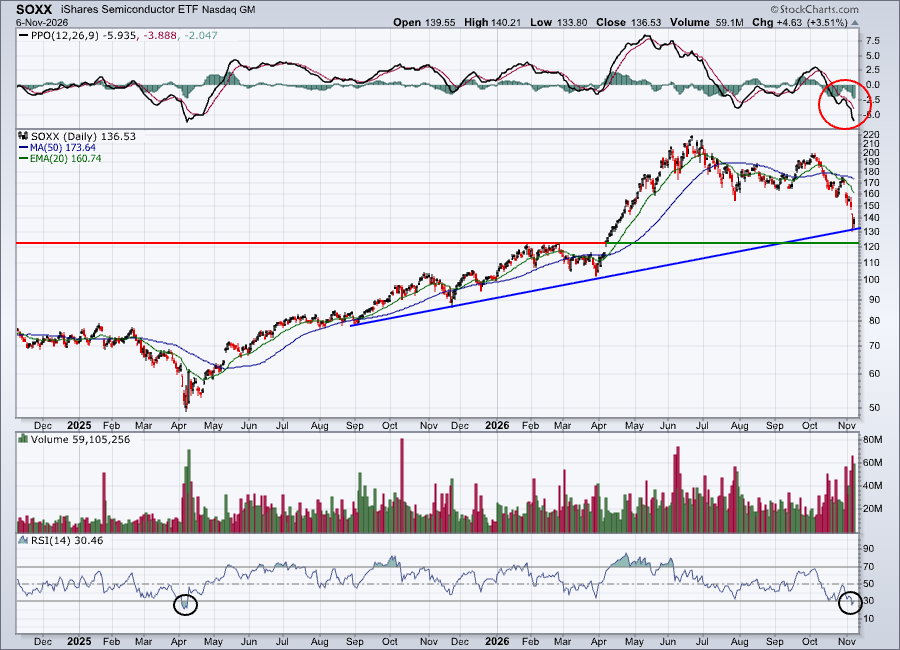
The PPO has turned decidedly negative, indicative of a group controlled by the bears. The RSI moved below 30 for the first time since the cyclical bear market price lows were reached back in April 2025.
An argument can be made that the SOXX is now oversold and testing trendline support. We can't rule out a short-term bounce next week or the following week into monthly options expiration. Still, the selling has been intense, and it feels like we need to see capitulation. Perhaps that occurs closer to the low-120s, which is where the February top was prior to the last breakout.
In the meantime, selling in the semiconductors, AI, internet, telecom equipment, commercial vehicles & trucks, and heavy construction, all industry leaders throughout much of the current secular bull market advance, is creating opportunities in other areas, namely Financials, Health Care, and Consumer Discretionary. In the following chart, I'll show you the recent turn in relative strength of several industries, so you can get a visual of what's taking place in the U.S. stock market right now.
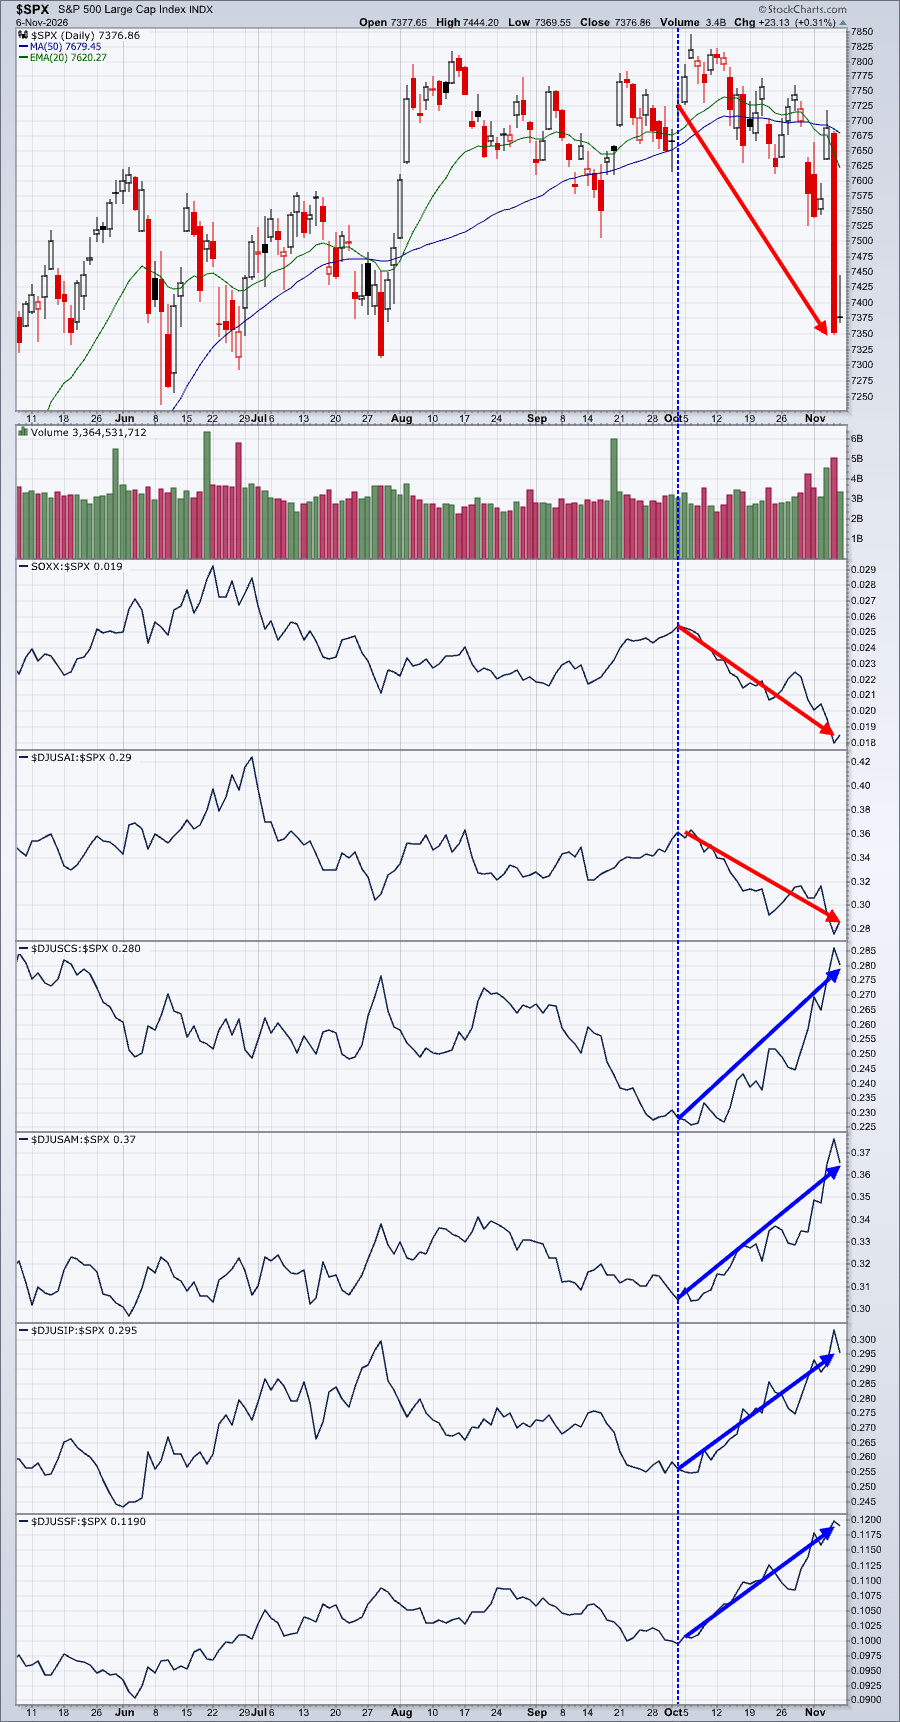
This one chart tells us the whole story. Given the change in the political environment based upon election results, investors are moving away from the high-growth areas of the market and instead moving into more value-oriented areas.
It's that simple. It's also how the market has mostly worked during Q4 throughout this secular bull market. Financials, for instance, perform best in Q4, and we're seeing it again in Q4 2026.
I hope to see you at my AI event on November 16th (register using link above)!
Happy trading!
Tom