AI on the Ropes: Can Tech Stocks Stage a Year-End Comeback?

Key Takeaways
- Semis suffered sharp October losses as investors rotated aggressively into defensive sectors.
- The VanEck Semiconductor ETF (SMH) faces a critical technical test near $504, while AMD earnings and upcoming economic data could add to market volatility.
- Midterm election seasonality favors a potential year-end rebound, but technology and AI stocks must regain leadership to fuel a sustained advance.
Knives have been out for tech-related companies as they report Q3 results. Apple (AAPL) may provide some post-earnings stability on Monday, but, from there, the focus shifts back to the macro amid a slew of employment reports and PMI updates.
Indeed, it's Jobs Week on Wall Street, and the data hit just as the AI mega-theme finds itself on the ropes. October's 6.66% Nasdaq 100 (QQQ) decline came along with rising CDS spreads for the hyperscalers and dramatic declines in the likes of Alphabet (GOOGL) and Meta Platforms (META).
October's Tale of the Tape: Unstable Broadening
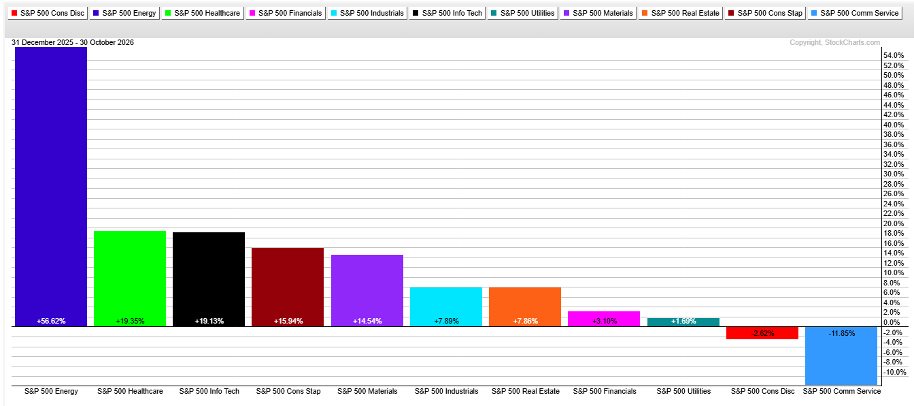
But as Information Technology and Communication Services limped into the end of the month, other sectors were full steam ahead. Health Care, Consumer Staples, and Utilities were defensive winners. Health Care, in fact, snatched the No. 2 YTD sector performance spot from I.T. ahead of Halloween, tagging its 15th record high of the year. Staples, meanwhile, tallied its top month since 2000.
Overall, U.S. large-cap value (IWD) put up its best month vs. U.S. large-cap growth (IWF) since February 2001, with the S&P 500 equal-weight ETF (RSP) outperforming the S&P 500 ETF (SPY) by the most since 2009.
Hopes Pinned to the Calendar?
It all sets the stage for whatever the post-midterms trade has in store. I expect palpable fear in AI to lay the groundwork for a year-end rebound. We’re now in the throes of the most bullish part of the election cycle, with the S&P 500 having never put red on the board from November 1 of the midterm year through June 30 of the pre-election year.
For the seasonal trend to reveal itself, tech and AI must lead, in my view. Practically speaking, defensive sectors likely have only so much room to run further, based on valuation. Technicals, on the other hand, show nothing but blue skies above for Health Care and Staples, while Utilities has congestion to work through.
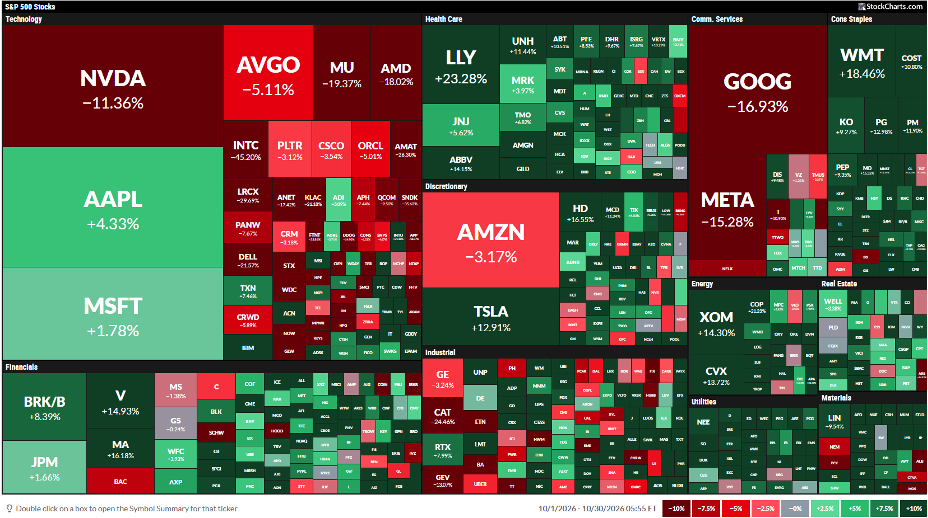
All Eyes on AI Leadership
Semiconductors are the most important chart in the market as we begin November. The Philadelphia Semiconductor Index ($SOX) settled Friday below its 200-day moving average for the first time since May 30, 2025. After kissing that trend indicator line a week earlier, the pre-Halloween trade was spooky.
The traded VanEck Semiconductor ETF (SMH) has a similar look. It dove through the 200-DMA on high volume before a final-hour Friday snapback. A lot is going on with the chart, so let's unpack it. I assert that it's the bull-market bellwether.
Notice in the SharpChart below that not only is the 200-DMA key, but so too is the July 29 Situational Awareness low of $504. This support confluence is critical. Below it, SMH has a dubious air pocket down to $420, which was the range high from the first quarter. I also spot a lingering downside gap near the $400 spot.
The April 8 thrust off the March 30 low left many charts susceptible to a gap fill, and SMH is perhaps the most critical of all. Recall last week that Intel (INTC) filled its April 24 earnings-related gap in a blaze of glory. Gaps are like unfinished business on a chart, and the closer price approaches, the more likely it is that said business gets resolved.
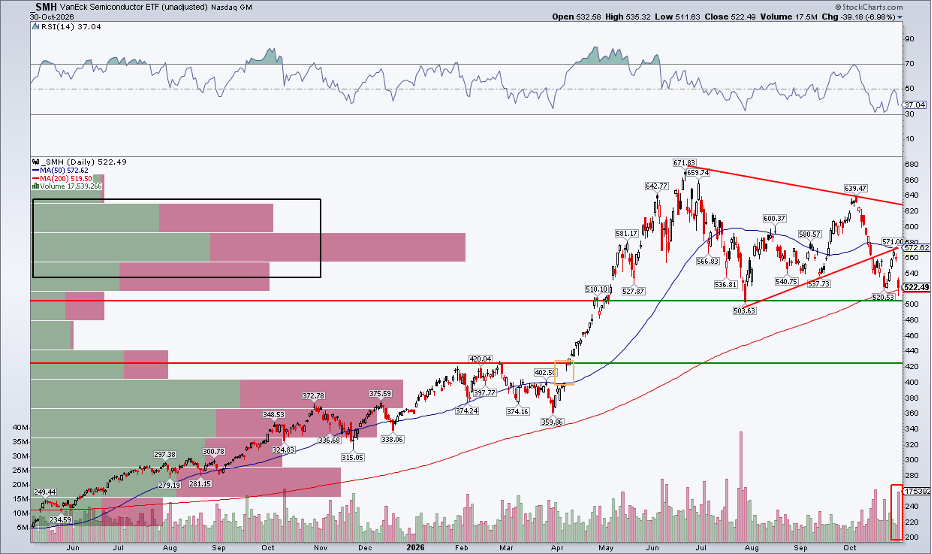
Also look at the volume-by-price profile on the left side of the chart. I've said it before: there are many 'dead bodies' above the October settle. This high congestion may make rally attempts tough on the bulls. The RSI momentum oscillator at the top, meanwhile, has been sub-50 for the last three weeks, with price backing away from the 50-DMA on Fed Day last week. There are no decisive resistance spots, making the low $500s crucial for the chip and AI bulls to defend.
You're Next, AMD
There's no shortage of volatility catalysts this week for semiconductors. Tuesday's midterms and Friday's jobs report are sufficient tinder, but, before election results trickle in, AMD (AMD) posts Q3 numbers.
The $830 billion market-cap server supplier is 21% off its October 6 high, but it also boasts some longer-term relative strength to SMH. Shares are 20% above the 200-DMA. I also see apex support from the summer consolidation in the mid-$450s. If the earnings grim reaper comes after AMD, I see it as a buying opportunity.
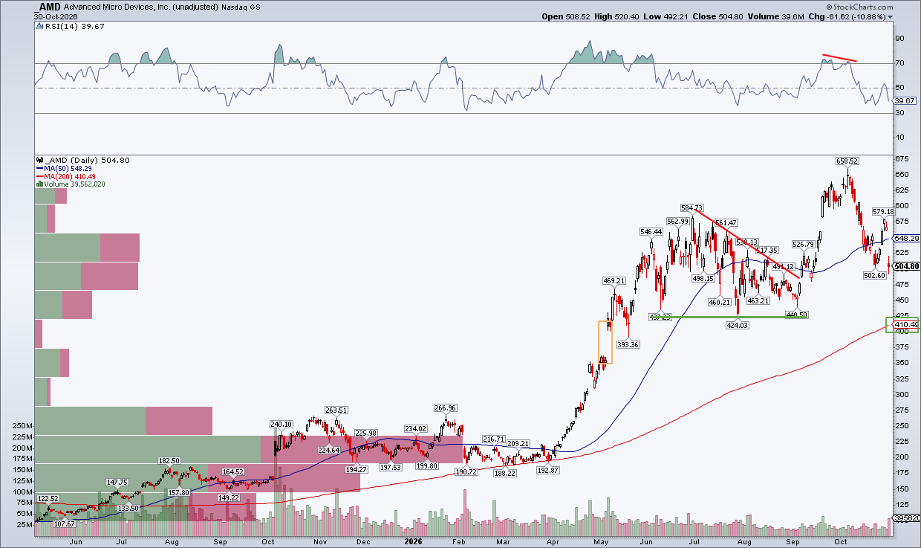
As it stands, the options market prices in an elevated 7.6% earnings-related stock price swing this week. AMD's chart remains mixed, though. While there's not substantial overhead supply, the September–October false breakout is ominous, and $580 is possible resistance (near the June peak and where AMD petered out last week). Big picture, like most chip charts, the bulls and bears have technical data points to lean on.
Beyond AMD, Taiwan Semiconductor (TSM) earnings hit on Tuesday, November 10, followed by NVIDIA (NVDA) a week later.
The Bottom Line
AI stocks ceded major ground over the back half of October. One of the most dramatic defensive rotations since the dotcom bust buffered S&P 500 losses. New tests come this week via Apple, AMD, the midterms, and October economic data. The bulls have seasonality and election-cycle trends on their side, while the bears hope to give semiconductor charts a knockout blow to confirm new downtrends.
Disclaimer: This blog is for educational purposes only and should not be construed as financial advice. The ideas and strategies should never be used without first assessing your own personal and financial situation, or without consulting a financial professional.