Semiconductors Flash Red, But Market Breadth Tells a Different Story
On June 30, the final trading day of the second quarter, semiconductors looked ready to come roaring back. But by Thursday’s close, the last trading day of this holiday-shortened week, that comeback looked a lot less certain.
In this update:
- Semiconductors flash red
- Getting a head start before Monday's open
- Health Care hits record highs
The MarketCarpet below tells the story pretty clearly. Semiconductors sold off sharply, and it was a sea of red across the group.
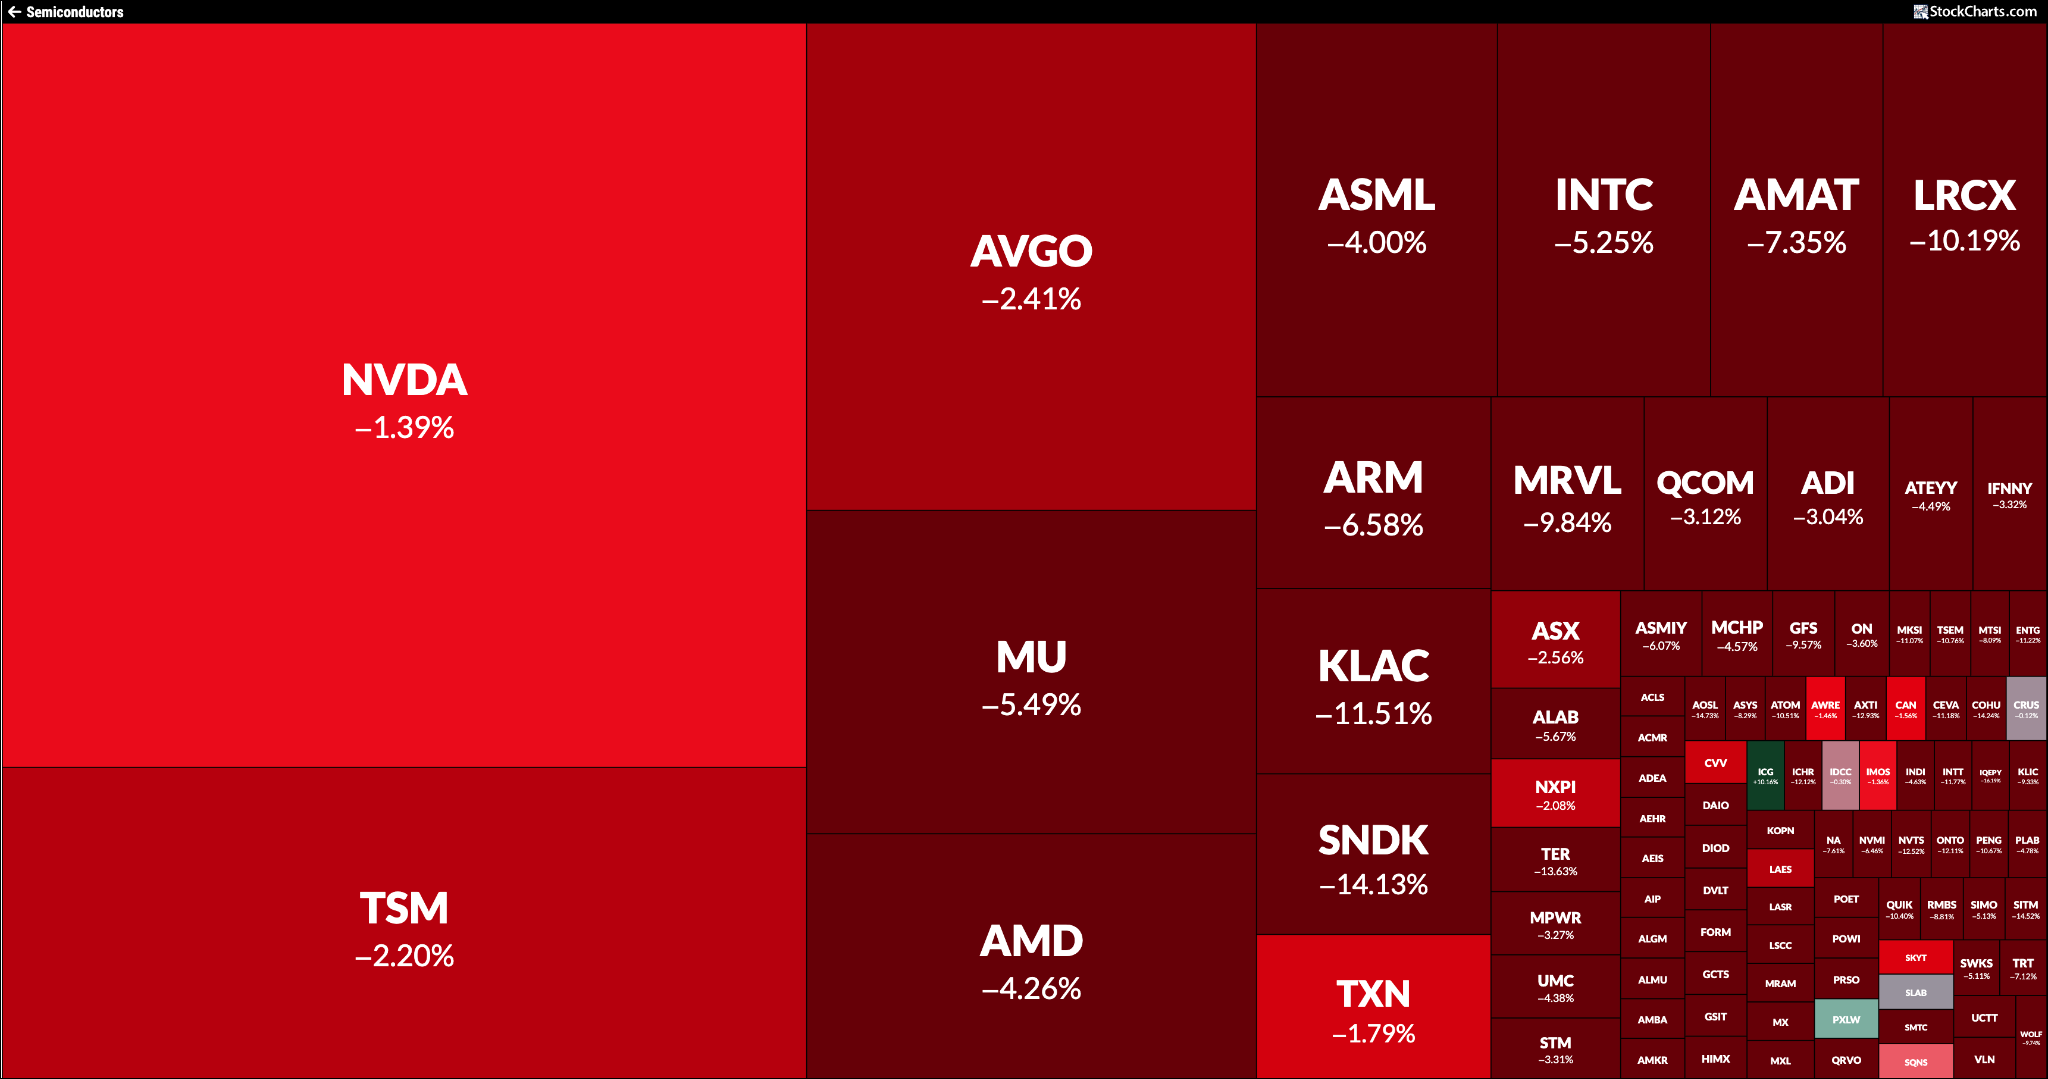
The VanEck Semiconductor ETF (SMH) fell 4.57% on Thursday and closed below its 21-day exponential moving average. It did manage to hold above its 50-day simple moving average, though.
What made Thursday’s price action interesting was that the weakness wasn’t broad-based. While technology stocks came under pressure, the Dow Jones Industrial Average ($INDU) closed at a record high, gaining 1.14%. Sector performance also leaned positive. Eight of the 11 S&P 500 sectors closed in the green. So, while semiconductors lost some momentum, investors aren’t abandoning stocks. They’re just rotating out of tech and into other areas.
Overall, the major indexes are still in long-term uptrends, breadth continues to expand, and sentiment is still bullish.
Get a Head Start
After Thursday’s close, I ran a few scans from our Sample Scan Library. One scan I like to run to confirm market strength is “Moved Above Upper Bollinger Band.” This scan returned 133 stocks, with Financials and Health Care making up a large portion of the list.
Health Care was the top-performing sector on Thursday, with the Health Care Select Sector SPDR (XLV) closing at a record high. If that momentum continues into next week, some of the Health Care stocks on this list, such as AbbVie (ABBV), Amgen (AMGN), and Gilead Sciences (GILD), could be worth monitoring.
Running your favorite scans before the market opens on Monday is a smart habit to build into your routine. It gives you a head start on where strength is showing up, where leadership may be shifting, and which charts are worth analyzing closely.
There are many ways to narrow your scan results. For example, if I’m only interested in the Health Care stocks, I would modify the scan criteria to include stocks in the Health Care sector. Just click the Edit Scan Criteria button, select Health Care from the Sector dropdown in the Scan Components panel, and add it to the Scan Criteria. After narrowing your list, you can save the scan results to a ChartList or view them in CandleGlance or SharpCharts formats.
The more often you run scans, the more engaged you become with the market. It’s a great way to prepare for the trading week or trading day ahead.
Our Support Center has several educational articles that can help you get more comfortable with the StockCharts Scan Engine. With the long weekend here, it may be a good time to explore them and sharpen your analytical skills.
Wishing everyone a safe and happy Independence Day!