Week Ahead: Directional Move Eludes Nifty; Index Yet to Navigate Overhead Resistance Cluster

The market remained largely range-bound this week with a negative bias throughout, ultimately ending lower. The Nifty oscillated within a relatively contained 355-point range, between 24,265.95 and 24,620.95, as attempts to extend the recent recovery were met with selling pressure at higher levels. Volatility eased further, with India VIX declining 6.99% for the week to 11.31, reflecting a continued absence of significant risk aversion. The Nifty eventually settled at 24,366, registering a weekly loss of 204.65 points (-0.83%).
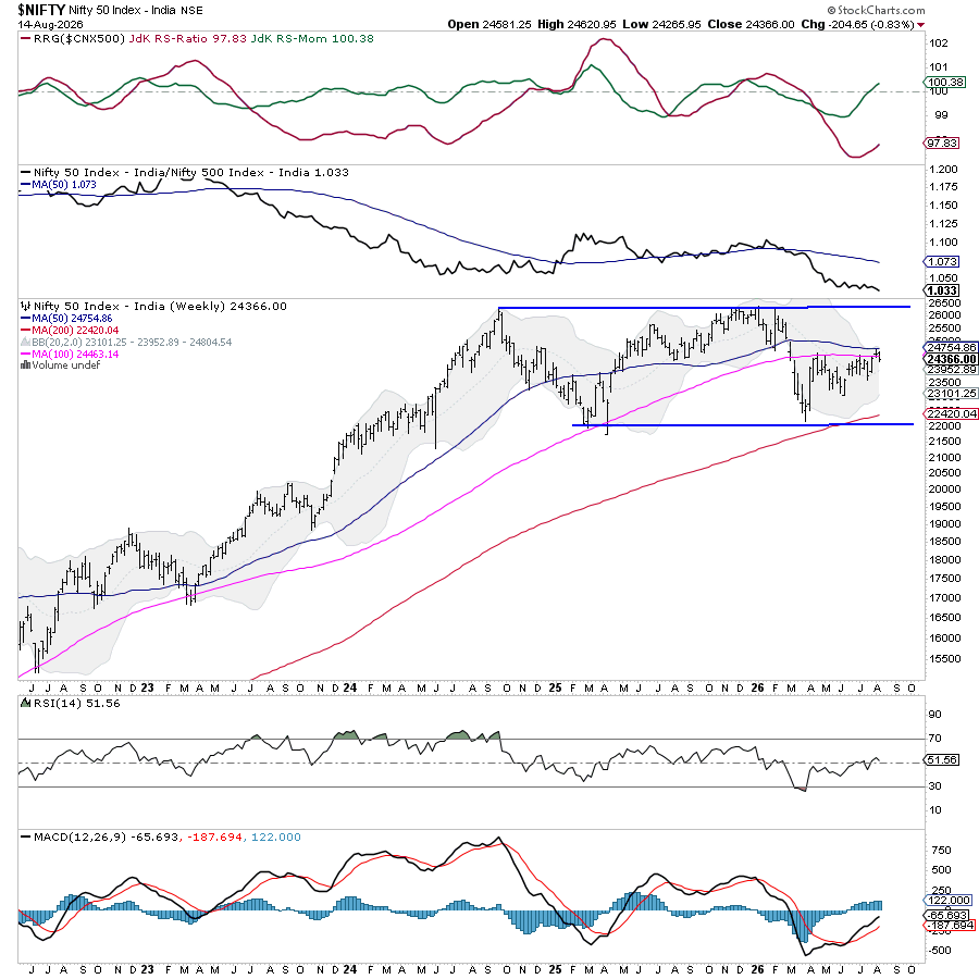
The broader technical structure remains one of consolidation, with the Nifty still negotiating a crucial overhead resistance cluster. The 24,500–24,750 zone assumes immediate significance, as it houses an important confluence of the 200-day, 50-week, and 100-week moving averages.
This clustering of major averages makes the zone a formidable technical barrier and is likely to keep upside moves measured until it is decisively cleared. A sustained move above 24,750 would materially improve the structure and could trigger a more directional trending upmove. Until that happens, the index is likely to remain range-bound with a mild corrective bias.
On the downside, the 23,950–24,000 region continues to be an important near-term support area, and a violation of this zone would increase the possibility of renewed weakness towards lower supports.
The coming week is likely to see a quiet start, with the Nifty continuing to consolidate unless it is able to reclaim the overhead moving-average cluster. The immediate resistance levels are placed at 24,500 and 24,750, while supports are expected at 24,000 and 23,800. Price behaviour around 24,500–24,750 will remain particularly important, as acceptance above this zone would signal a meaningful shift in momentum.
The weekly RSI stands at 51.56, remaining neutral and showing no divergence against price. It continues to hold above the 50-mark, but has yet to display the momentum required for a strong directional advance. The weekly MACD remains bullish and above its signal line.
Pattern analysis shows the Nifty continuing to trade within a broad multi-month consolidation structure. The recent rebound has brought the Index back into the moving-average congestion zone without producing a breakout. The 50-Week MA at 24,754.86 remains an important overhead hurdle, while the 100-Week MA at 24,464.14 is being tested in the immediate vicinity of current prices. Meanwhile, the 20-week average/Bollinger midline near 23,952.89 provides an important support reference. The intermediate trend will turn decisively stronger only after the 24,500–24,750 supply zone is cleared.
The coming week, therefore, warrants a measured and stock-specific approach. The sharp decline in India VIX suggests that volatility expectations remain subdued, but this by itself does not provide a directional trigger. Fresh buying should preferably be concentrated in stocks displaying relative strength and clean technical breakouts, while profits should be protected as the Index approaches the 24,500–24,750 resistance band. A decisive breakout above 24,750 can justify increasing long exposure, whereas failure to hold the 23,950–24,000 area would call for greater caution. Until either boundary is resolved, the week is best approached by buying selectively near support, avoiding the pursuit of extended moves, and keeping overall exposure controlled while the Nifty remains within its consolidation range.
Sector Analysis for the Coming Week
In our look at Relative Rotation Graphs®, we compared various sectors against the CNX500 (NIFTY 500 Index), representing over 95% of the free-float market cap of all the listed stocks.
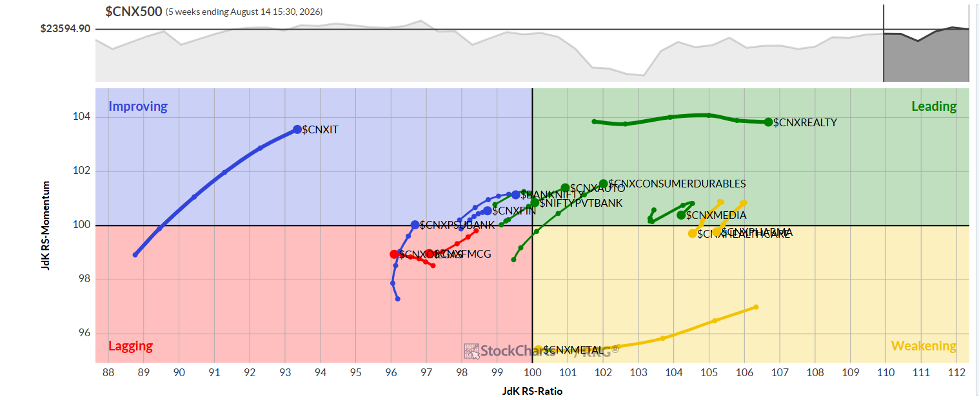
The Relative Rotation Graph (RRG) shows that the Nifty Auto sector index has entered the leading quadrant. Along with the Realty and Media Indices, which are also inside this quadrant, it is likely to relatively outperform the broader markets.
The Nifty Pharma Index has rolled inside the weakening quadrant. The Nifty Midcap 100, Energy, and Metal Indices are also inside the weakening quadrant. While stock-specific performance may be seen, the overall collective outperformance from these groups may see a slowdown.
The Nifty Infra, PSE, and FMCG Index continue to languish inside the lagging quadrant. The PSU Bank Index is also inside the leading quadrant, but looks to be sharply improving on its relative momentum against the broader Nifty 500 Index.
The Nifty IT, Financial Services, Services, and Nifty Bank Index are inside the improving quadrant.
Important Note: RRG™ charts show the relative strength and momentum of a group of stocks. In the above chart, they show relative performance against the NIFTY500 Index (Broader Markets) and should not be used directly as buy or sell signals.
Milan Vaishnav, CMT, MSTA
Consulting Technical Analyst
www.EquityResearch.asia | www.ChartWizard.ae