The Best Five Sectors This Week #78

Key Takeaways
- Technology remains the top sector, but its dominance has dropped from 70% to 50% as other sectors gain weight.
- Financials and Health Care are rising, while Energy saw the biggest drop, falling from second to sixth.
- Industrials entered the top five, showing improving momentum, while Real Estate is struggling with resistance.
- Portfolio relative performance is around 1%, narrowing the gap with the S&P 500 to 8% below since inception.
Technology’s Leadership and New Entrants in the Top Five
After a week in which the S&P 500 ($SPX) surged over 3%, the portfolio's sector composition is showing several changes, especially among the top five sectors. Technology remains firmly in the number one spot, but the rankings beneath it have shifted. Financials have climbed to second place from third, while Health Care has moved to third from fifth. Industrials is now a new entrant in the top five, landing at fourth after previously being sixth. Real Estate dropped to fifth from fourth, and Energy saw the biggest decline, falling from second to sixth.
Materials advanced from ninth to seventh, Consumer Staples held steady at eighth, and Consumer Discretionary moved up one position to ninth. Utilities dropped from seventh to tenth, and Communication Services remained unchanged at eleventh.
- (1) Technology - XLK [53%]
- (3) Financials - XLF [19%]*
- (5) Health Care - XLV [13%]*
- (6) Industrials - XLI [12%]*
- (4) Real Estate - XLRE [3%]*
- (2) Energy - XLE*
- (9) Materials - XLB*
- (8) Consumer Staples - XLP
- (10) Consumer Discretionary - XLY*
- (7) Utilities - XLU*
- (11) Communication Services - XLC
Sector Movements and Weight Changes
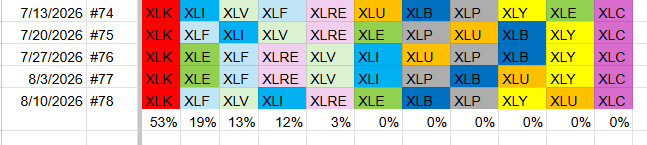
With Industrials now in the top five, and holding a larger weight in the S&P 500 than Energy, Technology's weight in the portfolio has decreased to 53%. Financials and Health Care also fell slightly, but the reduction in Technology’s weight is the most pronounced. Real Estate remains a minor component at 3%, while Industrials now account for 12%. This shift highlights a trend: although Technology is still the leading sector, its dominance is waning as other larger sectors enter the top five. Just a few months ago, Technology made up around 70% of the portfolio; now, it’s closer to 50%. This underscores the importance of sector market capitalization when constructing portfolios.
Weekly RRG
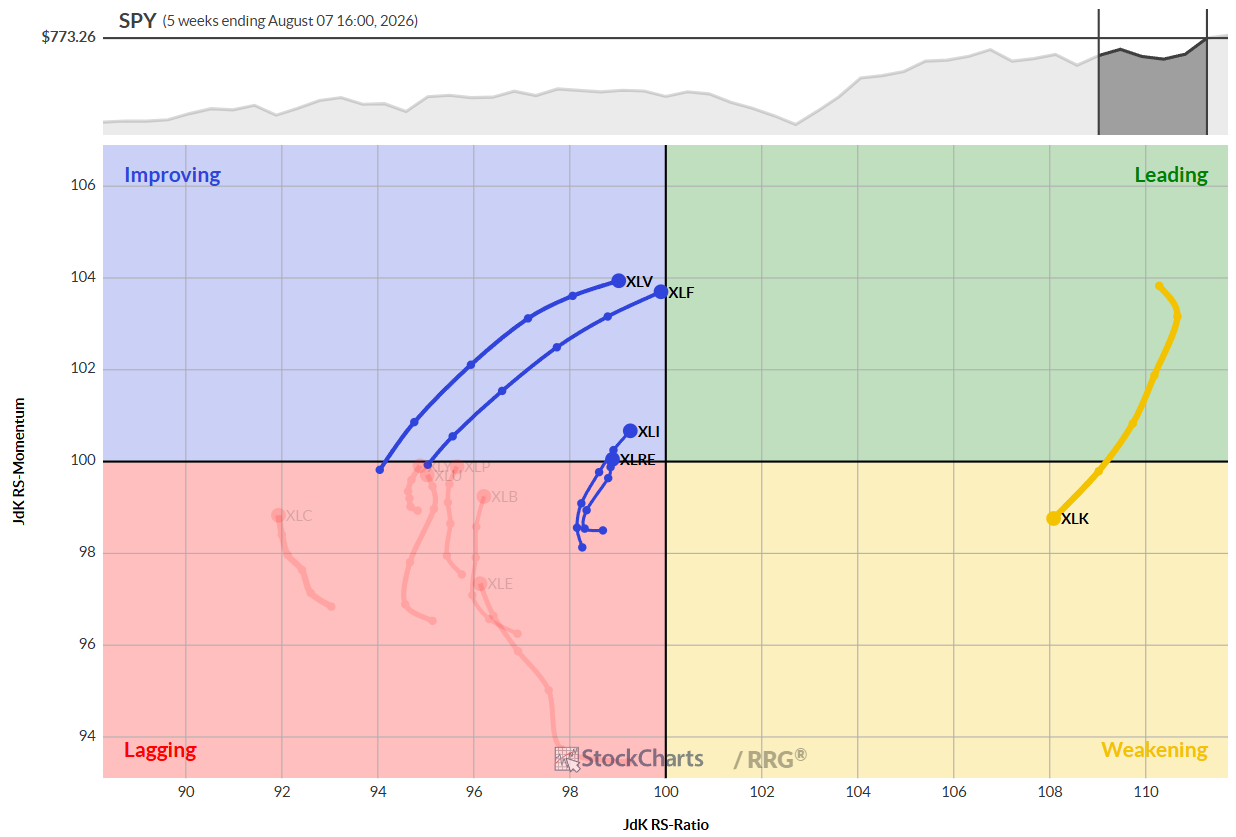
Reviewing the weekly Relative Rotation Graph (RRG) as of last Friday, technology is rotating from the leading quadrant to weakening, albeit at a high RS-ratio level. Health Care and Financials are nearing the leading quadrant, while Industrials and Real Estate are moving from lagging to improving. If these four sectors push further, we could see five sectors on the right side of the RS ratio scale, highlighting their current strength.
Daily RRG
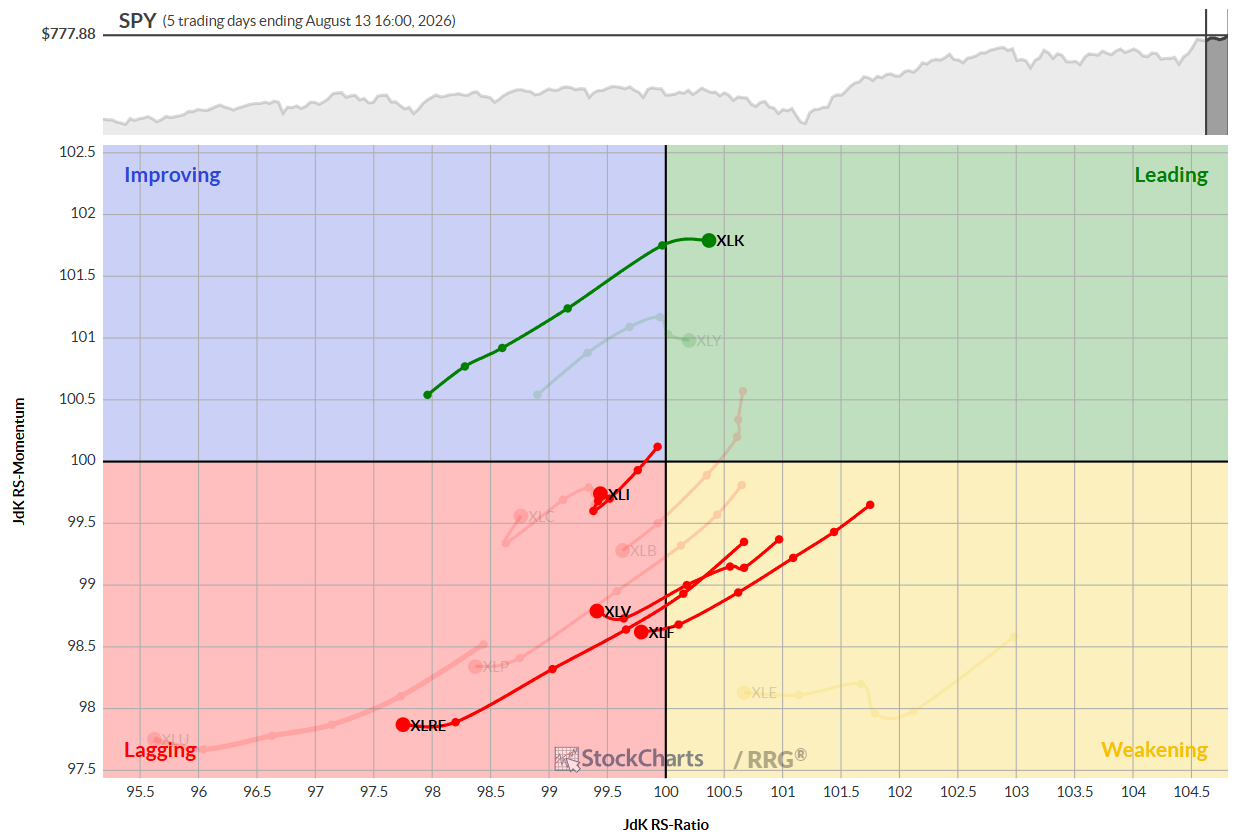
The daily RRG presents a somewhat different picture. Technology has completed its rotation and is back in the leading quadrant, which could eventually strengthen its weekly performance and restore its leadership in the S&P 500. Industrials show a sharp hook back up, and Real Estate, Health Care, and Financials are in the lagging quadrant but are flattening out, indicating a loss of downward momentum. If daily trends align with weekly rotations, it would reinforce these five sectors' strength.
Sector Highlights
Technology
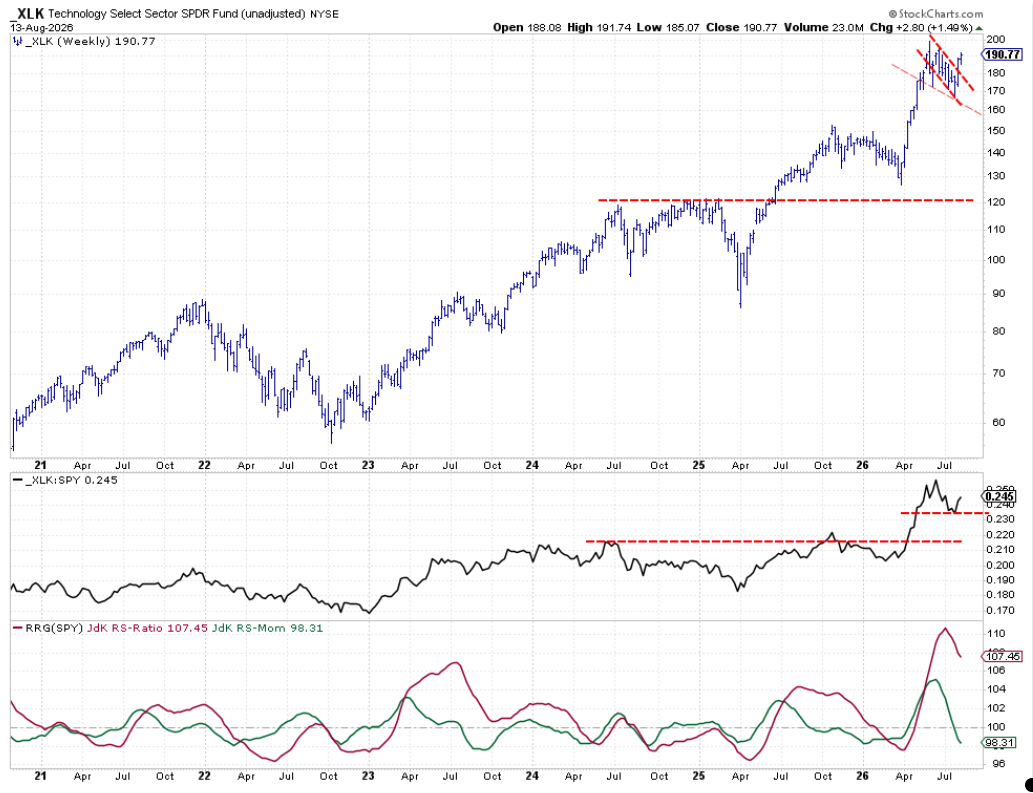
After breaking out of a consolidation pattern, Tech is holding up really well and approaching its all-time high near 200. The higher low in the raw RS line is encouraging and, although both RRG lines are currently pointing lower on the weekly chart, continued strength should reverse this trend.
Financials
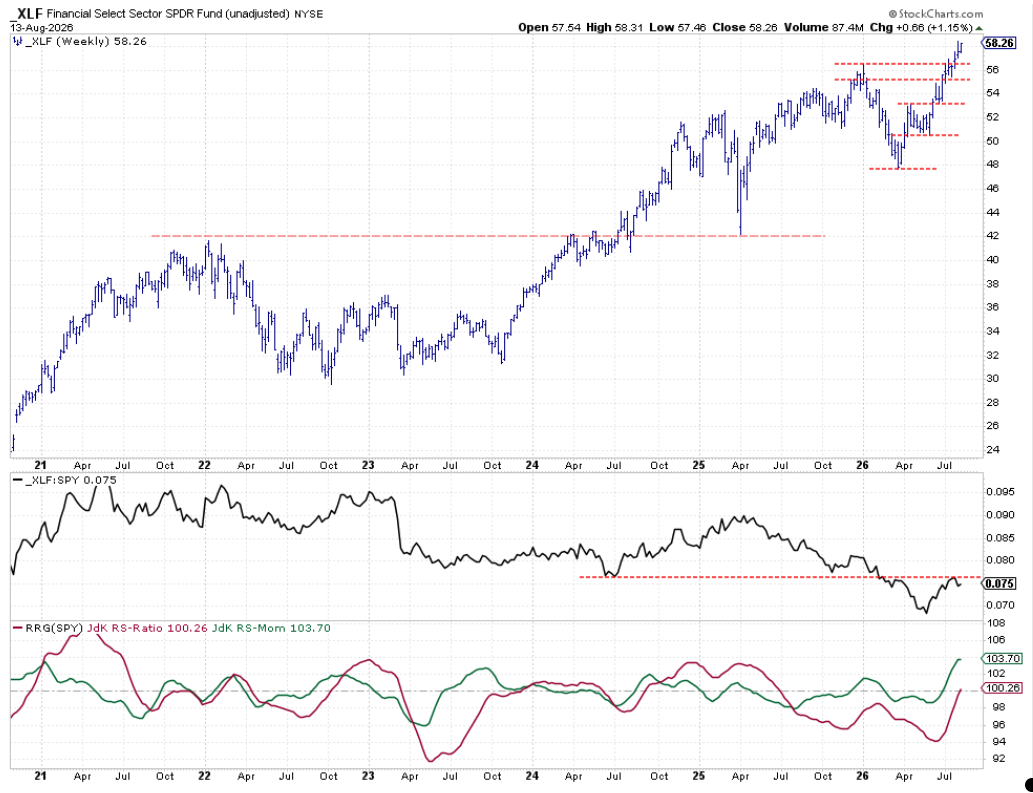
Financials have decisively broken above their previous high and are moving upward. The raw RS line faces resistance at previous lows, but upward-pointing RRG lines are promising. If prices continue to rise, the relative strength line should overcome resistance and pull RRG lines higher.
Health Care
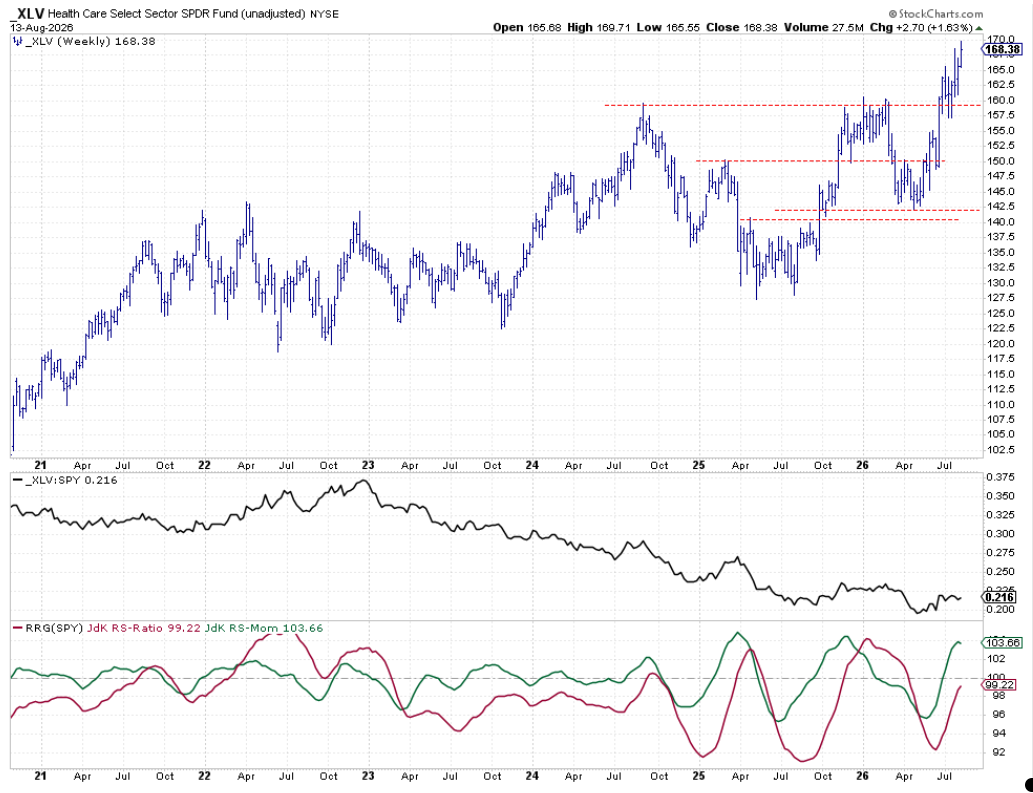
After a brief pause following a breakout above its 2024 and 2025 highs, healthcare is moving upward. The raw RS line is flattening but starting to rise, keeping RRG lines pointed higher. Strong RS-momentum is likely to push XLV into the leading quadrant soon.
Industrials
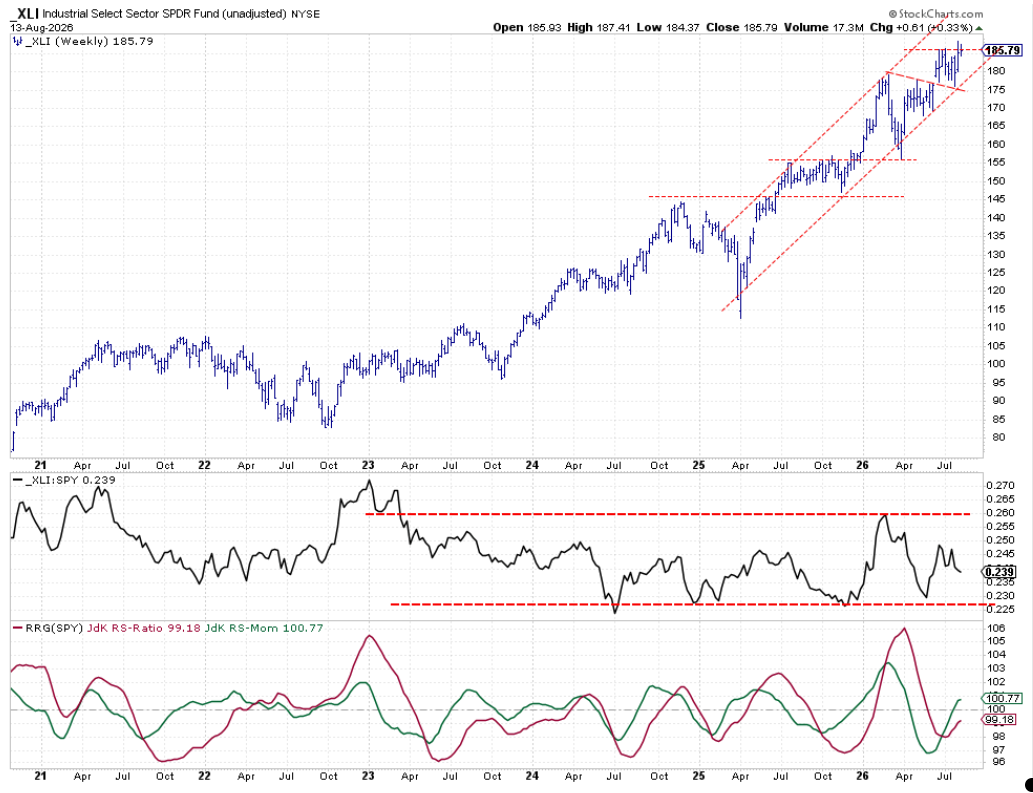
Industrials, now in the top five, remain within their rising channel and are attempting to break above their previous high. The raw RS line is mid-range, but RRG lines are responding positively to recent moves. The outlook is improving, though strength needs to be confirmed.
Real Estate
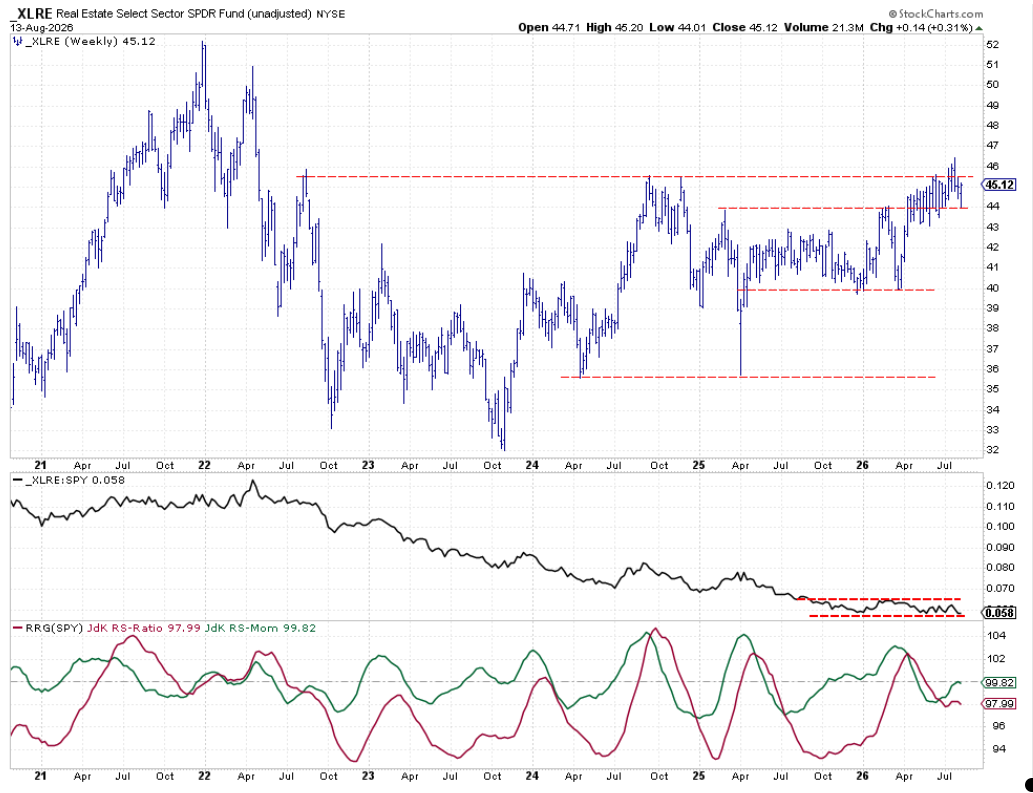
Real Estate continues to struggle with overhead resistance set in 2022, 2024, and recently. Attempts to break above have failed, and XLRE is now testing support around 44. The raw RS line has dropped to the lower boundary, causing RRG lines to flatten and roll over. Among the top five, real estate appears most at risk.
Portfolio Performance
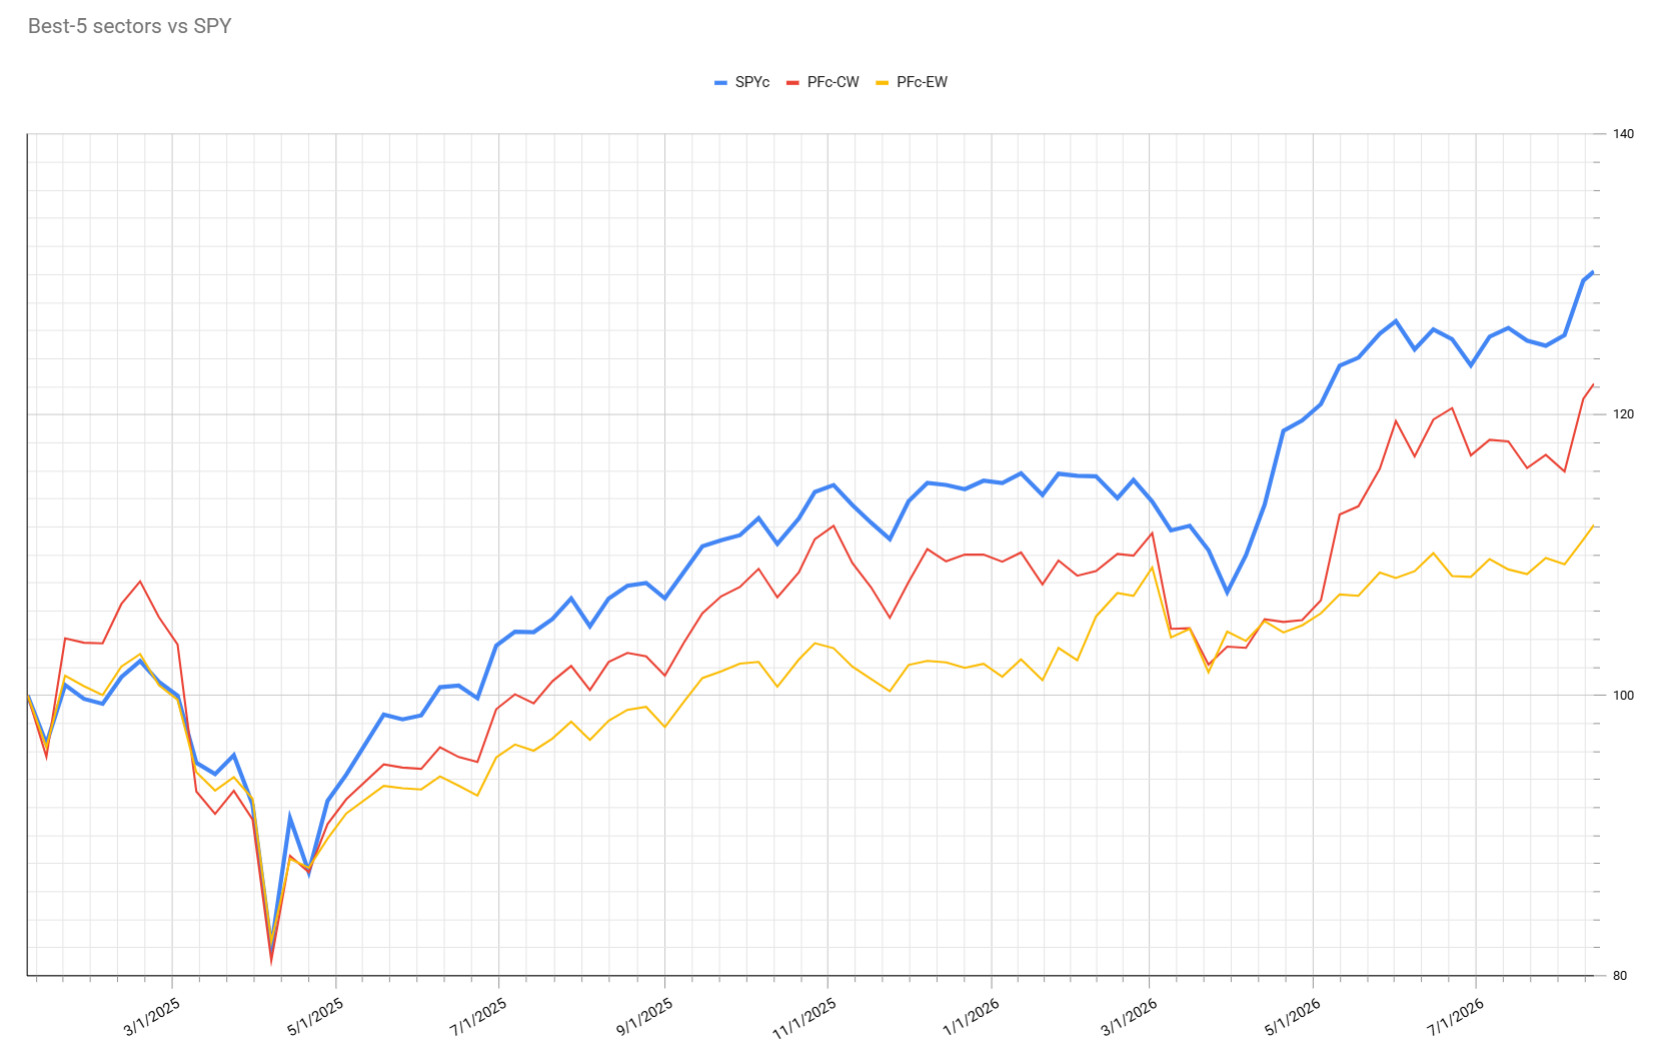
The portfolio caught up around 1% this week, now standing 8% below the S&P 500 since inception. While not yet where it needs to be, progress is being made, and the gap is narrowing. The long drawdown period is inconvenient but not unique compared to the backtest. The gradual improvement offers hope of eventually matching, then outperforming, the S&P 500.
#StayAlert, Julius