Small-Caps Lead, Breadth Improves as SPY Pulls Back; Bullish Setup for Industrials
Key Takeaways
- Breadth has improved, even as the SPY pulls back.
- Small-caps are continuing to lead as IJR hits a new high.
- Industrials are setting up with a consolidation above the breakout level.
SPY pulled back in early June, but remains in bull market mode with improving breadth. The bull market is broadening, with more stocks moving above their 200-day SMAs. This is especially true for small-caps, which were leading in March and have continued to lead in June. Within the S&P 500, I am seeing a bullish setup in the Industrials SPDR.
Breadth Improves Even as SPY Pulls Back
SPY took a hit in early June with a 4.5% decline from the high, but the long-term trend remains up and breadth is still bullish. As long as the weight of the evidence is bullish, pullbacks and corrections can be viewed as opportunities, not threats.
The chart below shows SPY gapping above its 200-day SMA on April 8th and SPX %Above 200-day SMA ($SPXA200R) moving back above 50% (lower window). These moves put the bulls back in control, and they remain in control. SPY surged 21% and hit new highs in April, May and June.
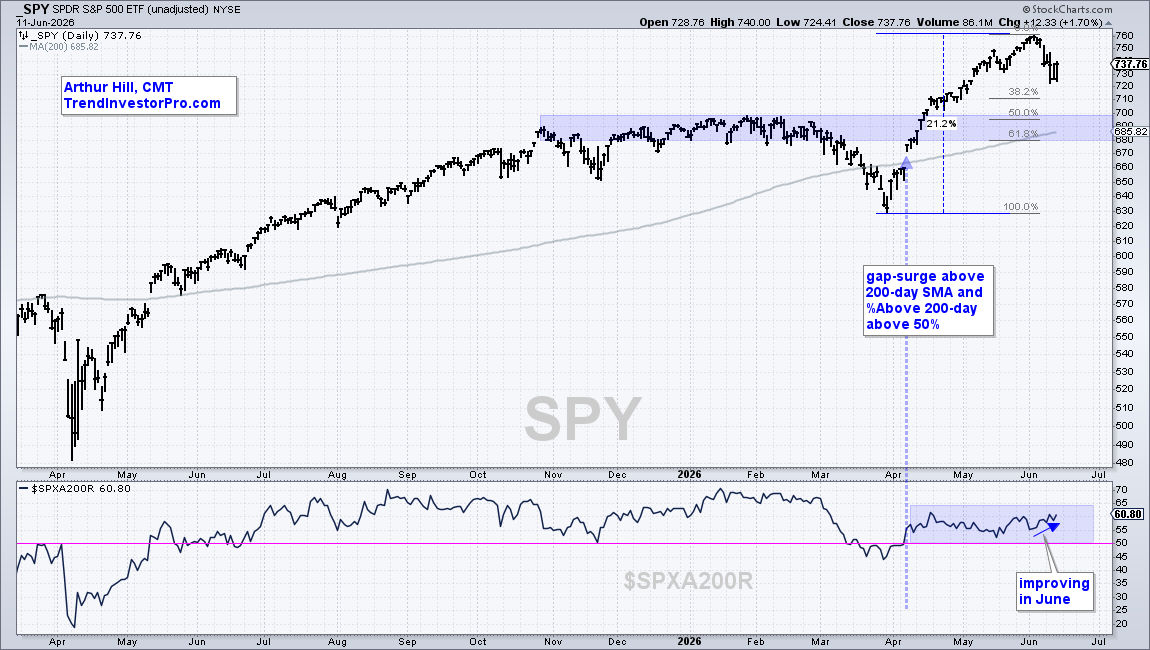
It is difficult to predict the length or duration of a pullback or correction. In fact, it is difficult to predict, period. Pullbacks can be short and sharp, such as late May or early August. The current pullback is the first since the April surge and buyers stepped in on Thursday with a 1.7% gain. Follow through above Tuesday's high (747) would be bullish and argue for a move to new highs.
Should this pullback extend into a correction, I would watch the 680-700 area for an opportunity (blue shading). Here we can see the rising 200-day SMA, the 50-61.8 percent retracements and broken resistance, which turns into support. It is normal for a correction to retrace 50% of the prior advance.
In the indicator window, $SPXPA200 moved above 60% as breadth improved in June. This means over 60% of S&P 500 stocks are in long-term uptrends (above their 200-day SMAs). Breadth improved even as SPY fell. This means the broader market is picking up the slack as money rotates out of large-cap tech stocks. Improvements in breadth are bullish, not bearish.
Recent Reports and Videos on TrendInvestorPro
- Hyperscaler Debt and Equity, MAGS Lags, Overextended Semis
- Breakouts in Finance, Brokers, Banks and Defense - Setups in Biotech
- Rising Rates and Hawkish Fed Weigh Gold - Copper Miners hit MoT
- Breadth Models Remains Bullish and Yield Spreads are Narrow
Click here to take a trial and gain immediate access.
Small-Caps Continue to Lead as IJR Hits New High
Yes, you read right! Small-caps were leading in March and have continued to lead in June. The chart below shows the S&P SmallCap 600 SPDR (IJR) holding above its 200-day SMA in March. SPY broke its 200-day in March, which means IJR showed relative strength at the time. Most recently, IJR moved to new highs this week, even as SPY corrected. Small-caps are leading large-caps.
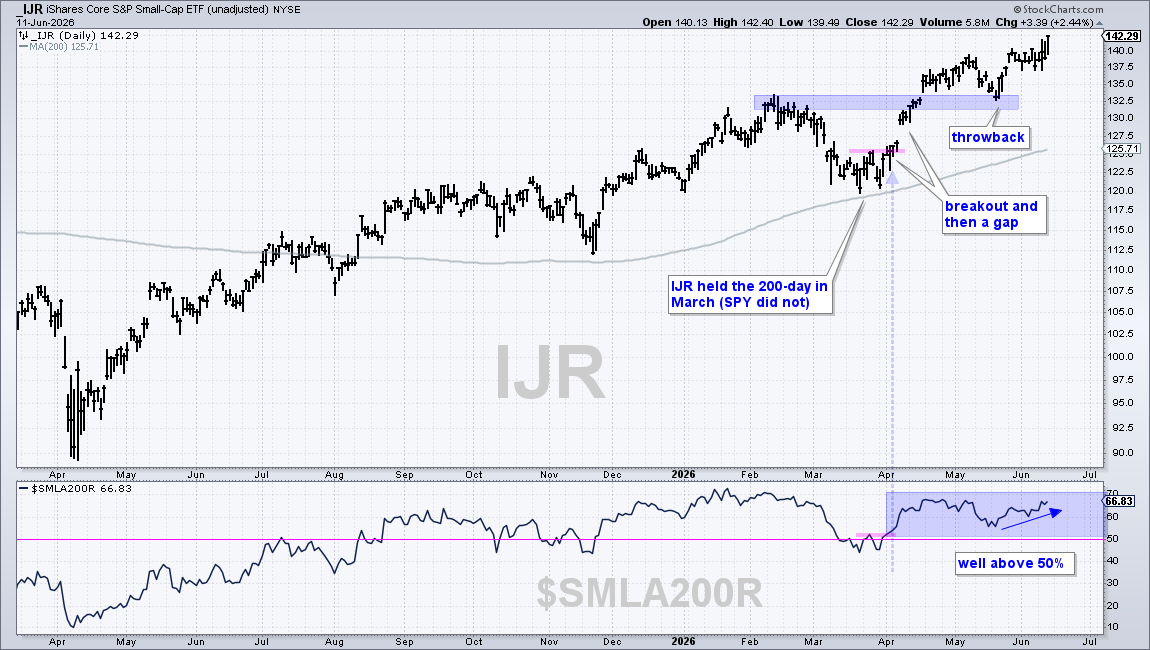
The indicator window confirms relative strength within small-caps. S&P SmallCap %Above 200-day SMA ($SMLA200R) is above 65% and higher than SPX %Above 200-day SMA. More small-caps are in long-term uptrends than large-caps.
Note that TrendInvestorPro was focused on small-caps and mid-caps in late March and early April because they were holding up better than large-caps and setting up better.
Industrials Set Up with Consolidation Above Breakout
The Industrials SPDR (XLI) remains in bull mode with a long-term uptrend, a valid breakout in April, and bullish breadth. XLI is above the rising 200-day SMA and within 2.5% of a new high. It broke out with a gap-surge in early April; this breakout is holding (blue shading).
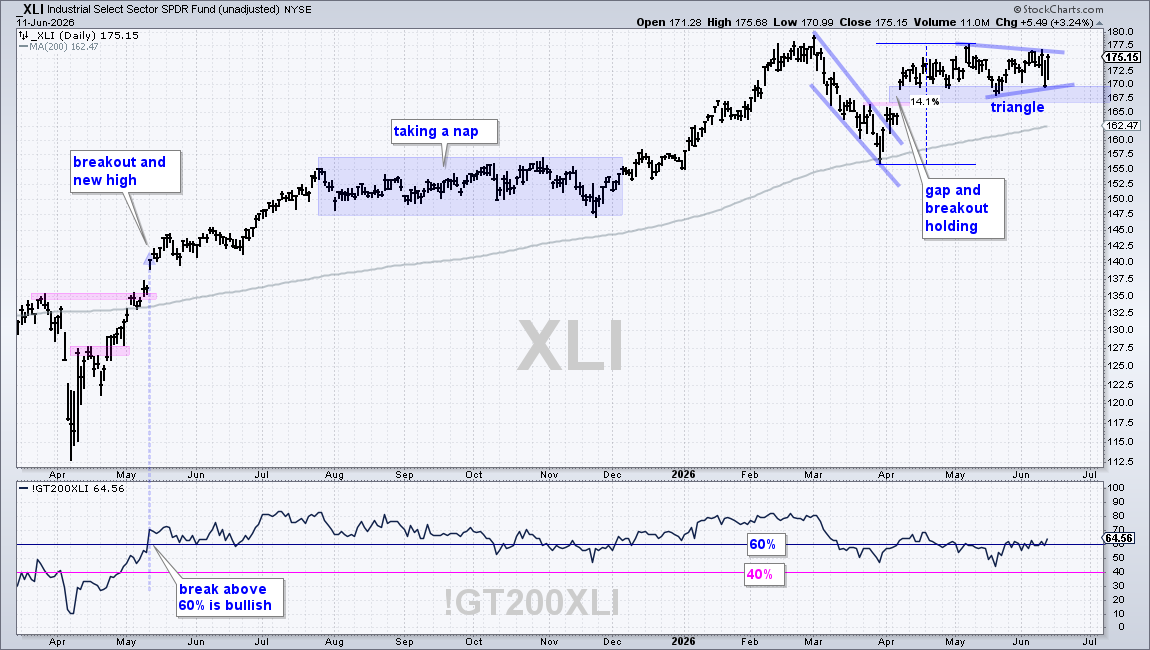
Even though the ETF has yet to follow through on the breakout, the breakout has yet to be proven otherwise. Moreover, XLI is consolidating with a triangle, which I view as a bullish continuation pattern that represents a rest after the 14% advance. A breakout at 177.5 would signal a continuation higher and open the door to new highs. A close below 167 would fill the gap and argue for a re-evaluation.
The indicator window shows XLI %Above 200-day EMA (!GT200XLI). I used 60% and 40% for bullish and bearish signal thresholds. A move above 60% is bullish and this signal remains valid until a move below 40%, which is bearish. !GT200XLI signaled bullish on May 12th and has yet to reverse this signal. Currently, 64.56% of industrial stocks are above their 200-day EMAs and in long-term uptrends.