StockCharts Insider: The Zweig Signals, Hindenburg Omen, and 100+ Indicators You've Probably Overlooked
Before We Dive In…
There’s a lesser-known group of indicators most traders have never heard of. Around 122 of them. They track opportunities and risks in ways that most others don’t. And they do it in binary. Yes or no. On or off. There’s no in-between.
You know the Hindenburg Omen. That's one of them. Some will matter to you. Some won't. But a few may change how you read the market. They're hidden in plain sight. Stashed in a corner of the platform that’s easy to miss. I'll show you where to find them. What you do with them is up to you.
Binary Breadth Signals: It’s On or Off
How often do you come across this?: “The indicator might be giving a warning.” “A signal is about to trigger soon.” “It’s looking bullish/bearish, but we’ll have to wait.”
That’s how most indicators are designed. Nothing wrong with that. It’s normal. It’s what we’re used to.
But few are designed to give a binary signal. They’re called NBD indicators. Short for Normalized Binary Digital. It’s +1, or -1. Switch is on or off. A condition’s happening or it’s not.
NBD’s don't always translate to buy or sell. They don’t pinpoint when to trade. But they do provide crucial context. Context frames the trade. And just maybe, it’s the kind of insight you need before pulling the trigger. Or holding off.
Thrust Signals - Explosive Conditions, Dramatic Moves
Thrust signals are rare. When they flash “on,” they’re saying something important. The category draws its name from a handful of indicators developed by Martin Zweig, though others have been added to the group.
A classic example is the Zweig Breadth Thrust indicator: !BINYBTD
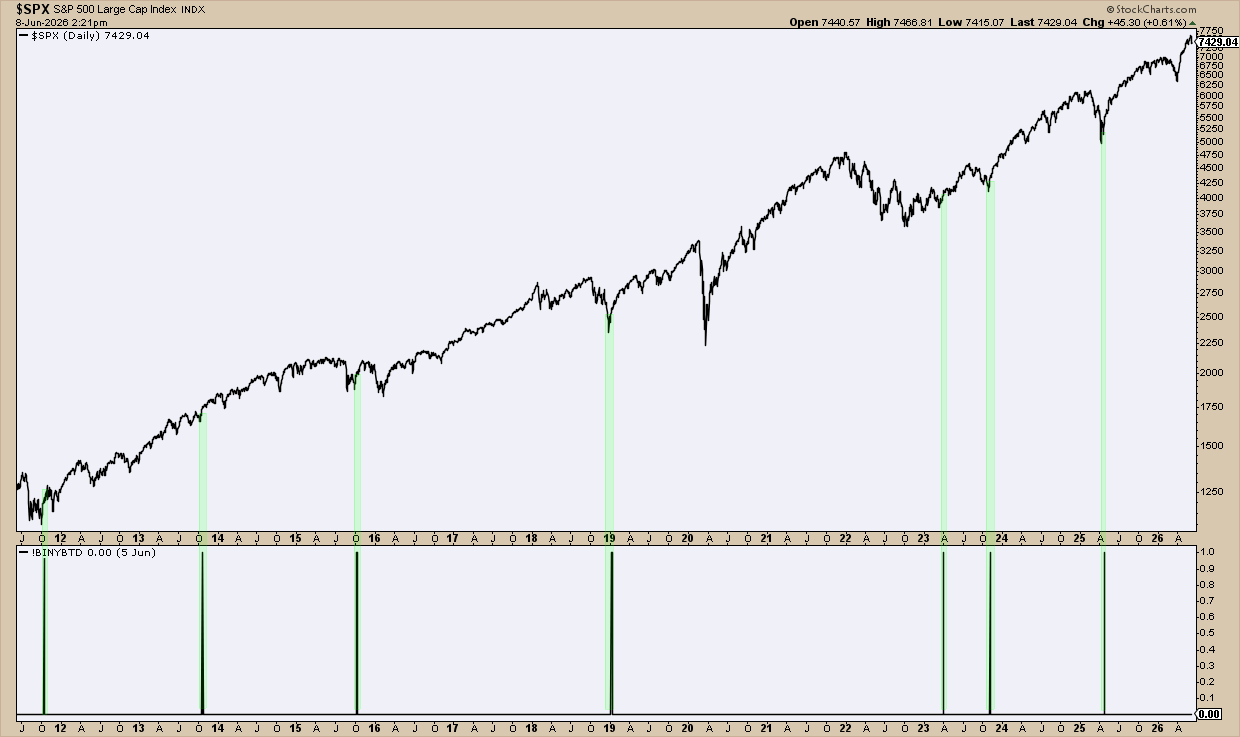
FIGURE 1. S&P 500 INDEX WITH ZWEIG BREADTH THRUST INDICATOR.
The Zweig Breadth Thrust indicator is designed to signal the start of a new bull run. Look how infrequently these signals show up. They often catch bottoms. Sometimes they don’t. But in most cases the signals are pretty accurate.
Another famous Zweig indicator is the Zweig Double 9 Up Volume Ratio: !BINYZD9UDVRD. It’s similar to the one we just saw. But it takes a different angle. When the total volume of stocks moving up is at least 9 times greater than the total volume of stocks moving down, it gives a signal. Take a look.
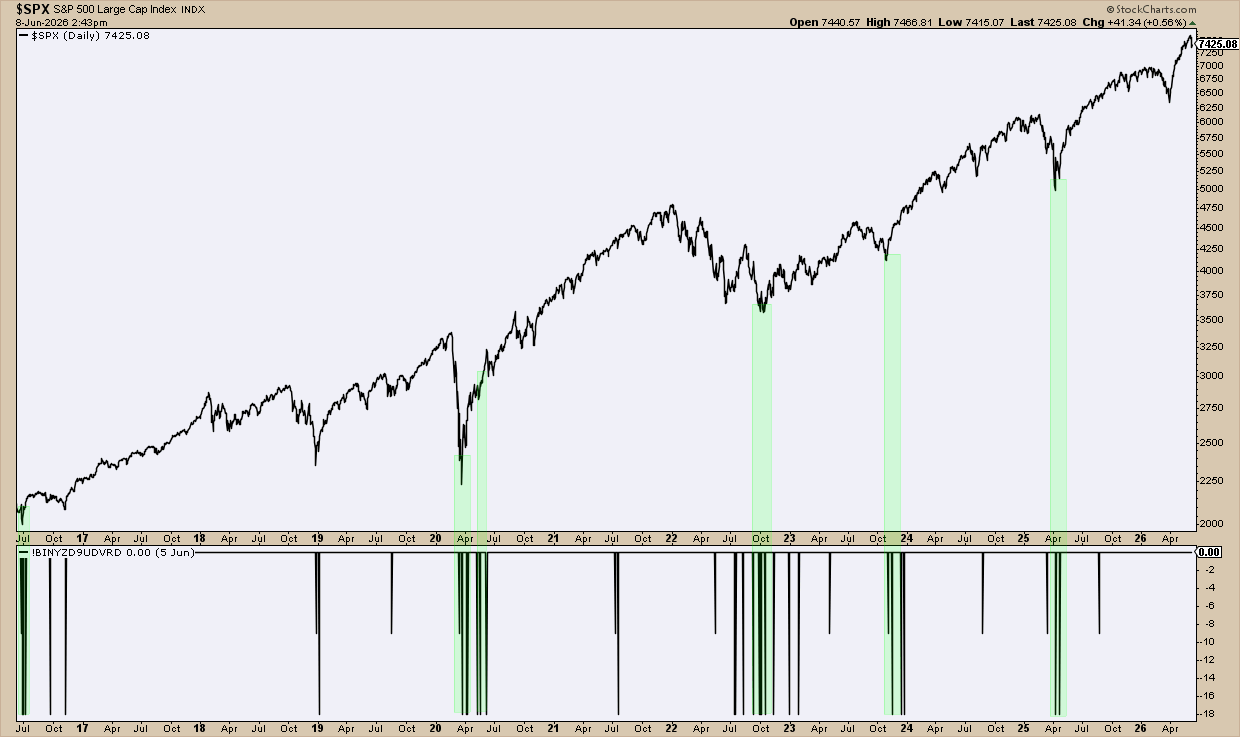
FIGURE 2. DAILY CHART OF S&P 500 INDEX WITH ZWEIG DOUBLE 9 UP RATIO.
Here I highlighted clustered signals. You can see for yourself the outcomes of each reading.
Here are a few more I’ve handpicked. Check them out for yourself:
- !BINYBTCD—Breadth Thrust Continuation - Digital Signal
- !BINYPTD—Panic Thrust - Digital Signal
- !BINYZUDVRD—Zweig Up Volume Indicator
- !BINYZD9DUVRD—Zweig Double 9 Down Volume Ratio
There are plenty more. Not all were developed by Zweig. But they operate on similar principles.
Bear Warnings
Around half of these NBD indicators are directionally neutral. They can signal bearish or bullish depending on the way they flip. But some are dedicatedly bearish, and a few famously so.
Take the Hindenburg Omen indicator: !BINYHOD
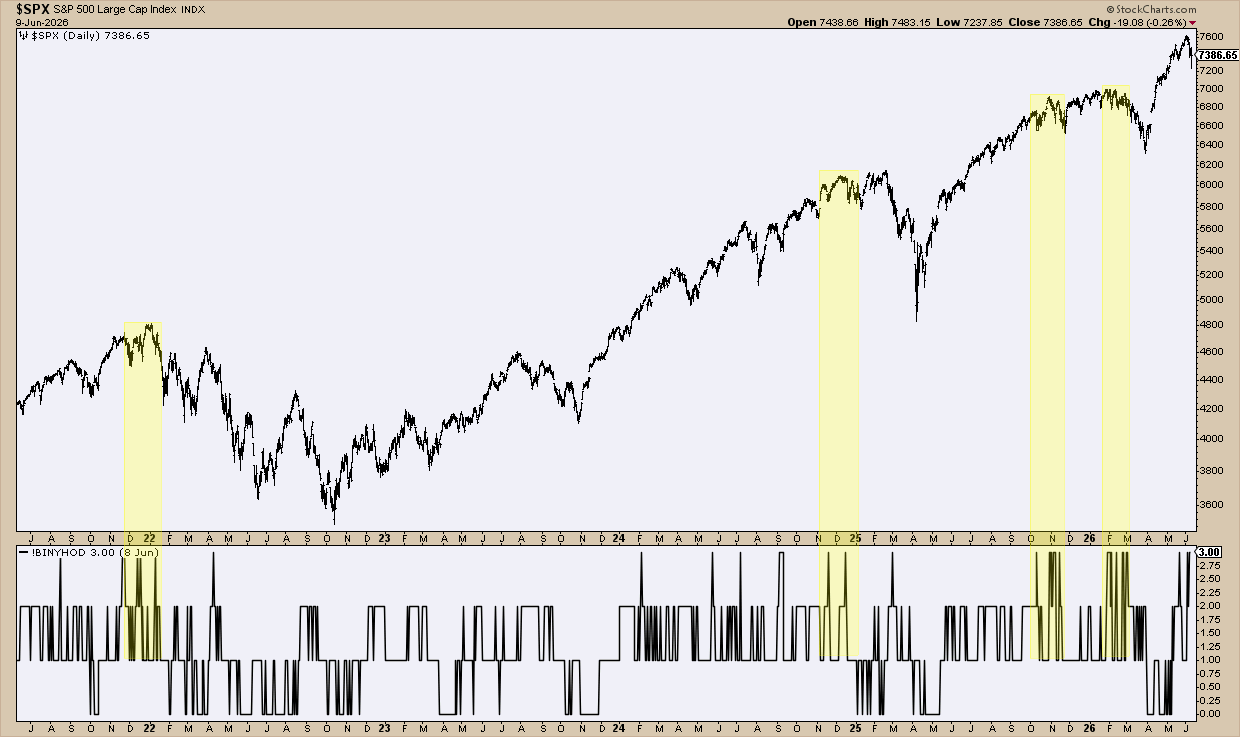
FIGURE 3. DAILY CHART OF S&P 500 INDEX WITH THE HINDENBURG OMEN INDICATOR
See the clustered areas highlighted in yellow? That tells you where risk levels were concentrated. They also preceded declines of varying depth.
Compare this to another indicator that today is even lesser known, the Titanic Syndrome !BINYTS1988D developed by market analyst Bill Ohama in the 1960s. This one’s designed to call market tops.
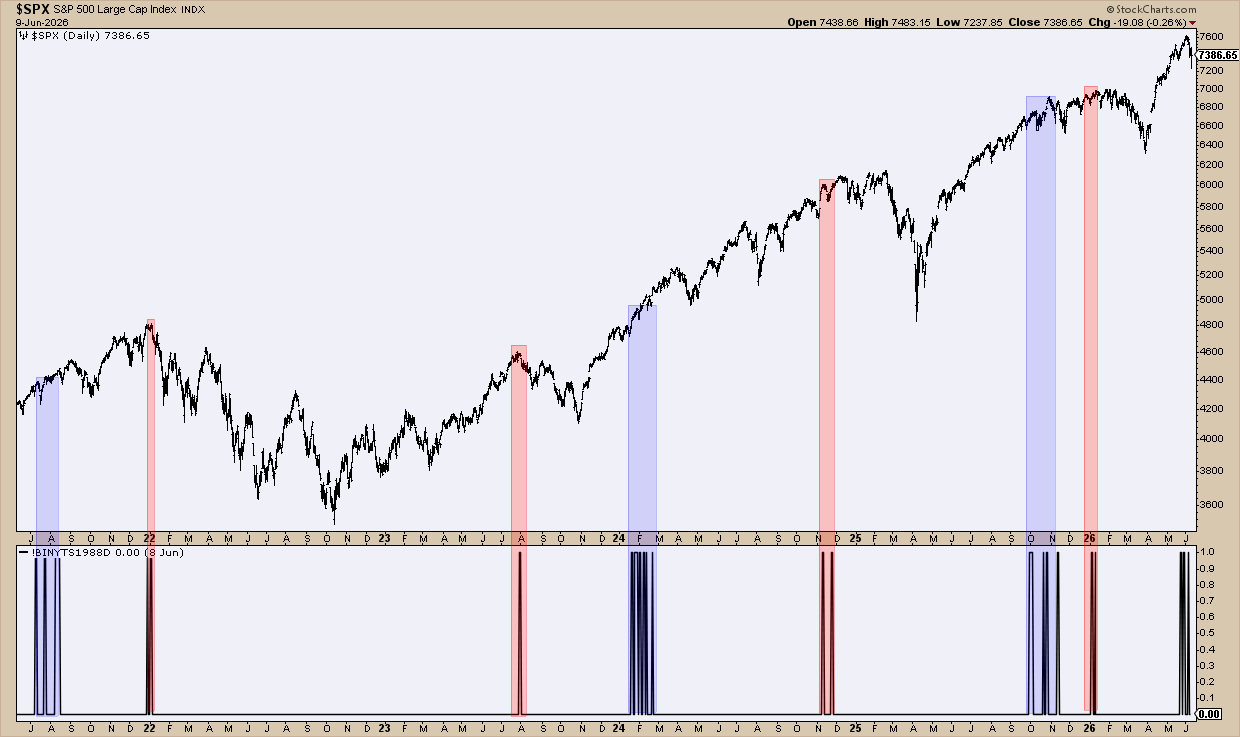
FIGURE 4. DAILY CHART OF S&P 500 INDEX WITH THE TITANIC SYNDROME INDICATOR
The signals highlighted red are followed by some degree of decline. The timing varies. So, remember. Context, not timing tool. The signals highlighted blue head weaker outcomes. Again, that’s subjective. It’s my take. But it’s pretty evident from the chart.
These are only two of the bearish indicators in the group. You’ll want to check out the others. For the sake of example, here are a few more:
- !BINYESOBD—Eliades Sign of the Bear (“bear” is literally in the title)
- !BINYZD9DUVRD—Zweig Double 9 Down Volume Ratio (signals downside volume extreme)
- !BINYDNI—Dysart Negative Issues (tracks negative or declining breadth)
- !BINYHTTSDW—Haller Trend Sells - Weekly (an explicit sell signal)
I typically don’t do this, but there are so many indicators in this group that I’m just going to give you some highlights and throw a bunch at you to check out at your own pace.
Indicator Families Worth Exploring
The vault goes deeper. Five pages deep. Each indicator is a unique measure. We can't cover even a fraction of it in one piece. But some indicator families stand apart.
The McClellan Binary Derivatives: !BINYMSIM, !BINYMSIS, !BINYMCOM, !BINYMCSM.
You know the McClellan Oscillator. Most traders do. But many don't know it has binary derivatives. A defined threshold is either crossed or it isn't. +1 or 0. These four convert it into a clean signal.
The High-Low Crossover Signals: !BINYHLXD, !BINYHLX10D, !BINYNHVD, !BINYNLVD, !BINYHLPTDW.
A stock either made a new 52-week high today or it didn't. Binary by nature. When new highs cross above new lows, leadership has likely shifted. Some of these simply track when new highs outnumber new lows. Others suggest whether that shift is meaningful or just noise.
The Zahorchak Method: !BINYZMD, !BINYZMDW, !BINYZM2D, !BINYZM2DW.
You’ve got four variants. Plus, an alternate version of each. Same rules-based approach to advance-decline data. Different timeframes. Daily. Weekly. So, pick your lens.
The Composite Tape Index: !BINYCTIS, !BINYCTIM, !BINYCTIL.
Three signals. Three timeframes (short, medium, and long-term). When all three flip to +1, it might be time to act.
The Haller Signals: !BINYHTBBDW, !BINYHTTBDW, !BINYHTTSDW.
These cover bottom buys, trend buys, trend sells, etc. Each maps a different phase of the market cycle. Together they piece together a more comprehensive story.
The TRIN Binary Family: !BINYTRIN10, !BINYWTRIN10, !BINYBTRIN5, !BINYBTRIN5I, !BINYAI265.
Five variants of the Arms Index converted to threshold-based signals. When selling pressure hits the extreme, these flip. And when several generate signals at once? Well, you’ll have to check it out to see what happens next.
Where to Find These On StockCharts
I’ll just give you the link: Click here for the index catalog. Type in !BINY in the symbol search text box and press Search.
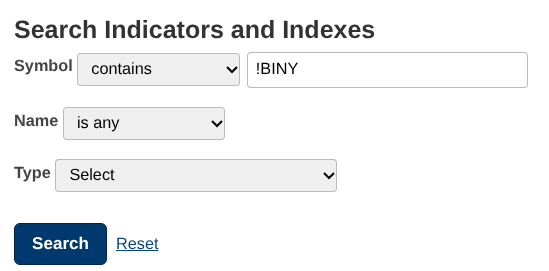
Once you do that, five pages of !BINY indicators should pop up.
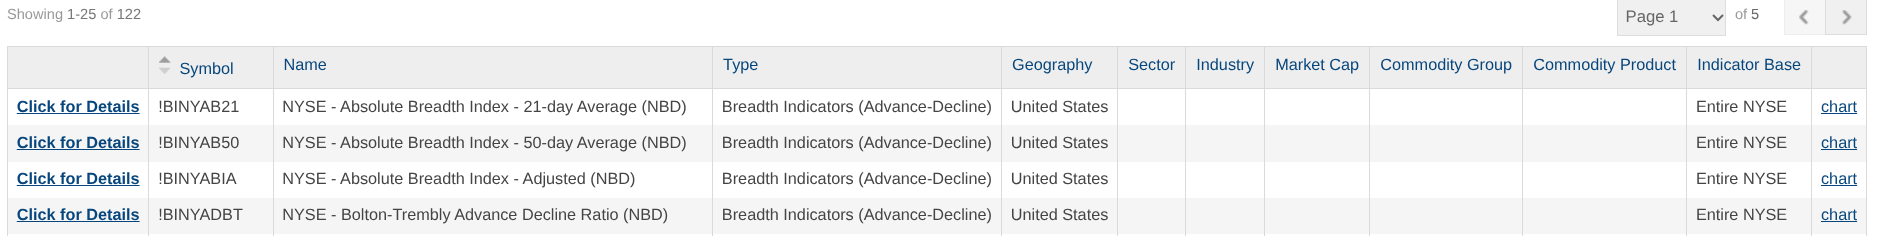
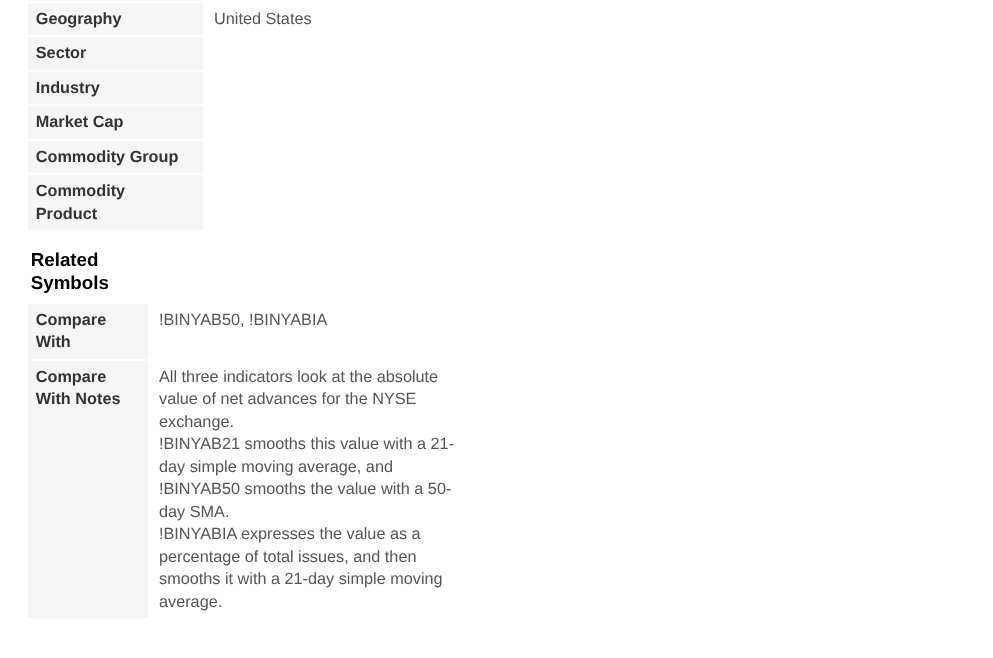
Select “Click for Details” to get a description of what the indicator does. For example, here’s the description for the first indicator, !BINYAB21 NYSE - Absolute Breadth Index - 21-day Average (NBD).
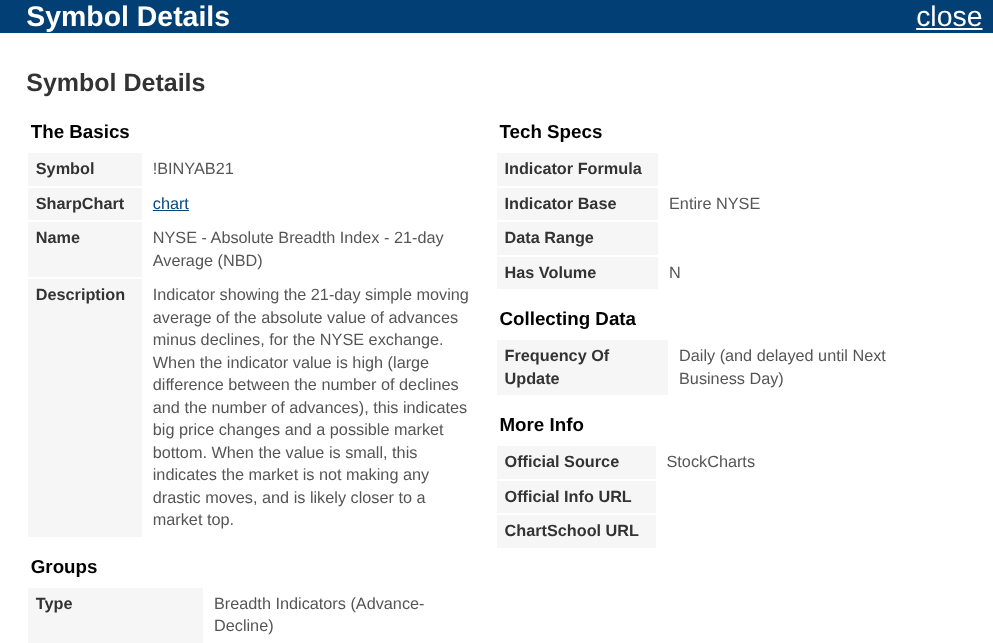
There are 122 of them in total. The more popular ones like the Hindenburg Omen have ChartSchool entries. That's a good place to start. But most don't. So if you think there's a hidden advantage here, expect some research and experimentation on your end.
And That’s a Wrap
One hundred and twenty-two indicators. Some will be useful. Some won't fit your style. But a few might completely change how you engage the market. Just remember that these aren’t buy and sell signals. They provide context. But it's a context that many traders don’t see. That can be an advantage.