Week Ahead: MSCI Rebalance Inflicts Technical Damage; Drags Resistance Down To These Levels

The market traded in a volatile and largely range-bound manner throughout the week before ending with a modest loss. The Nifty ($NIFTY) oscillated in a 605-point range, registering a high of 24,089.80 and a low of 23,484.75 before settling near the lower end of the weekly range. Friday's sharp decline was largely driven by MSCI rebalancing-related flows, which resulted in accelerated profit-taking and a weak close for the week. India VIX rose by 9.60% to 16.19. This reflects a pickup in volatility expectations and some increase in market nervousness following the late-week selloff. Nifty ended the week with a loss of 171.55 points (-0.72%).
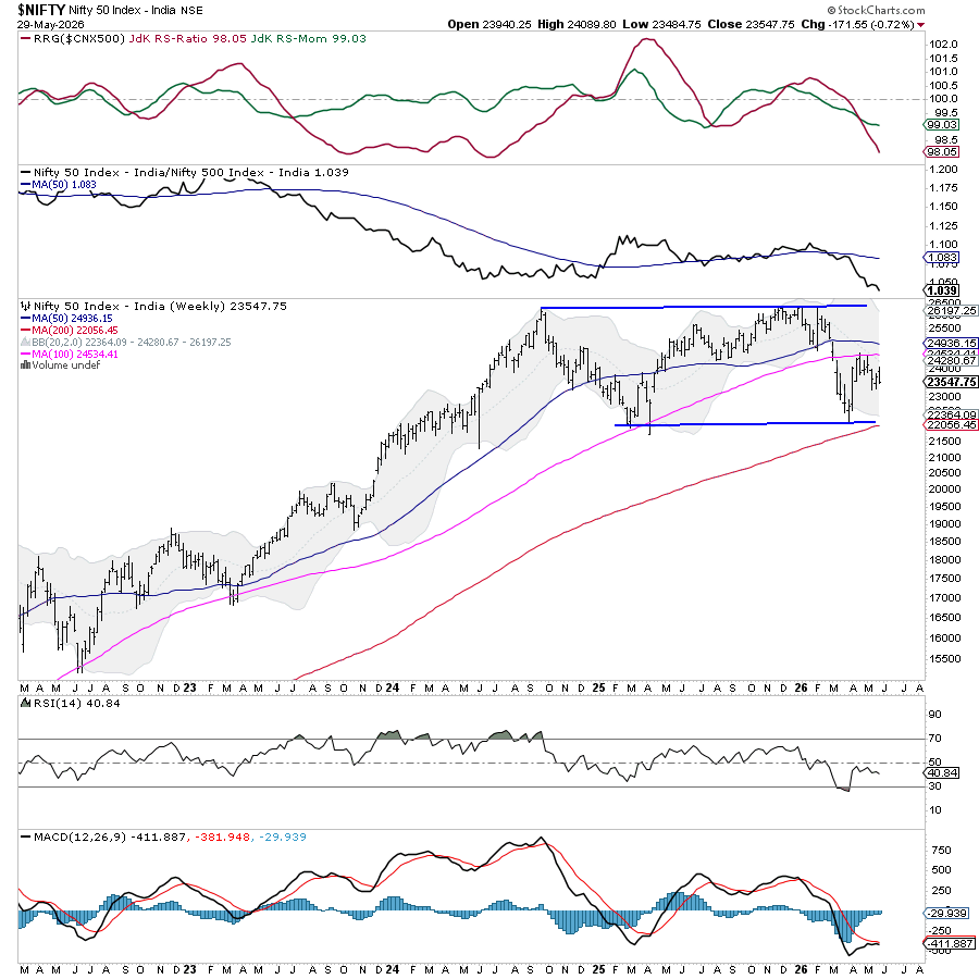
The broader technical structure remains in a consolidation phase. However, the sharp selloff towards the end of the week has once again dragged the immediate resistance levels lower, with the 23,800 zone emerging as the first significant hurdle that the index must overcome. As long as Nifty remains below this level, the ongoing consolidation is likely to continue.
On the downside, the index continues to hold above the lower boundary with the support zone placed in the 23,300–23,400 area. A decisive move beyond either end of this range could set the tone for the next directional move.
The Nifty is likely to begin the coming week on a cautious note after Friday's sharp decline. Immediate resistance levels are at 23,800 and 24,000, while support levels come in at 23,350 and 23,100. A sustained move above 23,800 would improve the near-term technical outlook and may trigger fresh buying interest. Conversely, a violation of the 23,300 area could invite renewed weakness and increase downside pressure.
The weekly Relative Strength Index (RSI) stands at 40.84, below the neutral 50 mark. This indicates subdued momentum and shows no divergence against price. The weekly Moving Average Convergence/Divergence (MACD) is below its signal line and in negative territory, reflecting a lack of strong upward momentum.
A study of the overall pattern shows that Nifty continues to trade within a consolidation beneath a key supply area. The index remains below its 50- and 100-week moving averages, which are near 24,936 and 24,535, respectively. This indicates that the intermediate trend has yet to regain full strength. At the same time, the index is comfortably above its rising 200-week moving average near 22,057, keeping the long-term structure intact. The ongoing compression between channel support and overhead resistance suggests the market may be approaching a decisive phase, and a directional breakout could emerge over the coming weeks.
Given the current technical setup, traders should continue to maintain a balanced and selective approach. The rise in India VIX together with the failure to sustain higher levels warrants caution, especially near overhead resistance. Fresh buying should remain stock-specific and focused on pockets displaying relative strength.
Traders would be better served by protecting gains, maintaining disciplined risk management, and avoiding aggressive directional bets until the index confirms strength by moving above 23,800. The coming week is likely to reward selectivity and prudent positioning rather than broad-based aggressive exposure.
Sector Analysis for the Coming Week
In our look at Relative Rotation Graphs®, we compared various sectors against the CNX500 (NIFTY 500 Index), representing over 95% of the free-float market cap of all listed stocks.
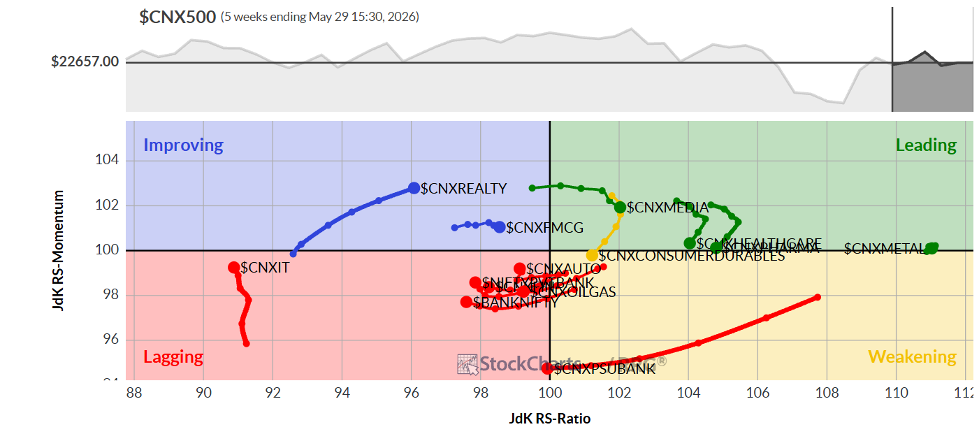
The Relative Rotation Graph (RRG) shows that the Nifty Midcap 100, Energy, Media, Pharma, and Metal Indices are inside the leading quadrant. While the Pharma and Energy groups are showing a slowdown in their relative momentum, overall, these groups are likely to relatively outperform the broader markets.
The Nifty Infrastructure and PSE Indices are inside the weakening quadrant. Collectively speaking, these groups may see a slowdown in their relative performance against the broader markets.
The PSU Bank Index has rolled inside the lagging quadrant. The Nifty Bank, Services Sector, Financial Services, and Auto Indices also continue to languish inside the lagging quadrant. These groups are set to relatively underperform the broader markets. The Nifty IT Index is also in the lagging quadrant. However, it is showing a sharp improvement in relative momentum against the broader Nifty 500 Index.
The FMCG and the Realty Index are inside the improving quadrant; they may continue to improve their relative performance against the benchmark.
Important Note: RRG™ charts show the relative strength and momentum of a group of stocks. In the above Chart, they show relative performance against the NIFTY500 Index (Broader Markets) and should not be used directly as buy or sell signals.
Milan Vaishnav, CMT, MSTA
Consulting Technical Analyst
www.EquityResearch.asia | www.ChartWizard.ae