The Best Five Sectors This Week #67
Key Takeaways
- Energy leads the ranking but shows signs of consolidation, with RS-ratio keeping it in the weakening quadrant.
- Technology dominates weekly and daily RRGs, maintaining strong upward momentum with no signs of weakness.
- Consumer Staples moves into the lagging quadrant, while Materials and Industrials show fragile rotations in the weakening quadrant.
- Cap-weighted portfolio performance improves, narrowing its lag behind the S&P 500, driven by technology sector strength.
Technology Leads, Consumer Staples Climb
I blame travel and jet lag for the delay ;)
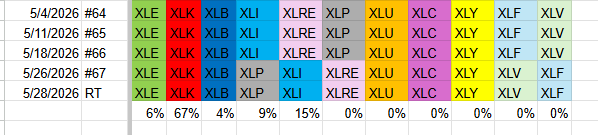
At the end of last week (ending 5/22), there were a few changes in the composition of the portfolio and the ranking of the sectors.
In the Top 5, Energy continues to lead, followed by Technology in second place. Materials hold on to third, while Consumer Staples jumped from sixth to fourth, pushing Industrials down to fifth and Real Estate to sixth.
In the lower half of the ranking, Utilities remain stable at seventh. Communication Services and Consumer Discretionary hold steady at eighth and ninth. At the bottom, Healthcare and Financials swapped places, with Health Care now at tenth and Financials at the bottom (11).
The entry of Consumer Staples, a sector larger than Real Estate by market capitalization, has reduced Technology’s sector weight from 71% to 67%.
- (1) Energy - XLE [6%]
- (2) Technology - XLK [67%]
- (3) Materials - XLB [4%]
- (6) Consumer Staples - XLP[9%]*
- (4) Industrials - XLI [15%]*
- (5) Real Estate - XLRE*
- (7) Utilities - XLU
- (8) Communication Services - XLC
- (9) Consumer Discretionary - XLY
- (11) Health Care - XLV*
- (10) Financials - XLF*
Weekly RRG
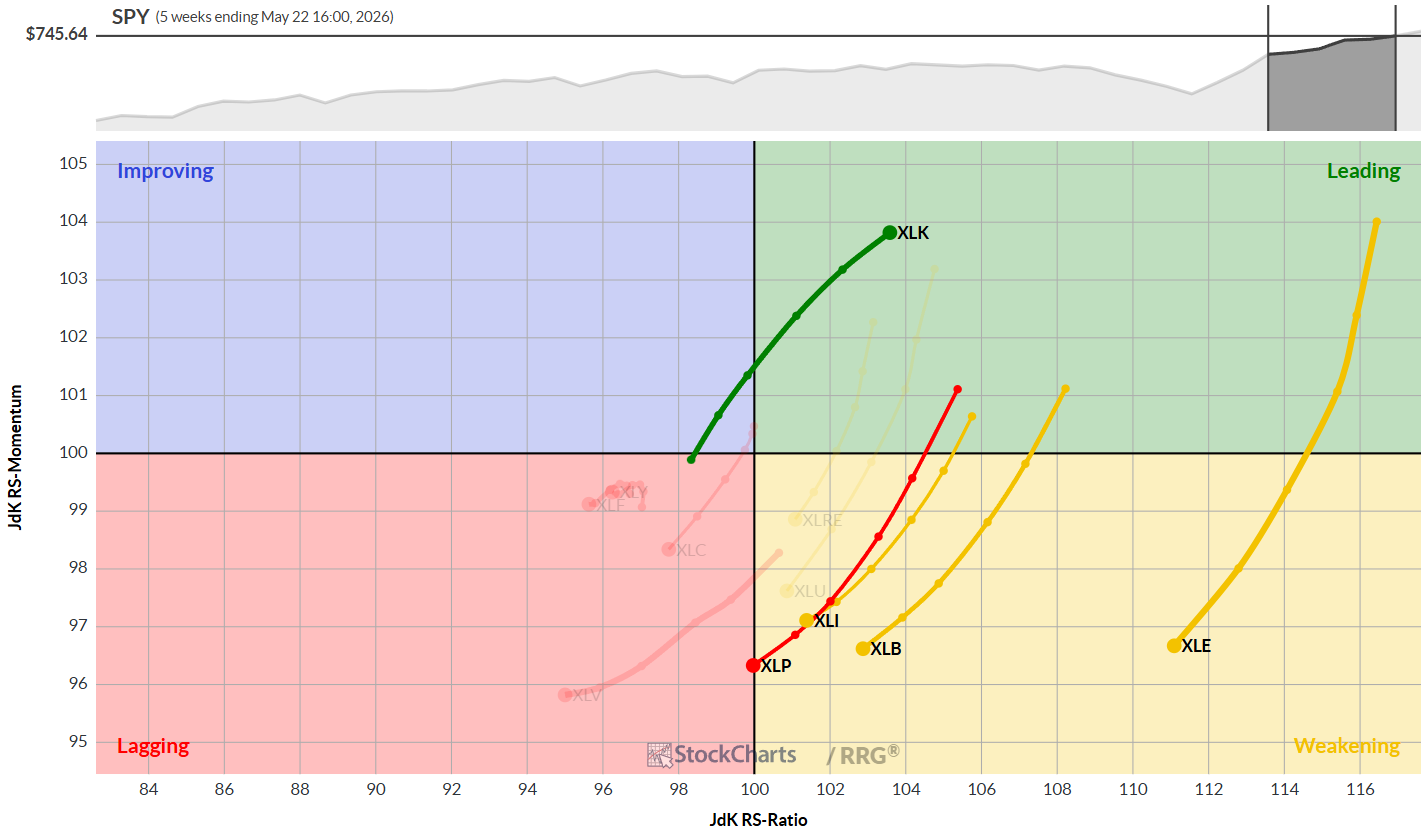
The weekly RRG continues to be dominated by the Technology sector, which is the only sector inside the leading quadrant and maintaining a strong heading.
The other top five sectors are all in the weakening quadrant and moving at a negative heading, except for Consumer Staples, which is shifting into the lagging quadrant. Energy remains the highest-ranked sector based on RS-ratio.
Daily RRG
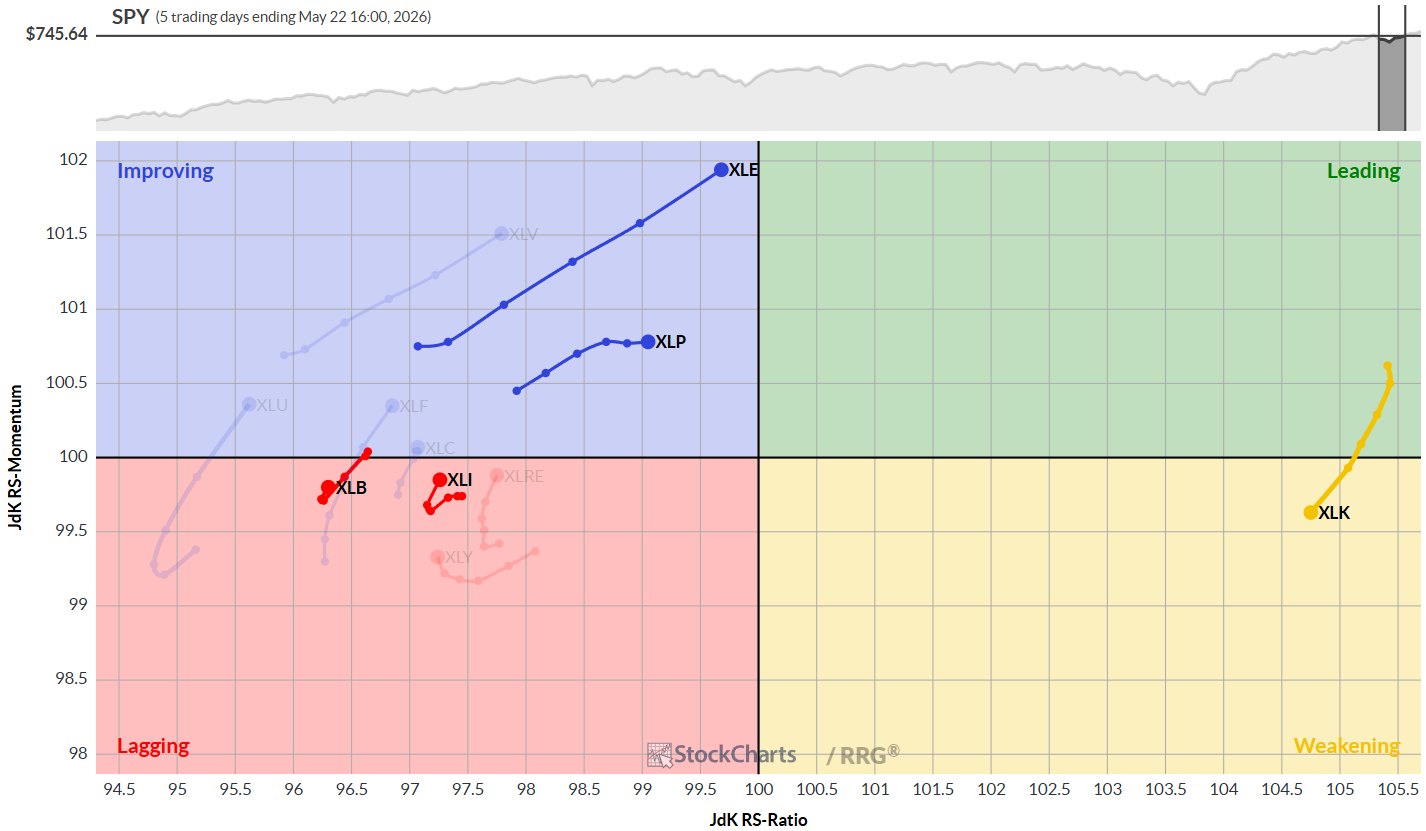
The daily RRG confirms Technology’s dominance, with the sector far to the right at the highest RS-ratio reading. All other sectors are on the left side of the graph. Energy and Consumer Staples are inside the improving quadrant, traveling at a strong heading, which supports their weekly strength. Materials and Industrials are in the lagging quadrant with short tails, indicating a stable relative downtrend and making it difficult for these sectors to support a reversal on the weekly chart.
Sector Highlights
Energy
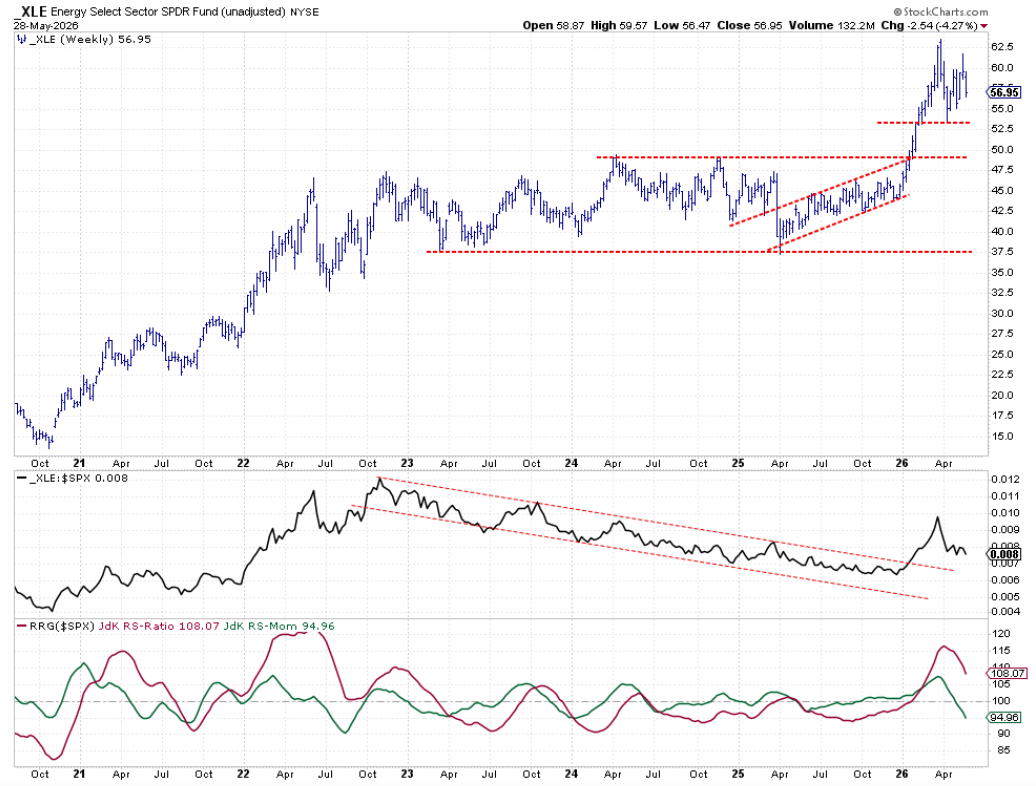
The Energy sector’s price chart remains strong, though it appears to be entering a consolidation phase after breaking out of its trading range. Relative strength is holding up, but a new higher low would be ideal to continue the rally. Currently, both RRG lines are moving lower, but the RS-ratio remains high, keeping Energy in the weakening quadrant.
Technology
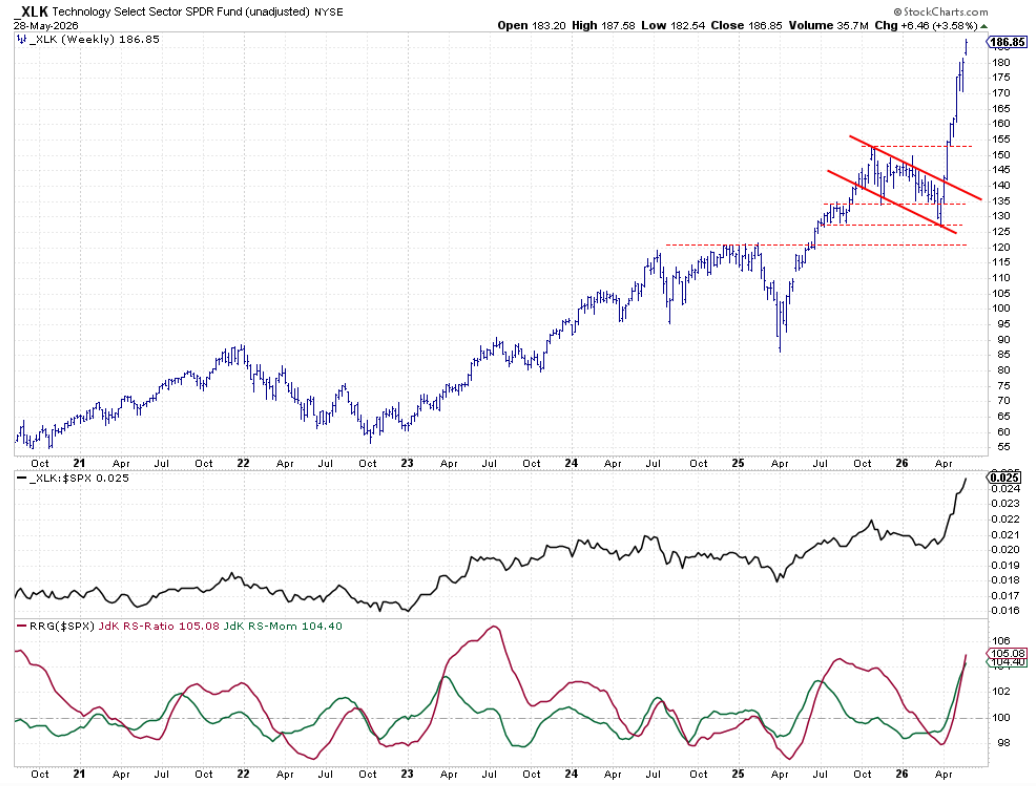
Technology continues to show an extraordinary rally, pushing ever higher. As the saying goes, it’s not safe to jump in front of a freight train, and that applies here. While the rally is steep and arguably overstretched, there’s no sign of weakness, and both price and relative charts are moving higher. The RRG lines are steeply rising, with no indication of a slowdown.
Materials
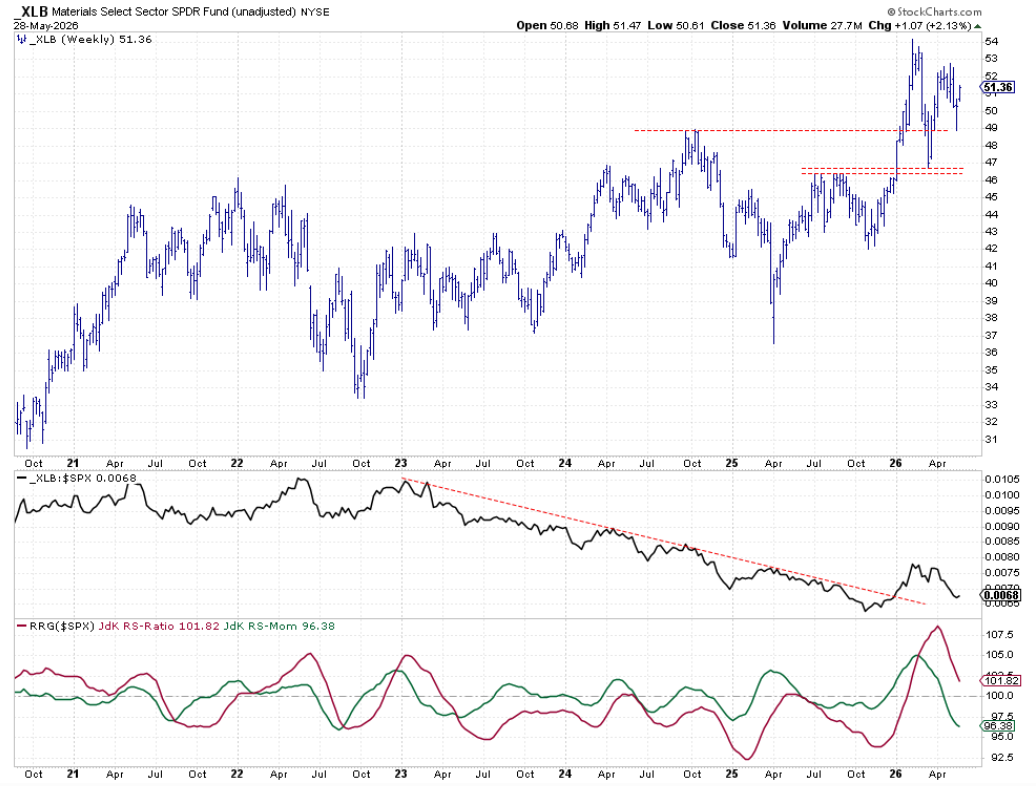
Materials are holding up after their breakout but are now moving sideways, entering a consolidation pattern. The raw RS line has formed a small double top; ideally, a new low around current levels would help keep Materials on the right side of the graph. For now, both RRG lines are moving lower, but the RS-ratio remains above 100, so the sector stays in the weakening quadrant.
Consumer Staples
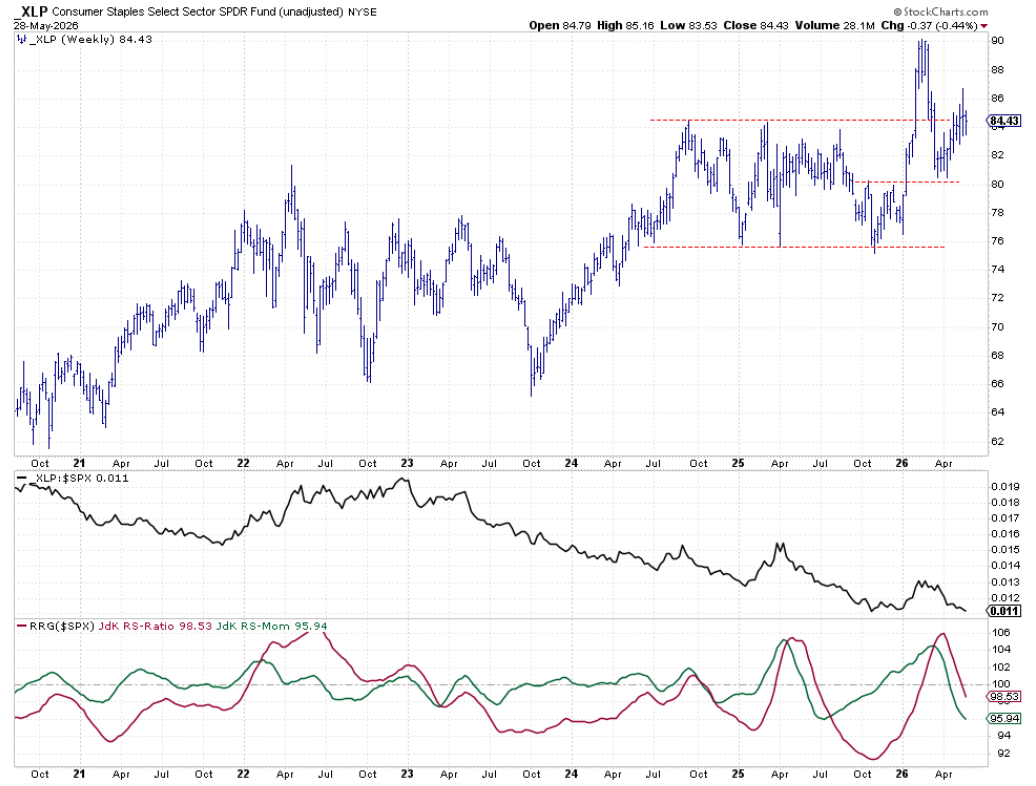
After breaking out and then dropping back below the former breakout level, Consumer Staples found support and is now testing resistance around the 85 area. Raw relative strength is near previous lows, which could offer support, but it’s too early to tell. Both RRG lines are below 100 and moving lower, placing this sector in the lagging quadrant.
Industrials
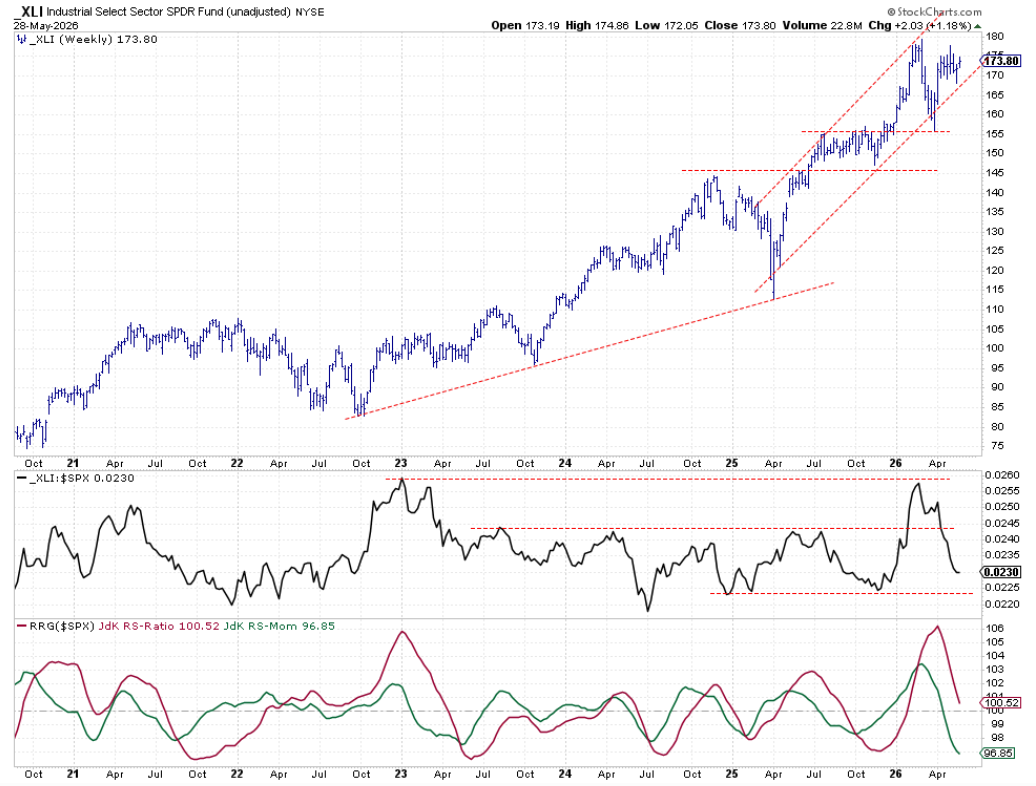
Industrials continue to move sideways within a rising channel. The raw RS line is trending lower after testing the 2023 high, and we may see a test of relative support at the lows set in 2025. Both RRG lines are moving lower, keeping the sector in the weakening quadrant.
Portfolio Performance
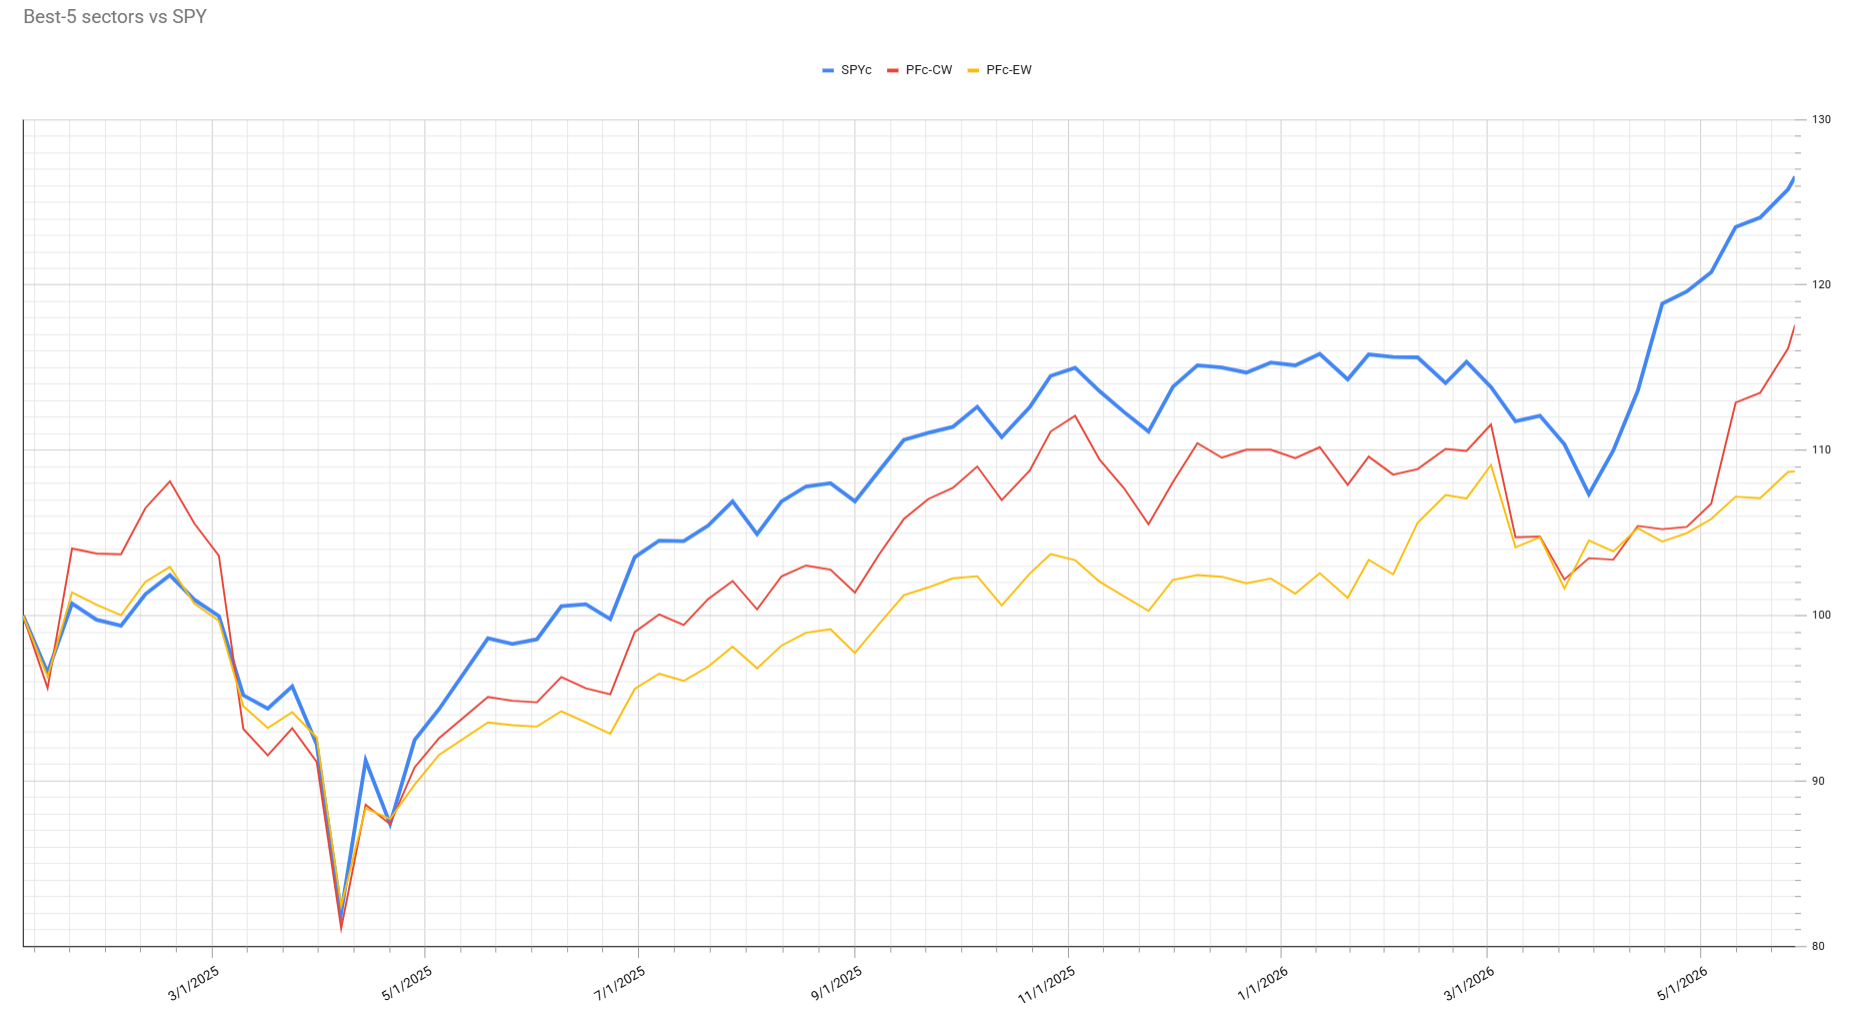
The cap-weighted portfolio is rapidly catching up with the S&P 500. Over the past five to six weeks, its lag has narrowed from over 14% to under 9%. This improvement is largely due to the continued strength of the Technology sector. While ongoing strength for this sector is needed to maintain this momentum, the outlook is gradually improving.
#StayAlert, --Julius