The Stock Market Is Broadening Out: Three Charts Make the Case

Chart 1: S&P 500 Equal-Weighted Index ($SPXEW)
For some time, the stock market's headline gains masked a deeply uneven distribution of performance, with a handful of mega-cap technology names carrying the major averages while more typical stocks lagged. More recently, AI-related stocks have dominated the new highs list while most other sectors struggled.
That dynamic appears to be changing. Three distinct breadth indicators, each measuring market health from a different angle, are now signaling that the rally is widening.
The most straightforward way to see a broadening out of participation is to strip out market-cap weighting so that each stock has an equal weight. When the S&P 500 Equal Weight Index ($SPXEW) far outpaces the cap-weighted SPX, it means the 493 non-megacap stocks are collectively outperforming. With the Equal Weighted S&P 500 now at a new high, that catch-up trade is underway.
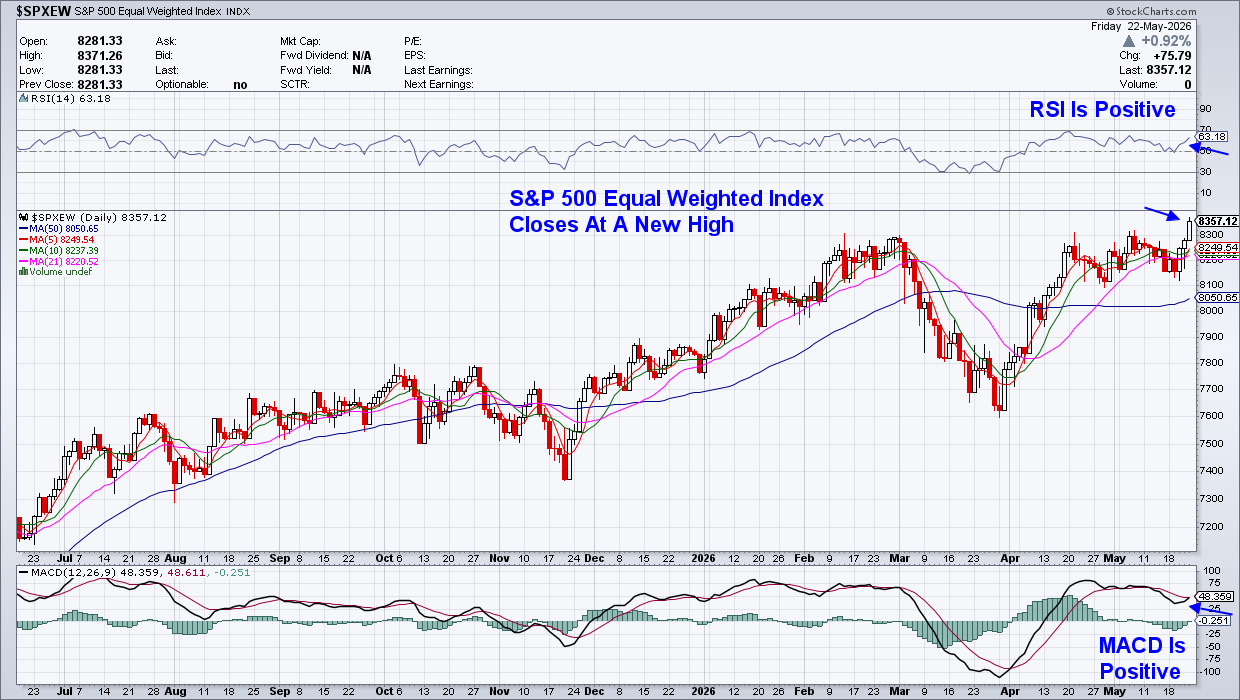
Chart 2: Percentage of S&P 500 Stocks Above 20-day Moving Average
The percentage of S&P 500 stocks trading above their 20-day moving average recently surged off deeply oversold levels, and the recovery has been broad-based across sectors rather than concentrated in a few names.
This short-term breadth oscillator captures momentum participation more dynamically than price alone. Readings above 60% confirm that stocks across the index, not just the megacaps, are reclaiming short-term uptrends. The velocity of the recovery here is the tell: this is a breadth thrust, not a gentle drift.
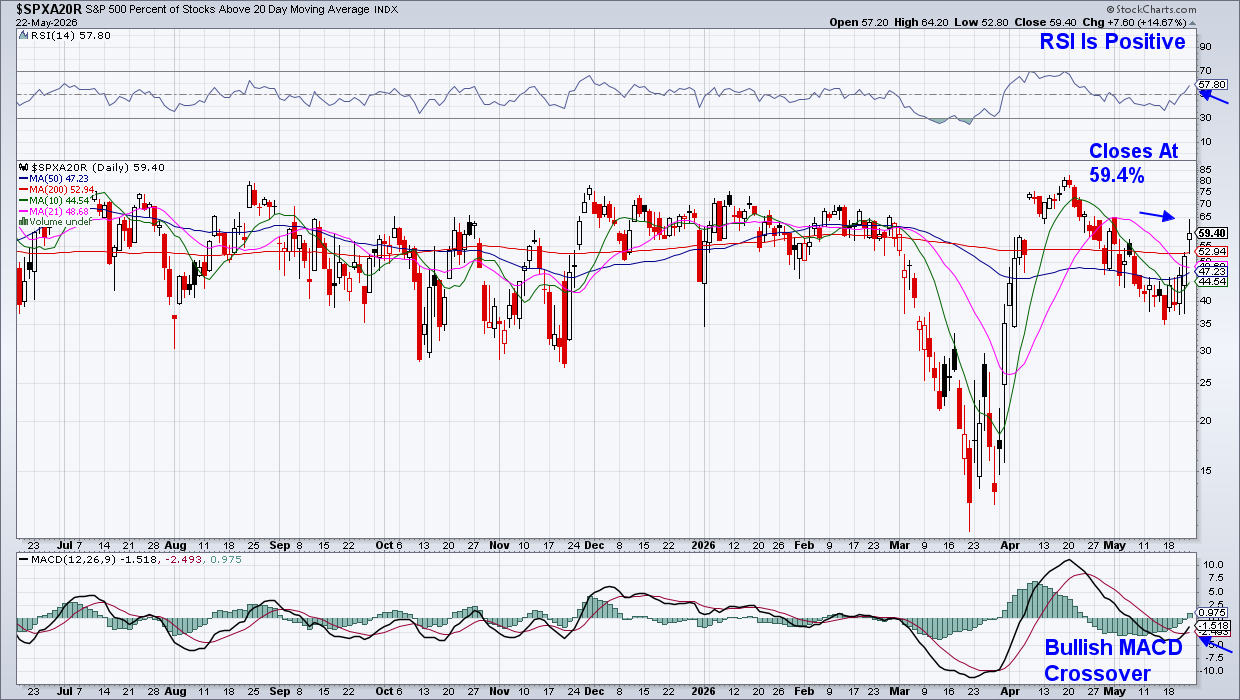
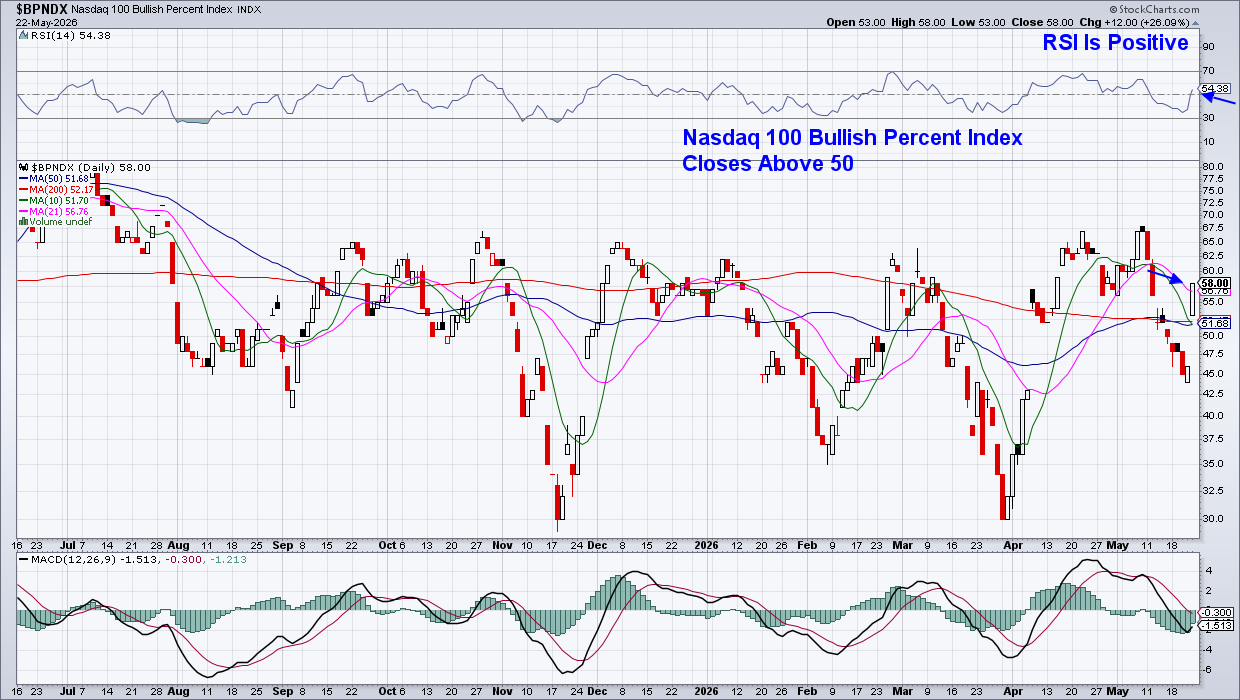
Chart 3: Nasdaq 100 Bullish Percent Index
The Bullish Percent Index (BPI) measures what percentage of stocks in an index are on Point & Figure buy signals. The methodology filters out noise and focuses purely on supply and demand. The Nasdaq 100 BPI moving from depressed levels back toward and above 50% is a structural shift, not a blip.
When the Nasdaq 100 BPI crosses back above 50%, it means most of the index's components are on active Point & Figure buy signals. That's not a prediction, but rather a measurement of the current supply/demand balance across 100 of the most widely-traded stocks in the world. That this is happening while the equal-weight index and 20-DMA breadth are also improving makes the convergence hard to ignore.
While breadth improvement tells you that participation is widening, sector rotation data tells you where the new money is flowing.
If you’d like to uncover stocks from the three sectors that have seen particularly sharp moves as the broadening has accelerated, use this link here to try my twice-weekly MEM Edge Report at no cost.
Warmly,
Mary Ellen McGonagle
MEM Investment Research