Stock Market Pullbacks Create Opportunities. This AI Tool Helps You Find Them
Did this week’s price action give you a serious case of the blahs?
It was a rough week in the stock market, especially for tech and AI-related stocks. Investors are concerned about how companies will finance those extensive infrastructure and data center buildouts. This week’s price action in CoreWeave (CRWV) reminded us of how quickly those concerns can spook the market.
CRWV plunged more than 25% for the week. That selloff spilled into technology stocks, dragging the S&P 500 ($SPX) down by 1.95% and the tech-heavy Nasdaq Composite ($COMPQ) down by 4.48% for the week. The Dow Jones Industrial Average ($INDU) managed to hold up, squeezing out a 0.67% gain.
It’s not the kind of week that leaves investors feeling optimistic. But the good news is that there can be opportunities in a market pullback. And we’ve got a new tool that makes finding those opportunities a whole lot easier.
Are you using this game-changing feature?
A Friday stock market selloff is never fun. It can leave you hanging all weekend, wondering whether the weakness will spill into the next week or whether it’s a good time to scoop up quality stocks at a discount.
Right after Friday’s close, I jumped into StockCharts Scan Workbench to create a few scans. I wanted to find stocks that were either holding up relatively well or had become oversold.
If you’ve built custom scans from scratch, you know it can take time or feel intimidating. And that’s where our new AI Scan Wizard can help. Even though we’ve made our scanning tool a lot easier to use, the Scan Wizard makes it even quicker, effortless, and fun.
Here’s how easy it is to use
I navigated to the Scans & Alerts tab, opened the Advanced Scan Workbench, and clicked the AI Wizard button in the top right corner of the Scan Components panel.
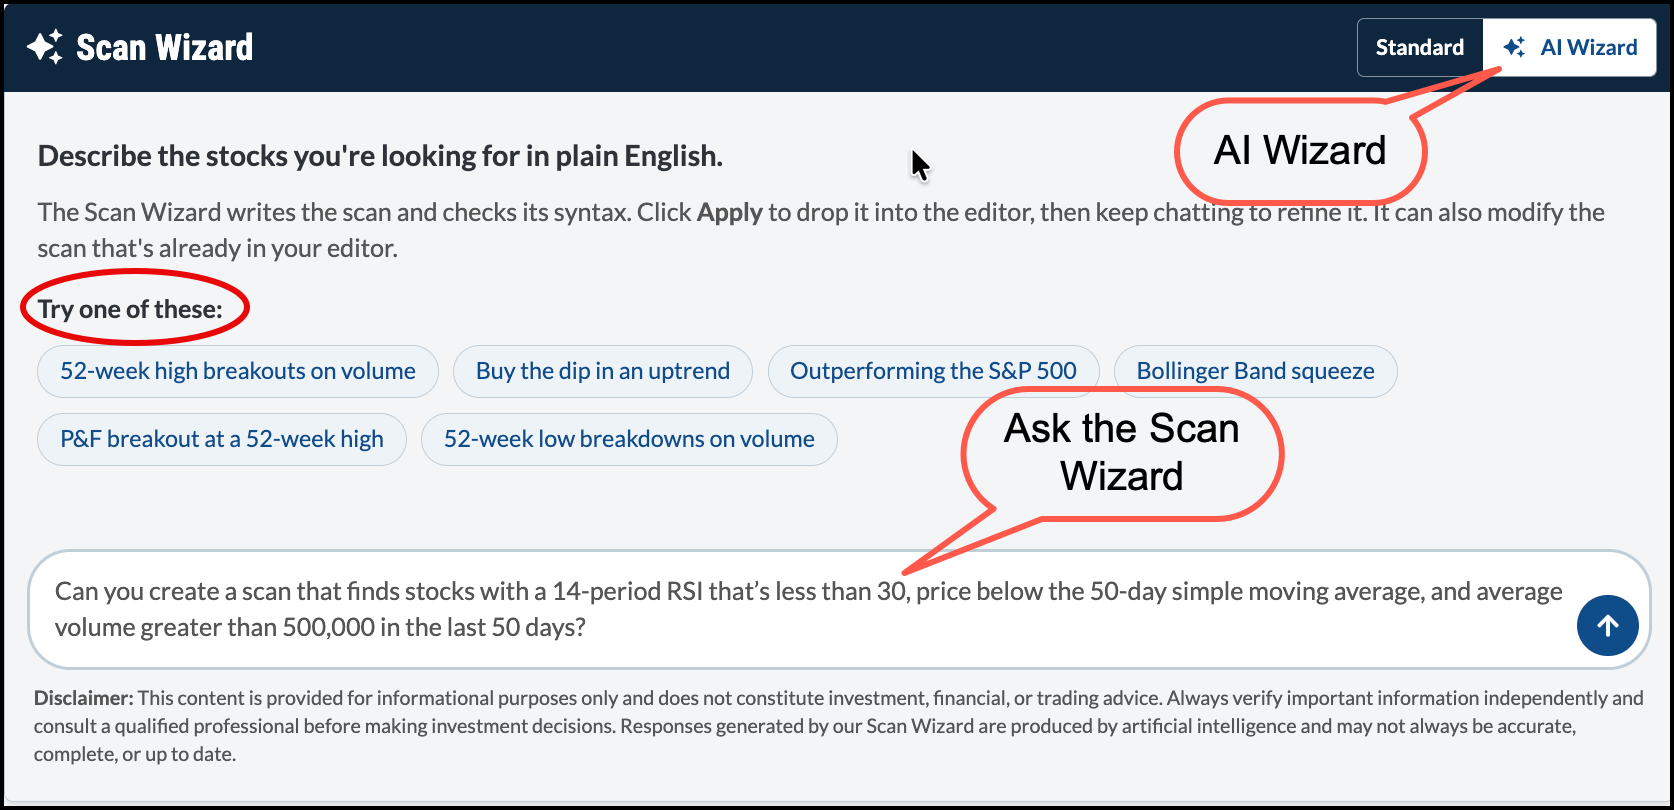
Here, I typed out a plain-English prompt: “Can you create a scan that finds stocks with a 14-period RSI that’s less than 30, price below the 50-day simple moving average, and average volume greater than 500,000 in the last 50 days?”
Within seconds, the Scan Wizard generated this code:

All I had to do was click the Apply button. The scan was copied into the editor in the Scan Criteria panel. I gave it a quick once-over, then clicked the Validate & Explain button to verify the logic. The Wizard verified the syntax and gave me a plain-English explanation of the code. And if I wanted to tweak something, I could keep chatting with the Wizard until the scan does what I want.
From one idea to 67 results
When I ran the scan, it delivered 67 stocks across large-cap, mid-cap, small-cap, and Nasdaq 100 universe. And yes, CoreWeave made the list.
What a time-saver! The possibilities are endless. You can ask the Wizard to refine your scan by specific sectors or indexes, or you can try some of our built-in scans. The “Buy the dip in a downtrend” scan might be an interesting one to explore this weekend.
If you suffer from “scanner’s block,” don’t let it hold you back. Just ask the Wizard something as simple as “Can you create a scan that looks for large-cap stocks that are significantly oversold?” and see what it comes up with.
An oversold stock doesn’t mean it’s a buying opportunity. The scan finds candidates that meet your criteria. The real value, of course, comes from analyzing the charts.
A smarter process
The Scan Wizard is an example of how AI can be applied in investing. I’m not interested in having an AI agent pull the trigger on trades or make financial decisions for me. But if AI can save me time and find high-potential trading setups, then I’m all in!
So, instead of letting this week’s market pullback ruin your weekend, log in to your StockCharts account and take the AI Scan Wizard for a spin. Build a few scans so you can be prepared for the coming week.
Have a great weekend!