Forget the Hysteria: Bonds Have Bottomed

In technical analysis, we deal in probabilities, never certainties. So, a better way of expressing the title of this article may be, “The Odds Strongly Favor That Bonds Have Bottomed.” That, of course, leaves open the question of the importance of that bottom, which I’ll get to later.
The point I’m trying to make here is that sentiment is notably bearish and has been for a few weeks, which, from a contrary point of view, is highly constructive, provided we can see some positive market action to back that idea up. I believe Thursday’s action probably marks a climax of some kind. While it doesn’t suggest bonds have put in a primary trend bottom for prices or peak for yields, it’s unlikely that Thursday’s low will be taken out for at least a couple of months, possibly longer.
Turnaround Characteristics
Chart 1 sets the scene with the iShares 20+ Year Treasury Bond Fund (TLT) forming a bullish outside day. Bullish outside bars completely engulf the previous bar and close near the session’s high. As you can see, Thursday’s action opened with a gap, showing that sellers were in control at the opening. However, by the end of the day, it was the buyers who were in control as they were able to push and hold the price above Wednesday’s high.
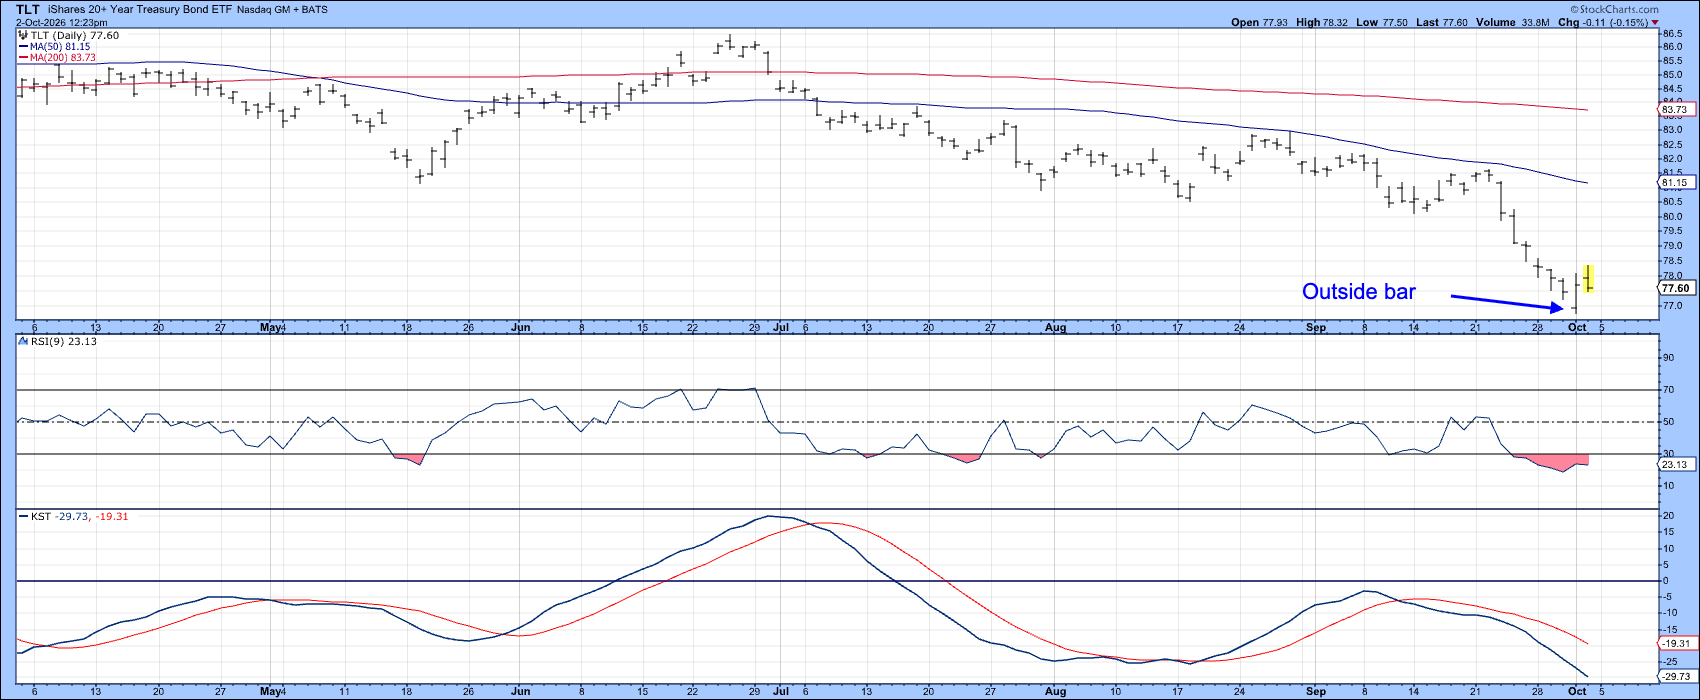
Outside bars gain in significance from several factors, not all of which are simultaneously present. First, they need to be preceded by a sharp decline, which means that a substantial number of weak holders have already been liquidated. Second, the wider the bar relative to its predecessors, the more significant the buyer/seller battle. Finally, the greater the volume, the more significant the battle.
Thursday’s action qualifies for all these conditions. Indeed, the severity of the preceding decline can be appreciated from the deeply oversold, and in the case of the Relative Strength Index (RSI), persistent oversold condition.
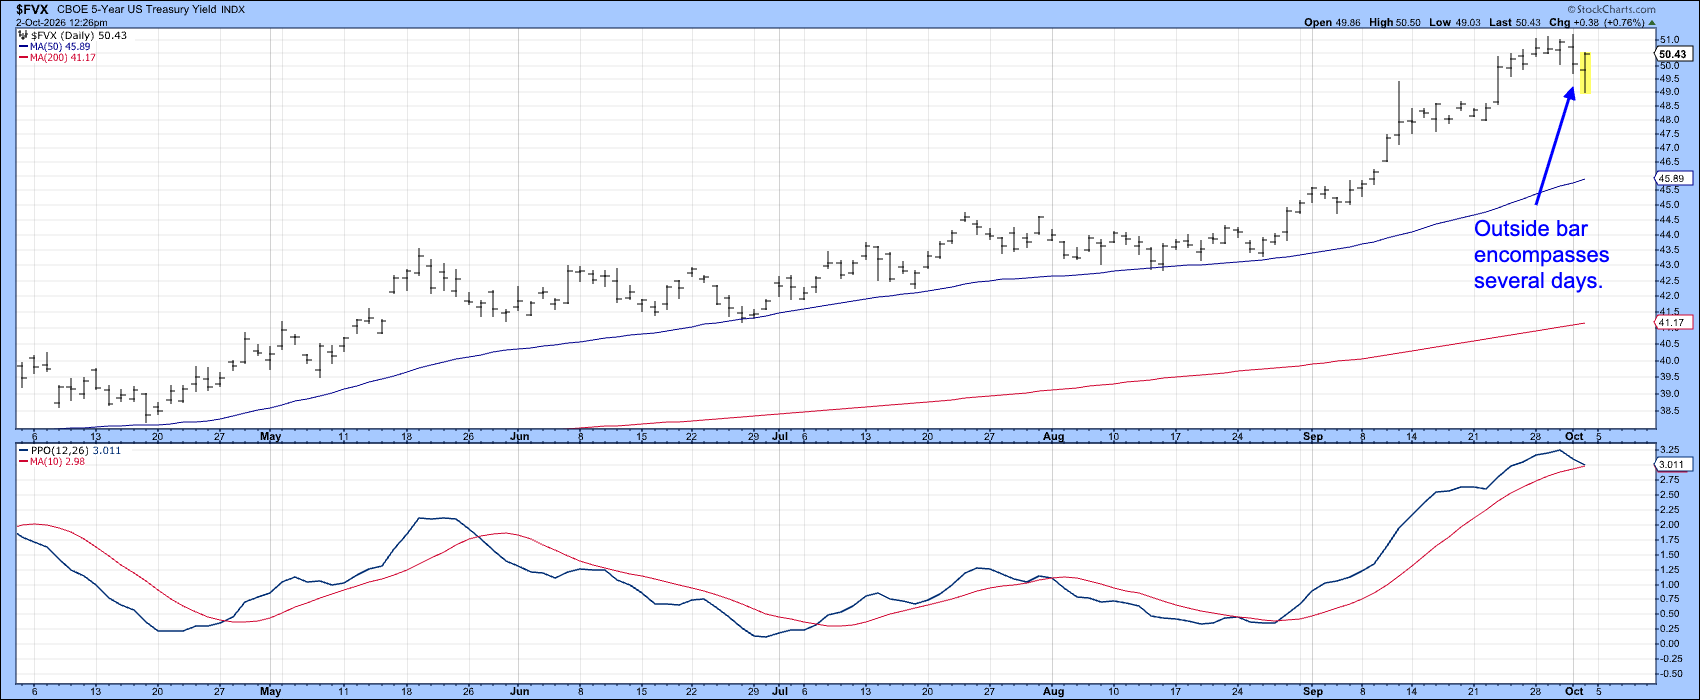
Shorter-term yields also displayed turnaround characteristics on Thursday. Chart 2, for instance, indicates that the 5-year yield experienced a (bearish for yields) outside bar. In this instance, the significance of the bar lay is that it encompassed several days of trading and was not just limited to one, as was the case with the TLT.
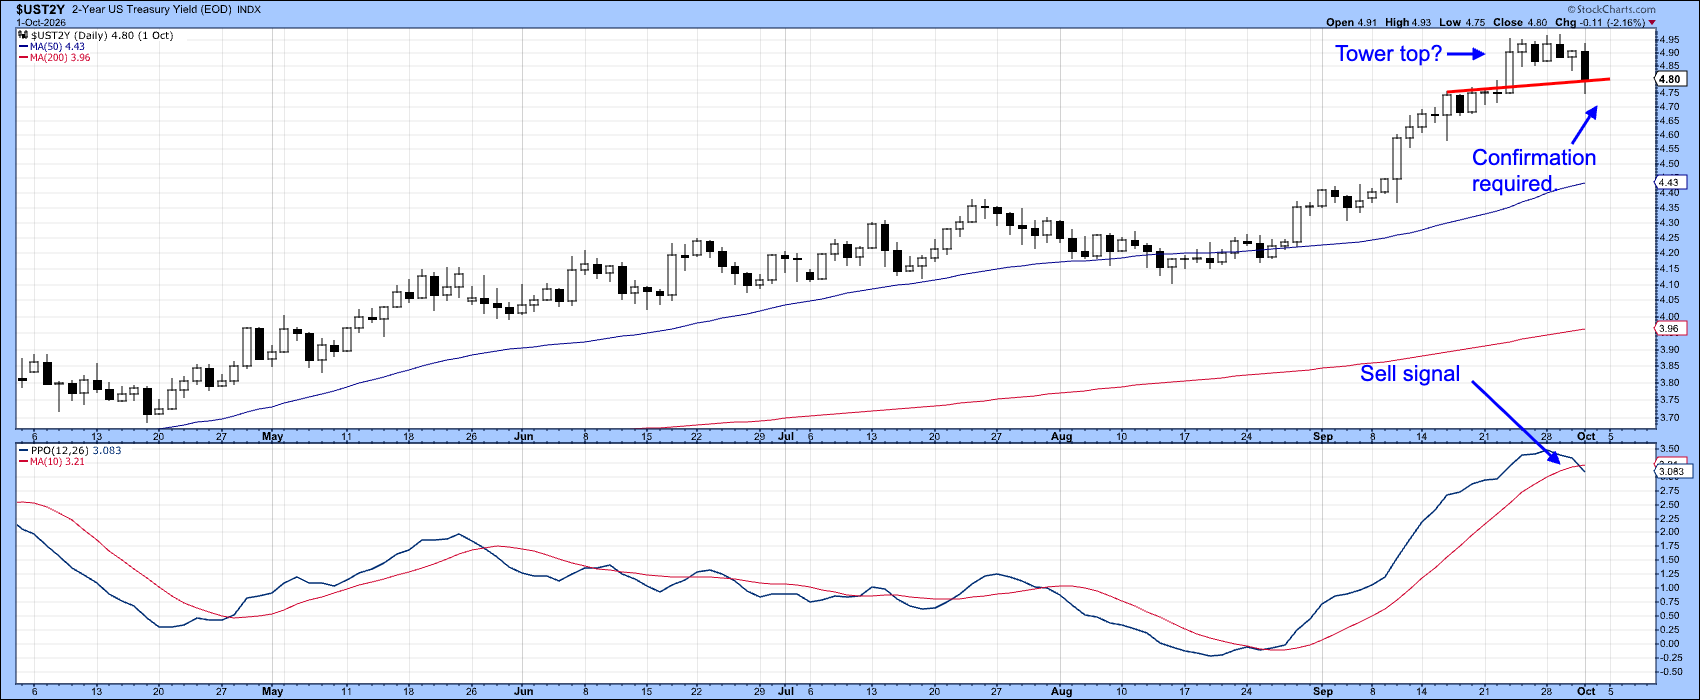
Finally, in the Treasury space, the all-important 2-year series completed a tower top on Thursday but requires confirmation with a violation of the red support trendline before it can become effective.
Bullish characteristics can also be observed in the junk bond sector, as the iShares iBoxx $ High Yield Corporate Bond ETF (HYG) climaxed its lengthy sell-off with a bullish hammer candlestick pattern, as featured in Chart 4.
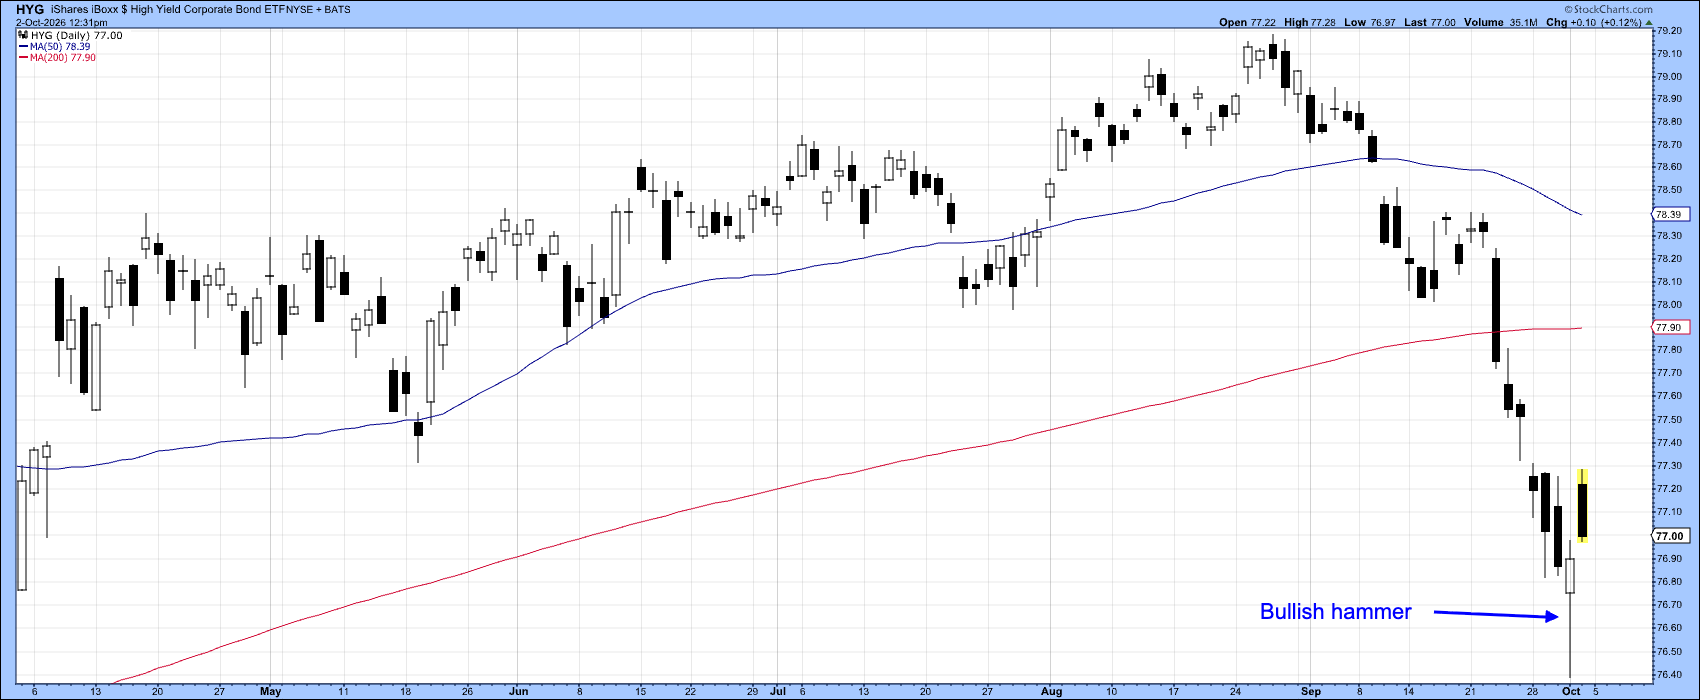
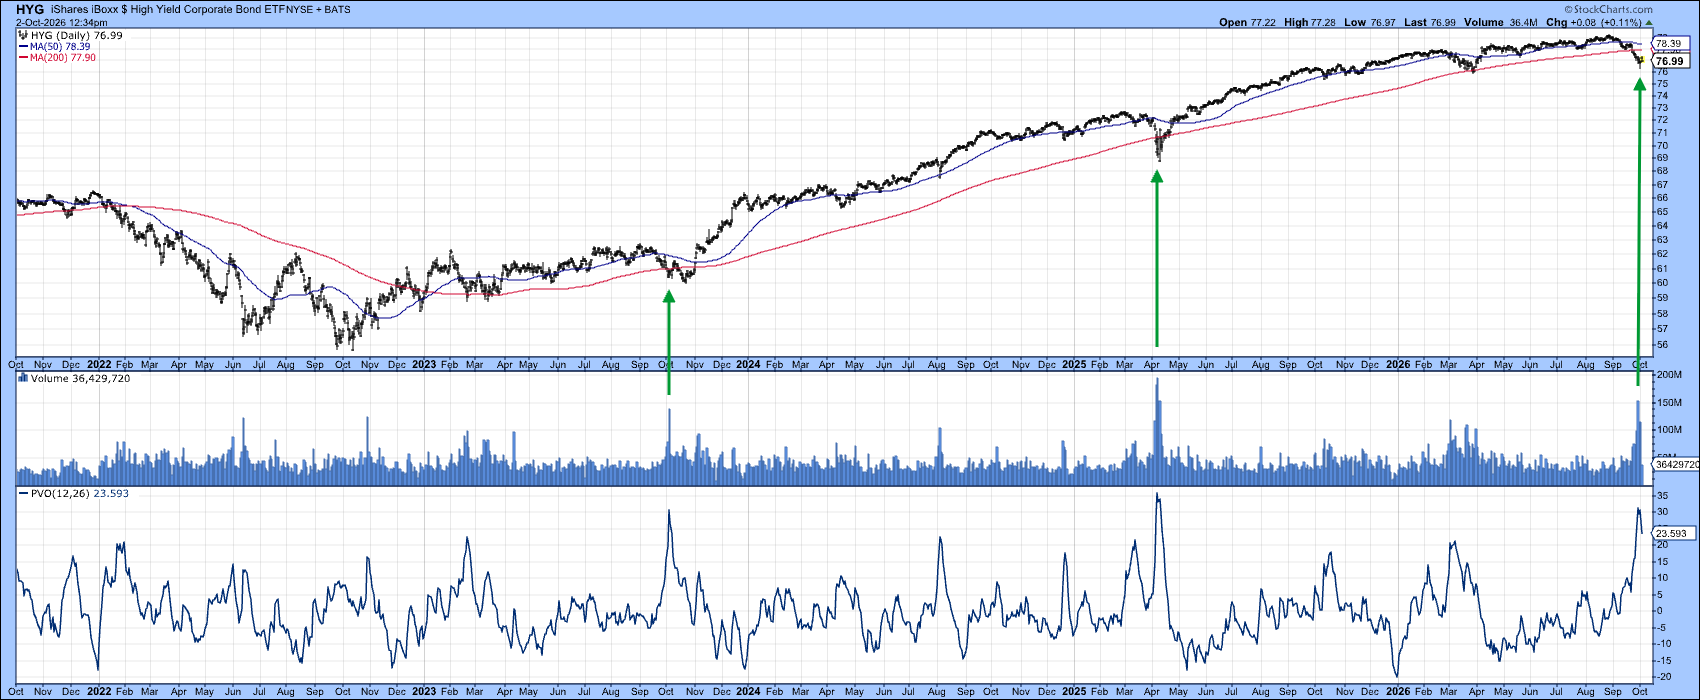
Chart 5, on the other hand, shows that HYG has also experienced a massive selling climax, as reflected in an extreme reading in the Percentage Volume Oscillator. The chart shows that two previous such climaxes were followed by significant advances.
The Bottom Line
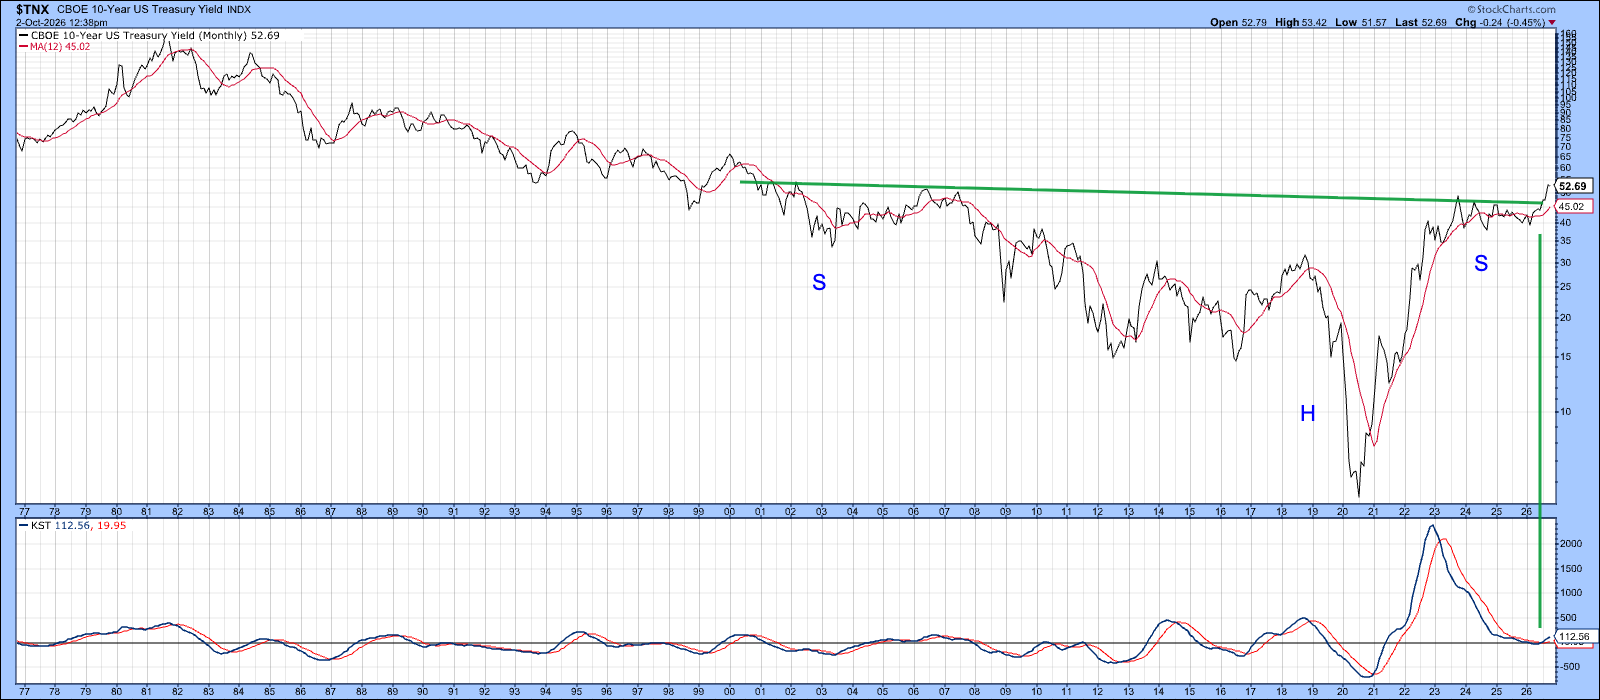
There is a good chance that yields have peaked and prices bottomed for a while. However, Chart 6 reminds us that the long-term picture is different since the 10-year has recently broken above what was previously major resistance. It was also supported by the long-term KST. If that break is valid, and I believe it is, higher yields are likely before the current cycle has run its course.
Good luck and good charting,
Martin J. Pring
The views expressed in this article are those of the author and do not necessarily reflect the position or opinion of Pring Turner Capital Group of Walnut Creek or its affiliates. The Six Stages of the Business Cycle are followed each month in Martin Pring’s Intermarket Review.