Three Financial Stocks Showing Strength as Banks Struggle

All eyes will be on Q3 earnings season in the weeks to come, with bulls looking for validation in the form of strong earnings results from key growth stocks. So far, earnings season has been limited mostly to the Financials sector, and the results have been less than encouraging.
The chart of the SPDR S&P Bank ETF (KBE) tells the story, having broken below the 200-day moving average at the end of September.
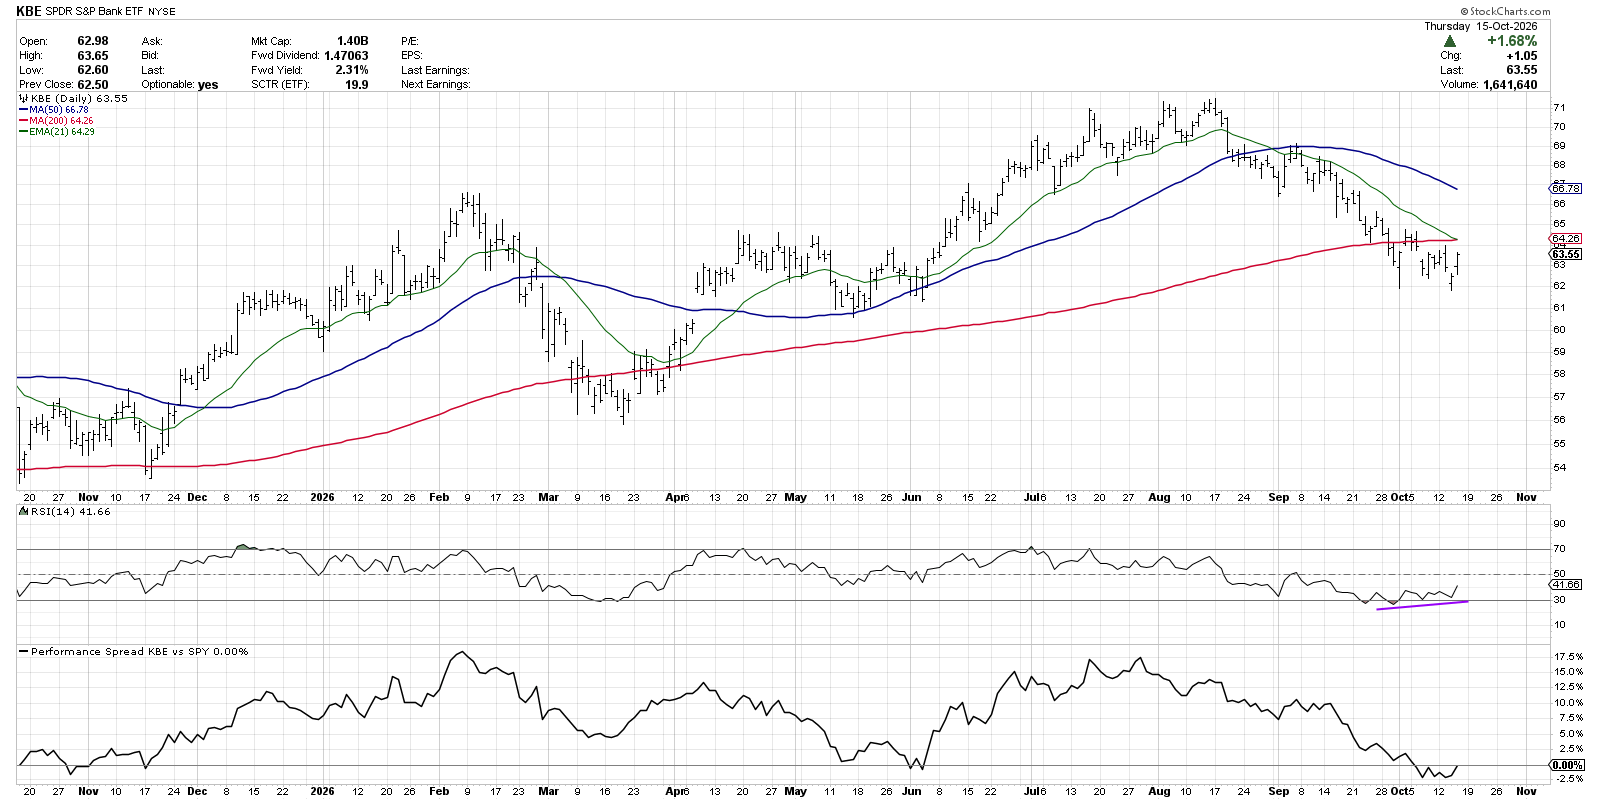
It’s worth noting that the last time KBE broke below its 200-day moving average, back in March, the ETF soon recovered and pushed to a new high into the summer months. And a bullish momentum divergence on the recent breakdown suggests that as a real possibility. For now, however, the trend appears to be aiming lower in October.
I used the StockCharts screener to identify stocks with a more constructive technical profile, focusing on stocks above their 200-day moving average and with a decent StockCharts Technical Rank (SCTR) score. Here are three names that fit the criteria and could present an opportunity for exposure to the Financials sector but outside the big banks.
Visa (V): Onward and Ever Upward
Shares of Visa and Mastercard (MA) have been surging higher in October. I like the strong uptrend phase for V, with the recent push above $385 representing a new all-time high and a strong accumulation phase.
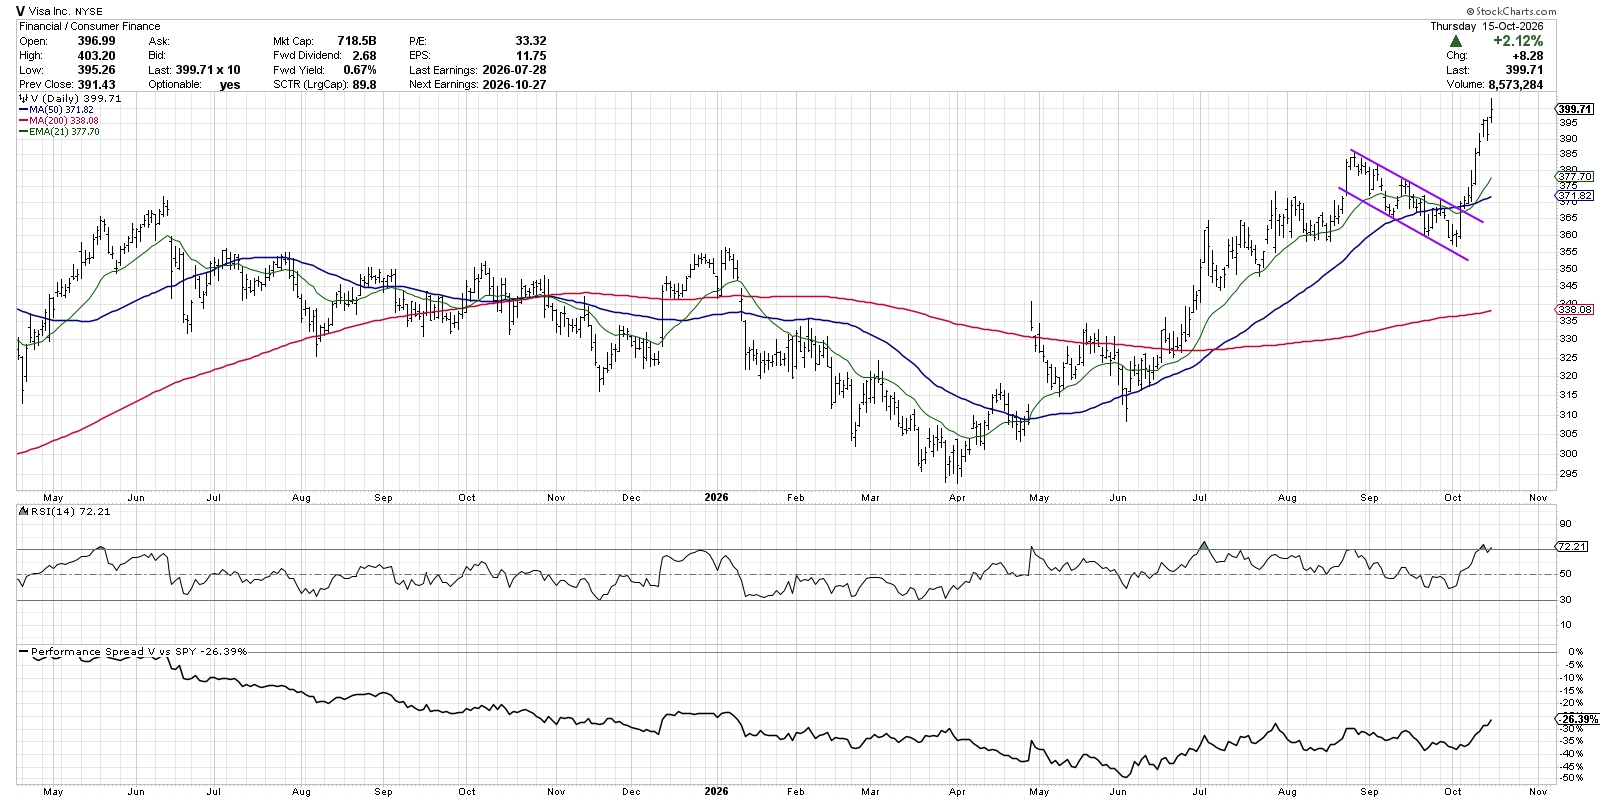
Visa looked vulnerable at the end of September, after breaking below its 50-day moving average and with an RSI down around 40. But a subsequent rally completed a bull flag pattern as the price popped back above the 50-day. The stronger price momentum, with an RSI above 70 again this week, speaks to the strong momentum conditions and favorable uptrend pattern.
Perhaps most importantly, the relative performance has achieved a new swing high this week, acknowledging how Visa has been providing an opportunity to outperform the S&P 500 ($SPX). With our benchmarks languishing in a consolidation phase, relative strength seems more meaningful than ever!
Metlife (MET): Breakout From Bull Flag Pattern
Similar to how the confirmed bull flag pattern represented a renewed bullish tell for Visa, we’re observing a similar setup here for Metlife. And, just as with MET, the RSI pulled back to the 40 level before a surge higher in price drove the momentum higher to indicate a new accumulation phase.
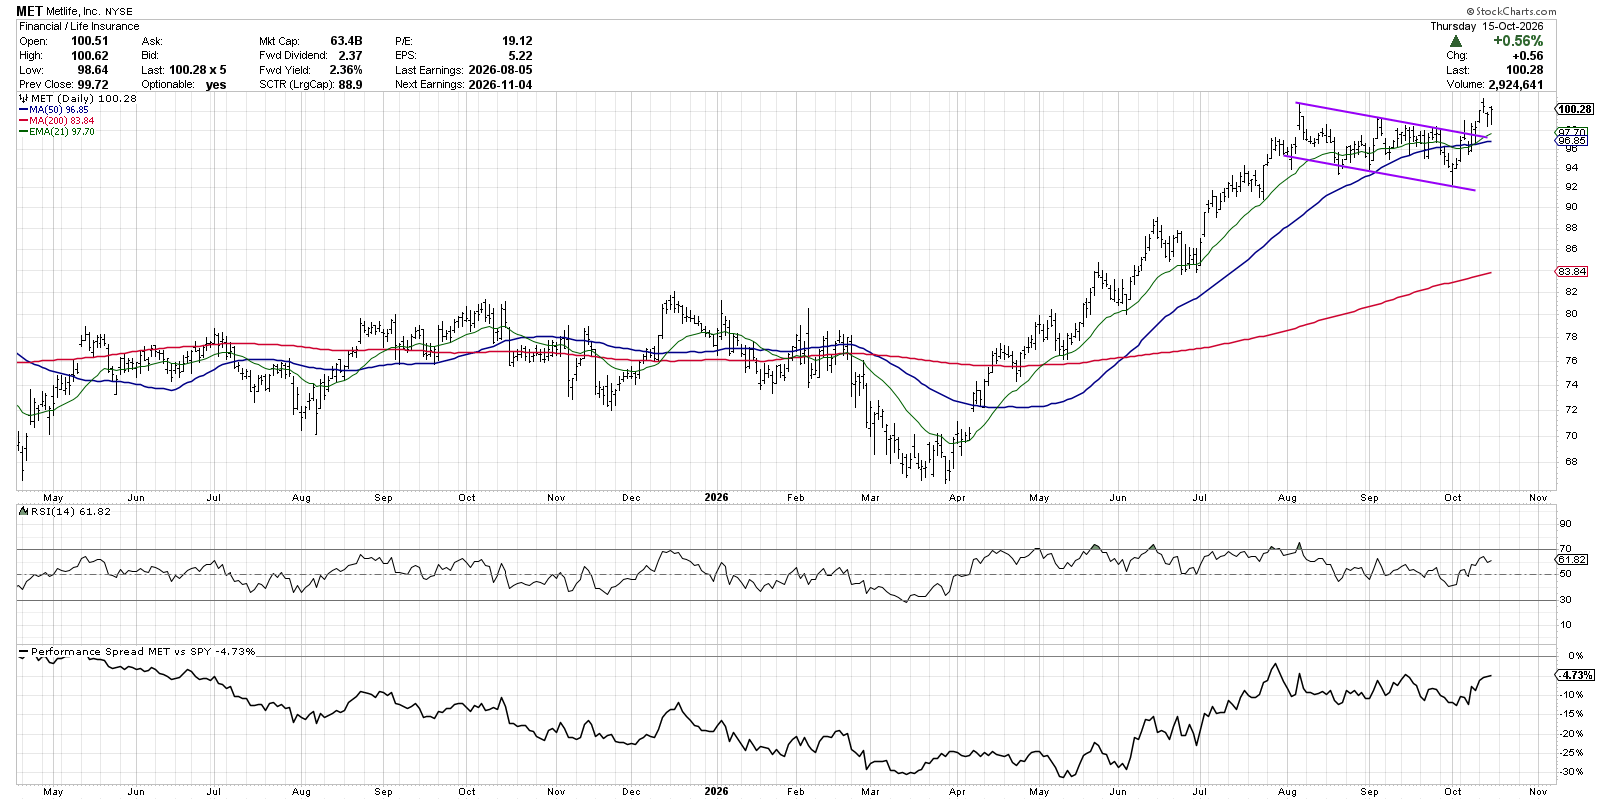
Since breaking out of the bull flag pattern earlier this month, Metlife has now stalled out at its previous all-time high around $100. As this price level also represents “big round number” resistance, we’d love to see a confirmed move above that $100 level to complete the upside rotation and cement the bullish thesis. And that price breakout would most likely result in strong outperformance that we’re looking for in Q4.
Blackrock (BLK): Bouncing Off Moving Average Support
Several asset managers have popped on our radar this week, and Blackrock stands out with a recent bounce off its 200-day moving average. While the weekly chart of BLK still shows the stock in a consolidation phase, we’re looking to see if the recent bounce off support could manifest into further price gains.
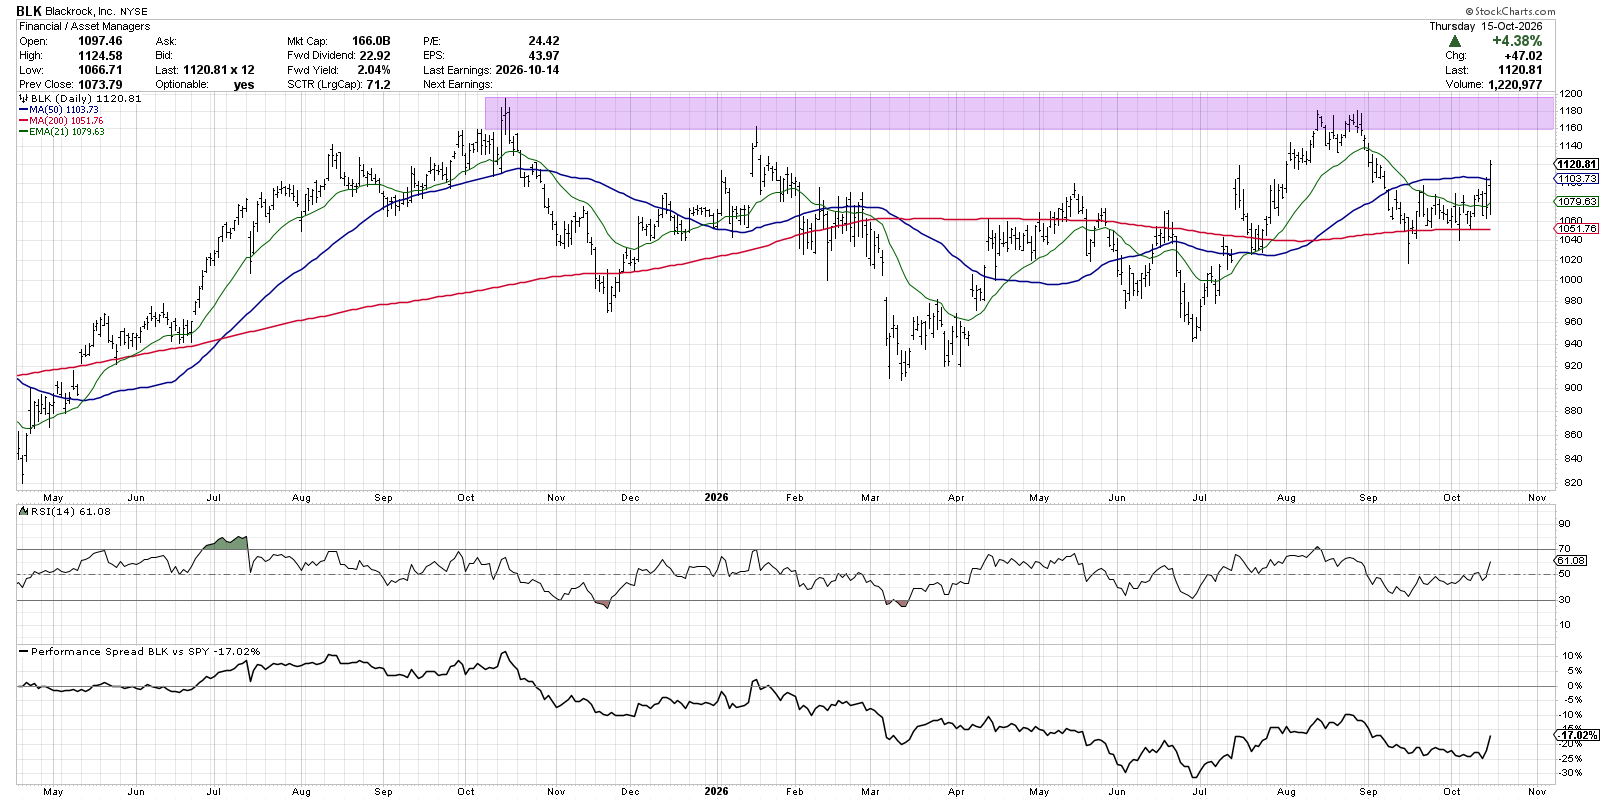
Blackrock is experiencing a decent upside bounce after reporting earnings this week, enough to push the price back above the 50-day moving average. But the real test lies at previous all-time highs around $1180. If BLK continues to show strength here and demonstrate improved momentum along the way, we could see the stock finally break out of the consolidation phase seen on the weekly chart. As we have seen so many times with equities, a breakout often leads to further upside momentum as willing buyers begin to believe.
So far, Q3 earnings season has been underwhelming, with a number of financial stocks failing to gain upside momentum at a crucial phase for the equity markets. But a quick review of stocks within the sector shows that there are several compelling technical setups. By combining the StockCharts Screener with the StockCharts Technical Rank, it's not too difficult to identify those charts!
RR#6,
Dave
P.S. Ready to upgrade your investment process? Check out my free behavioral investing course!
David Keller, CMT
President and Chief Strategist
Sierra Alpha Research LLC
marketmisbehavior.com
https://www.youtube.com/@DKellerCMT
Disclaimer: This blog is for educational purposes only and should not be construed as financial advice. The ideas and strategies should never be used without first assessing your own personal and financial situation, or without consulting a financial professional.
The author does not have a position in mentioned securities at the time of publication. Any opinions expressed herein are solely those of the author and do not in any way represent the views or opinions of any other person or entity.