Before You Buy the Dip, Check These Stock Market Signals

Key Takeaways
- Despite the selloff, the S&P 500 and Nasdaq Composite have reclaimed their 50-day moving averages.
- Larry Williams' indicators suggest seasonal strength and a potential rebound.
- Watch key support levels and momentum indicators for signs of a reversal, and always have an exit strategy in place.
Wall Street has been on quite a roller coaster this week. Hotter-than-expected Consumer Price Index (CPI) and Producer Price Index (PPI) reports didn’t help. Neither did rising oil prices, at least initially.
Wednesday was a rough day. The major equity indexes took a beating, with the S&P 500 ($SPX) and Nasdaq Composite ($COMPQ) slipping below their 50-day simple moving averages (SMAs). After Thursday’s PPI report, it looked as though the selling would continue, but the stock market had other plans; stocks staged a comeback, and the major indexes finished the day in positive territory.
It’s a Confusing Stock Market
This kind of back-and-forth price action can test even the most patient investor’s patience. When stocks sell off sharply, it’s natural to think about whether you should trim your technology positions and put that money to work elsewhere. And there have been signs of rotation. In the last two days, Technology has been among the worst-performing sectors, while Health Care has climbed to the top.
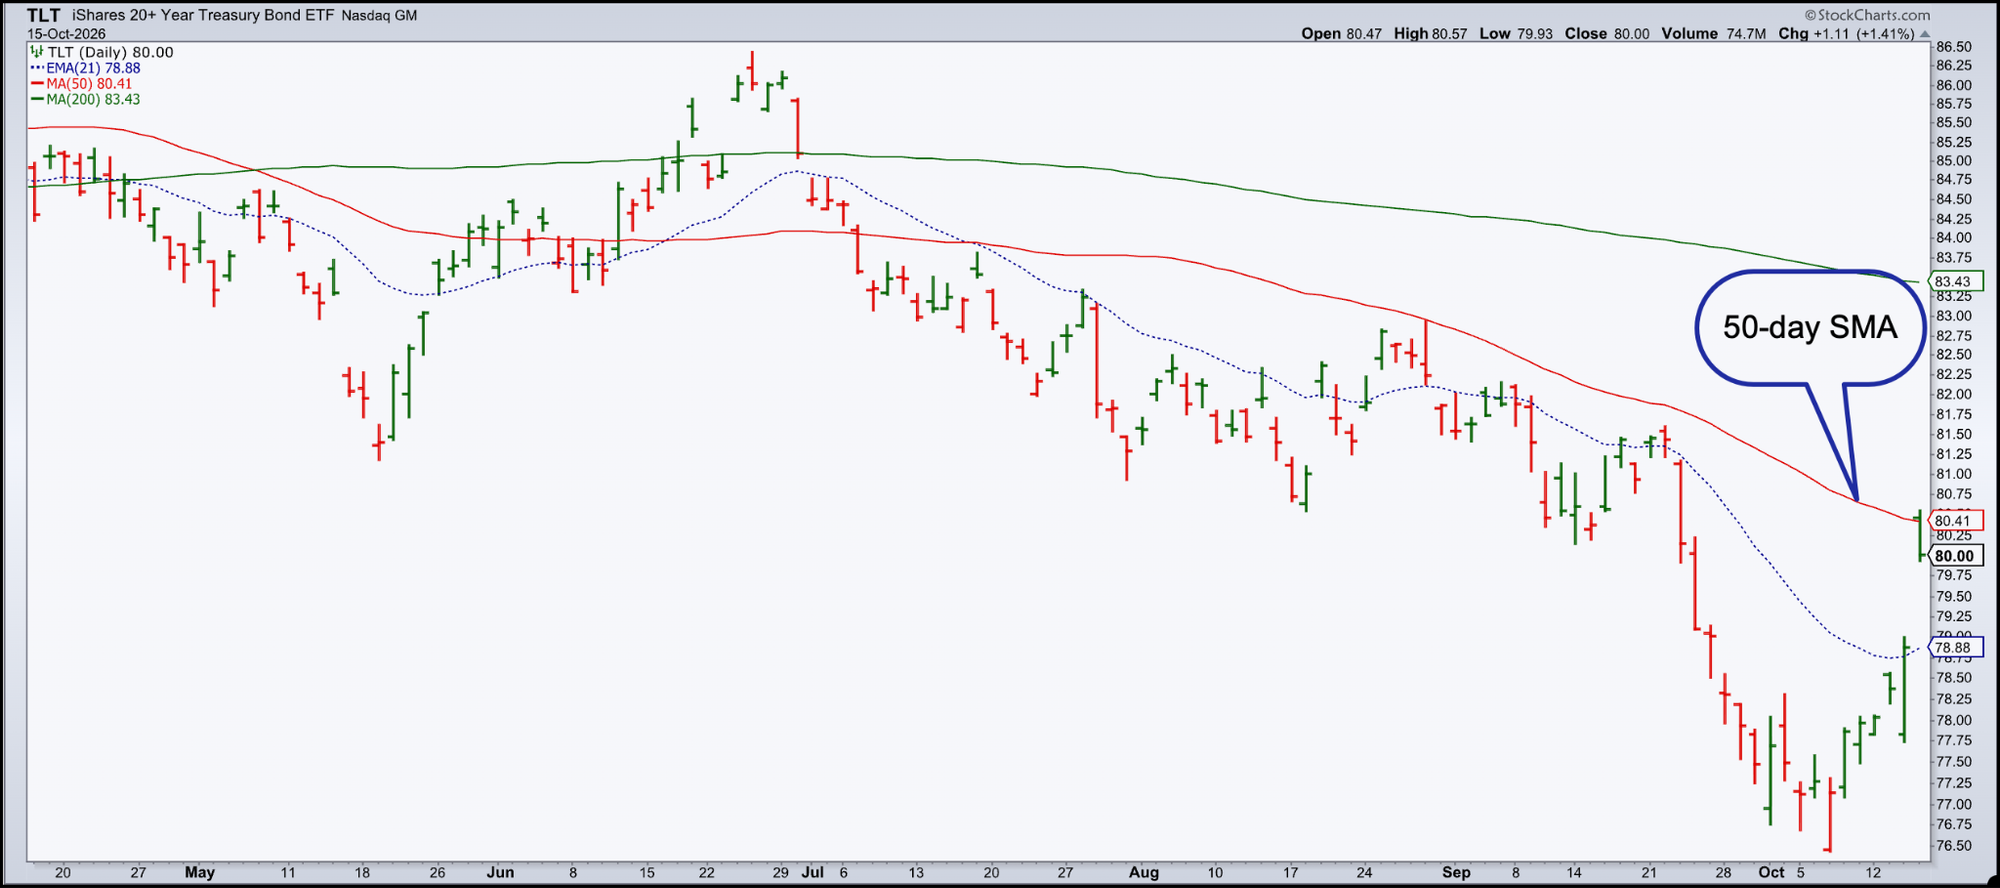
The bond market is also showing some interesting developments. Bond prices have begun to show signs of bottoming, although the daily chart of the iShares 20+ Year Treasury Bond ETF (TLT) still looks bearish. TLT gapped higher on Thursday, opening at its 50-day SMA. But it wasn’t able to stay above it and closed near its low for the day.
Gold and silver also moved higher on Thursday, but the gains weren’t significant enough to suggest buyers were rushing in. The same can be said for some of the cryptocurrencies.
So what’s an investor to do when the stock market quickly changes direction?
Seasonally Sound
I recently watched Larry Williams’ video and decided to put some of his indicators to work. I started by overlaying the Williams True Seasonal on the chart of the VanEck Semiconductor ETF (SMH) and adding the Williams Money Flow Index in the lower panel. Together, these indicators show where prices tend to move based on historical seasonal patterns and whether professional investors are buying or selling.
I applied the indicators to SMH since semiconductors have been a driving force behind the stock market, and their performance can provide valuable clues about the health of the S&P 500 and Nasdaq.
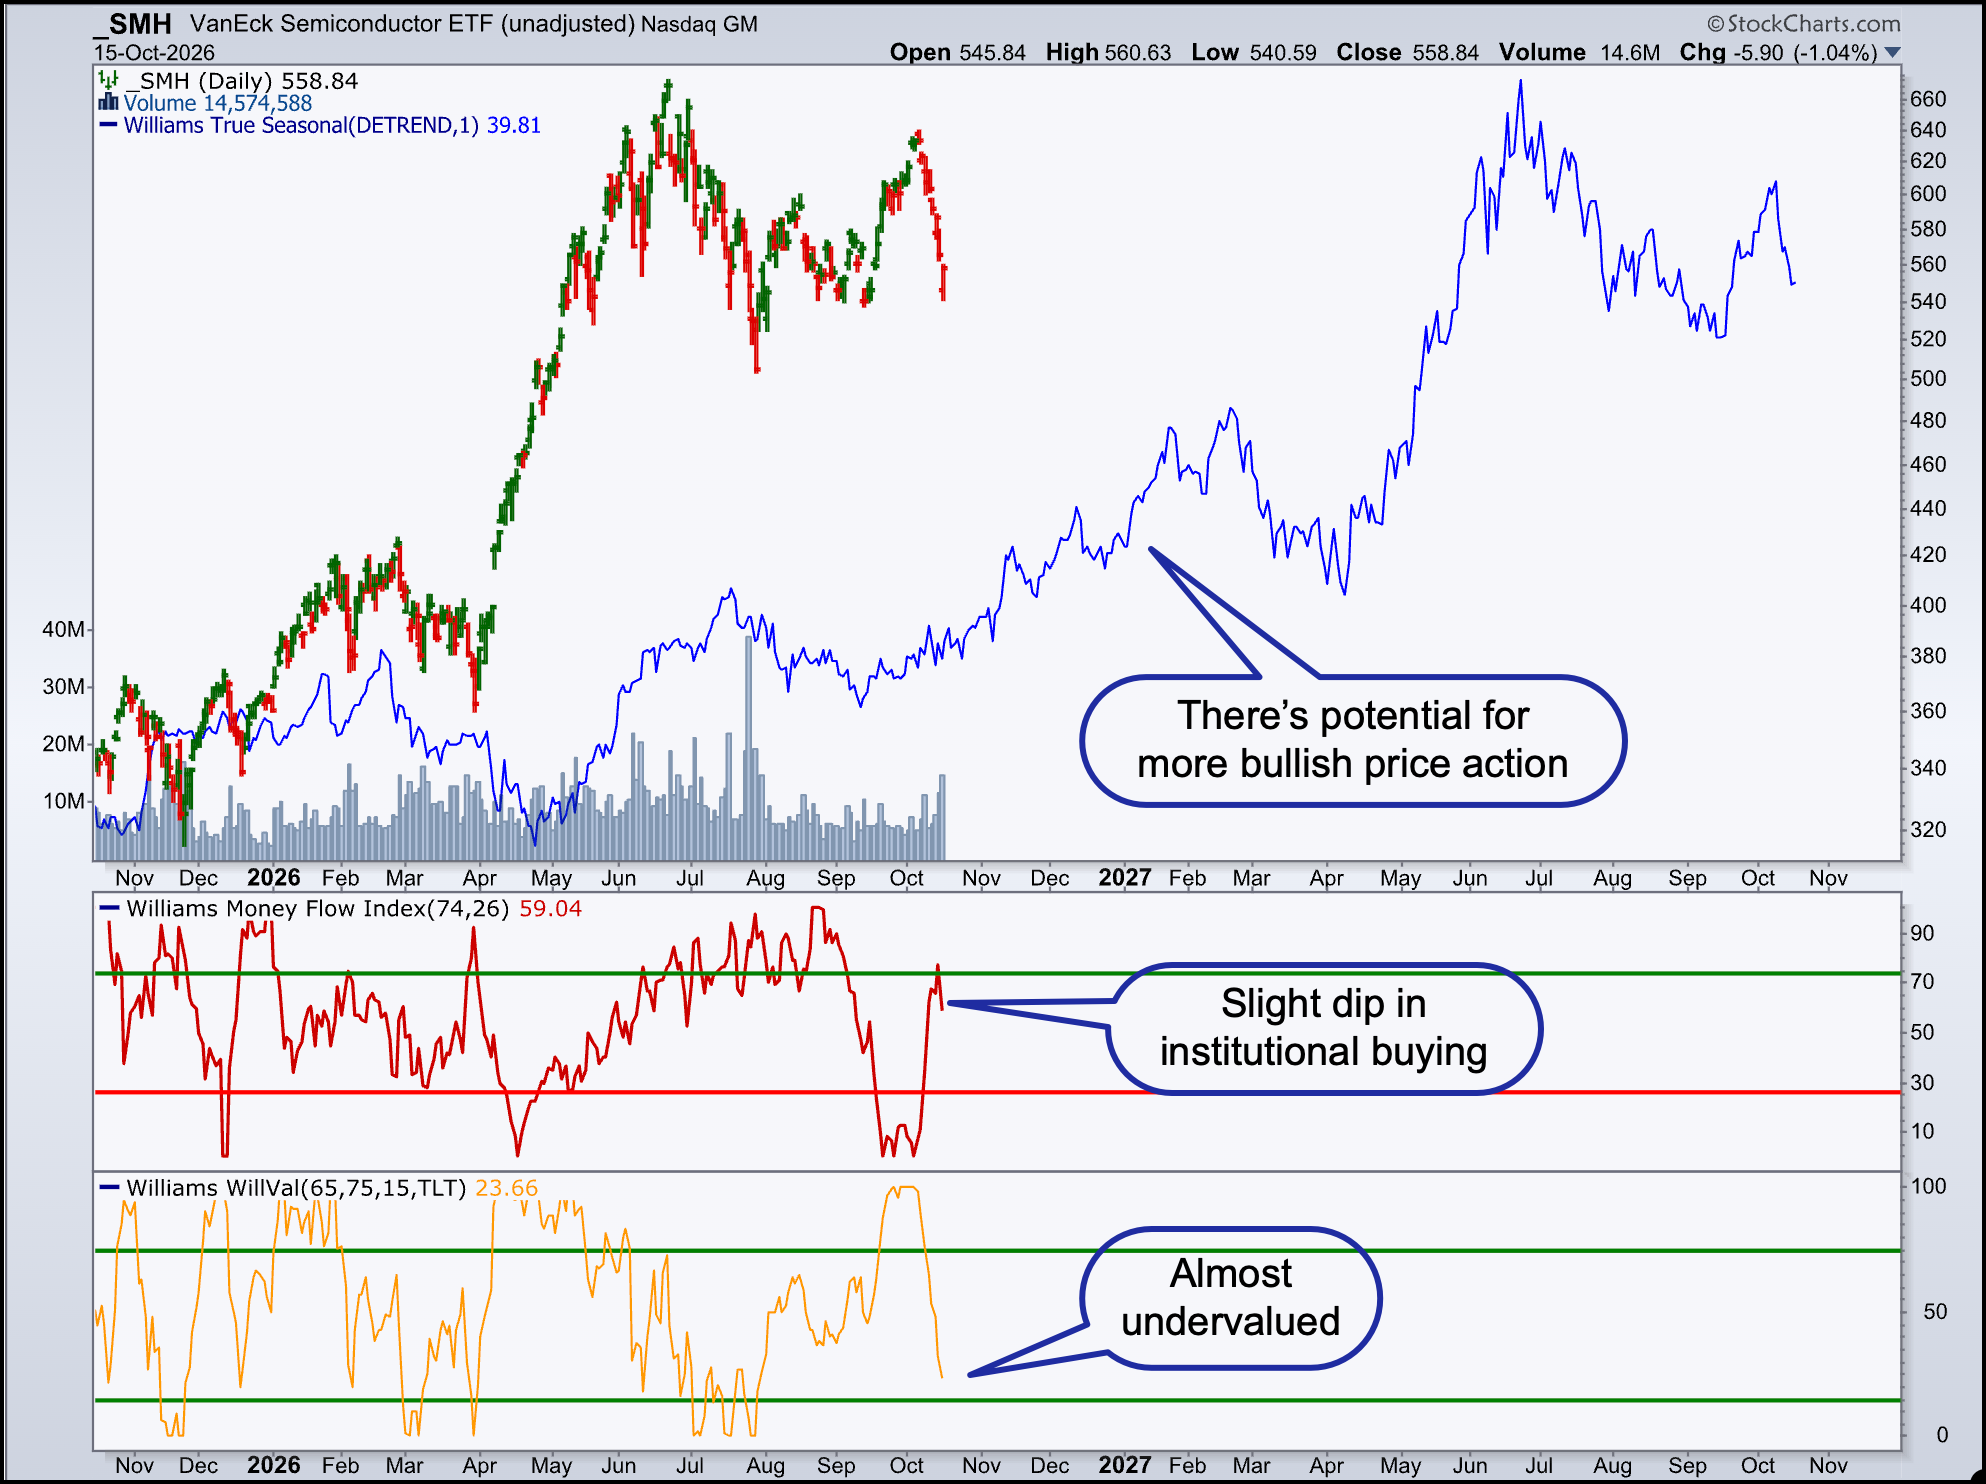
The seasonal picture looks encouraging. Historical tendencies suggest that SMH is likely to move higher through February 2027. The Williams Money Flow Index shows some institutional selling, but nothing raises a red flag just yet.
So does it mean it’s time to start hunting for semiconductor stocks? To get a better sense, I added the Williams WillVal indicator. The current reading is 23.66, a level some investors might consider undervalued. I’d prefer to see a reading below 20, similar to the July readings, to get a more confident assessment.
Note that the WillVal uses TLT as a benchmark, which seems appropriate given the attention on the bond market and that AI companies are looking for financing to expand their data centers and AI infrastructure. If you’d rather use a different benchmark, you can change it to the U.S. dollar (UUP) or gold (GLD).
Taken together, these indicators suggest that semiconductors could return to the spotlight. It doesn’t mean it’ll happen within a few days, though. We could see several more weeks of this back-and-forth price movement before semis make their next leg up.
Want to see what else Larry Williams’ Indicators can reveal? You’ve seen what three Larry Williams Indicators can reveal. Imagine what you could uncover with the full collection. Explore the Larry Williams Stock Trading Starter Pack and discover more ways to analyze market trends, money flow, and potential opportunities.
Remember that seasonal tendencies aren’t guarantees. They’re guides, and given that we are in the midst of a challenging macro environment with mid-term elections approaching, it helps to follow the daily price action rather than relying on seasonality alone. This is why I continue to look at previous highs and lows, moving averages, Relative Strength Index (RSI), and Percentage Price Oscillator (PPO). These help me evaluate whether price action supports the broader bullish thesis.
Looking at the chart below, semiconductors reached a key support area, with momentum indicators close to oversold levels.
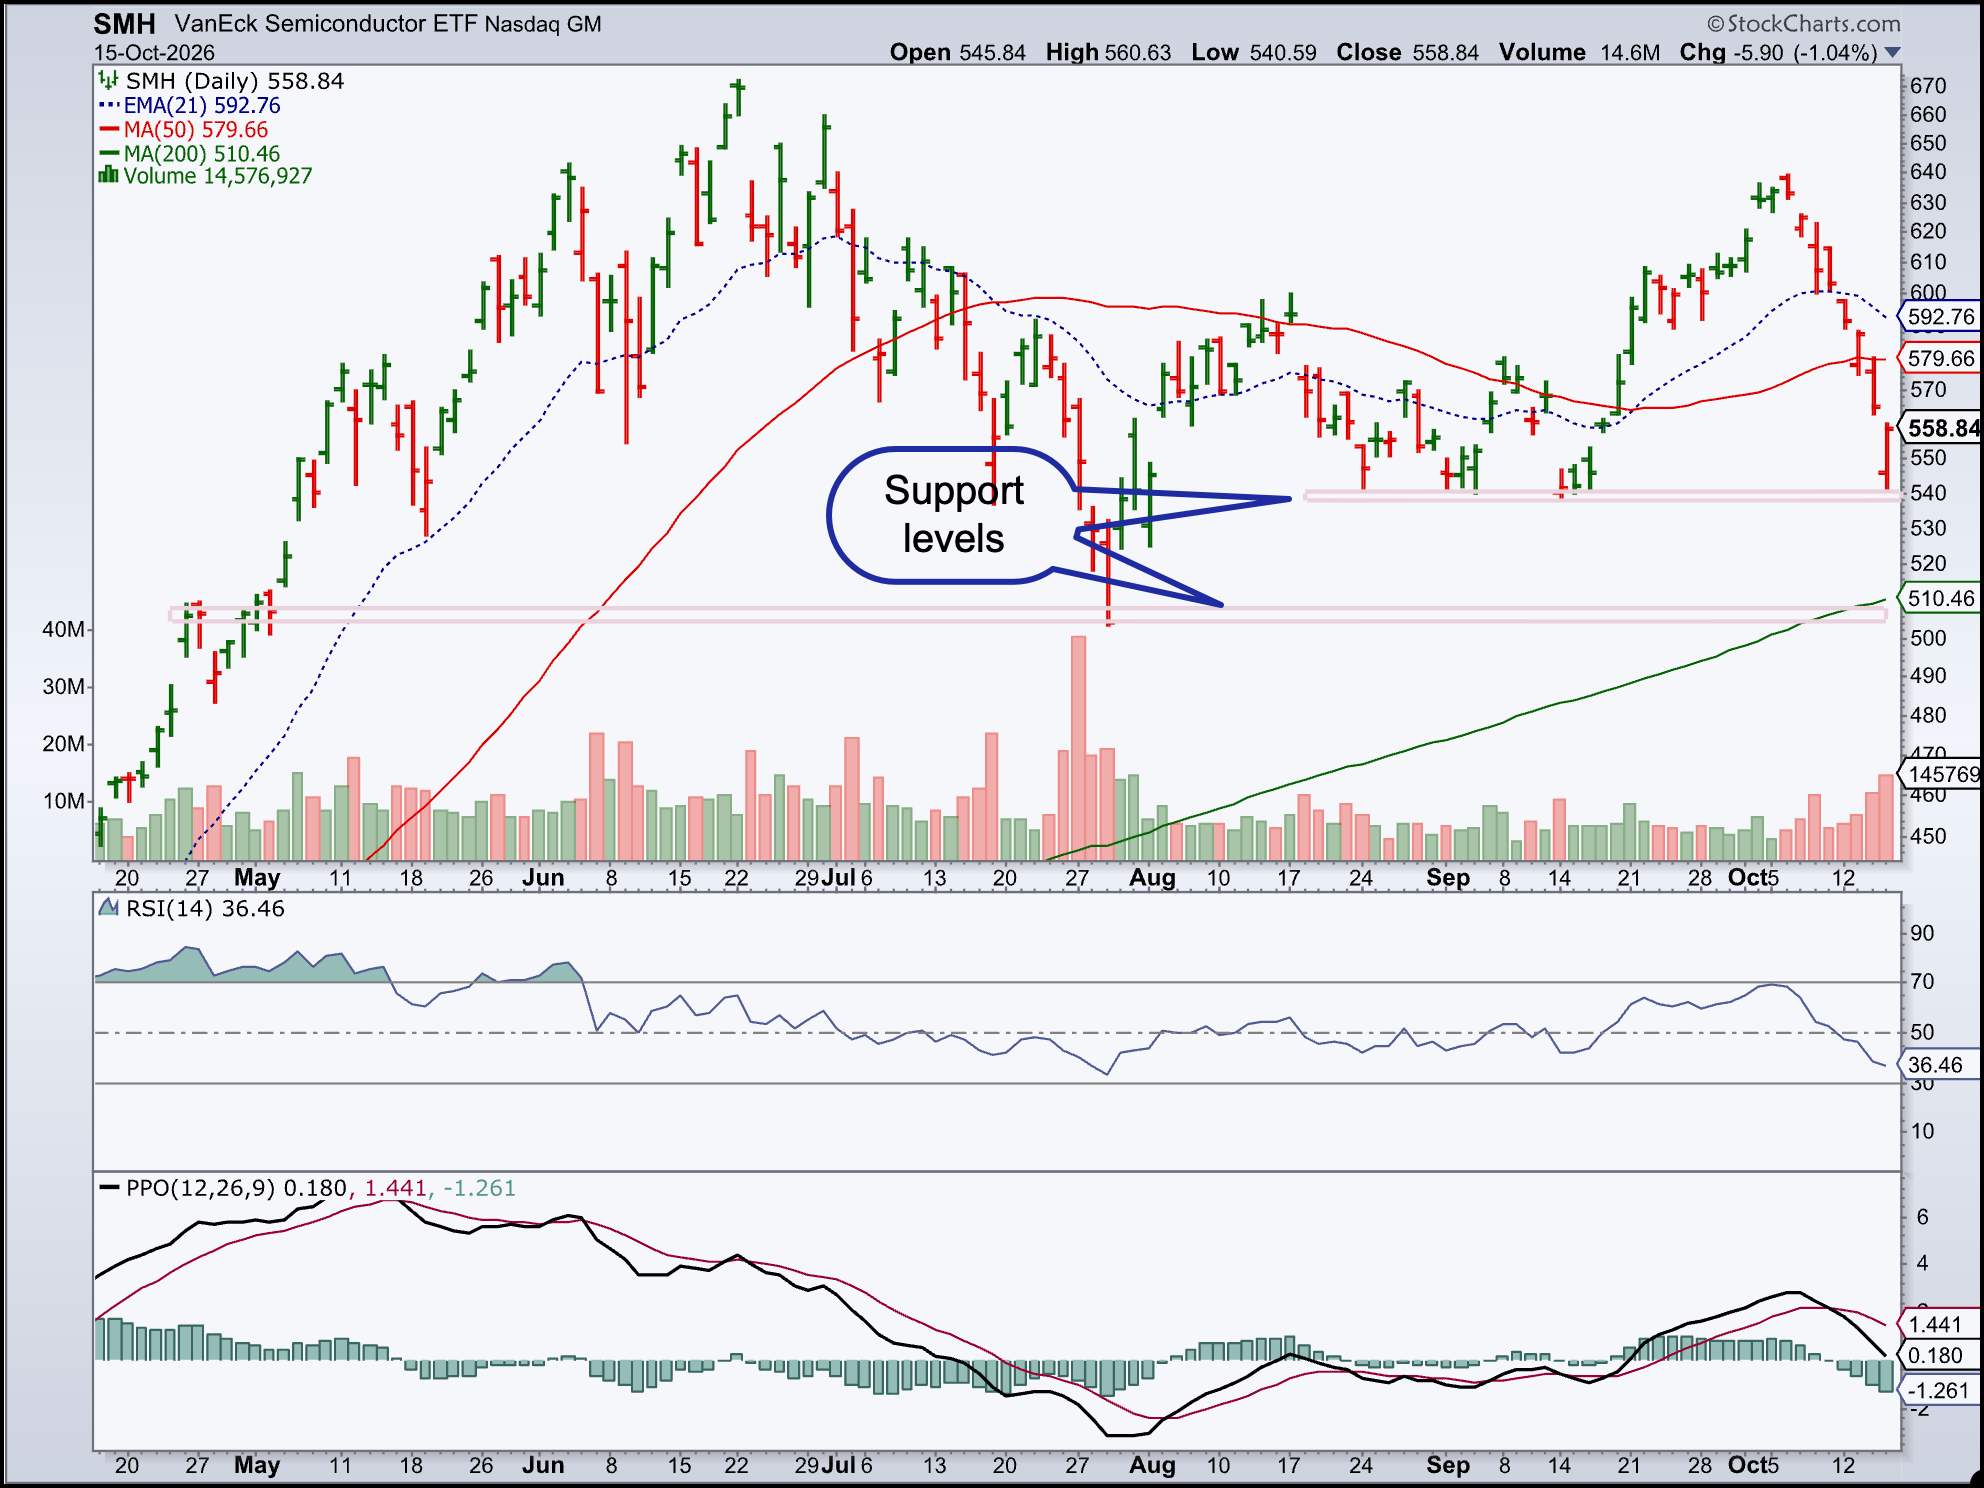
An upward reversal in the Williams Money Flow Index, WilliamsVal, RSI, and PPO would make me more confident of a potential rebound in semiconductor stocks. But even if every indicator lines up, it’s still not a 100% guarantee. This is why, before buying the dip, you should have an exit strategy in place.
The Bottom Line
With the S&P 500 and Nasdaq trading above their 50-day moving averages, technology stocks could resume their leadership and drive the broader market higher. However, if your indicators show signs of a break in the technical structure of the charts and it changes the thesis of a potential bullish rally, be prepared to put your risk management strategy to work.
Disclaimer: This blog is for educational purposes only and should not be construed as financial advice. The ideas and strategies should never be used without first assessing your own personal and financial situation, or without consulting a financial professional.