StockCharts Insider: 4 Moving Average Fixes Even Experienced Traders Overlook
Before We Dive In…
As chartists, we often rely on moving averages (MAs). These help us to gauge trends, contextualize price action, and so forth. They’re also one of the first tools we learn how to use. The overall concept of an MA seems pretty basic, but, over time, you might have discovered that they can easily be used the wrong way. For some, the lesson was hard, accompanied by a loss. For others, perhaps it was easier. But everyone learns eventually. Some people might learn in a matter of days, others, it can take weeks or longer. Lucky for you, though, here it’ll only take five minutes.
You’ve Seen This Mistake, I’m Sure
It looks painful. A newbie mistake. Like someone backtested an automated day-trading system that might have yielded good overall results, save for the periods of classic whipsaw. While most people tend to avoid this error, some still fall for the trap.
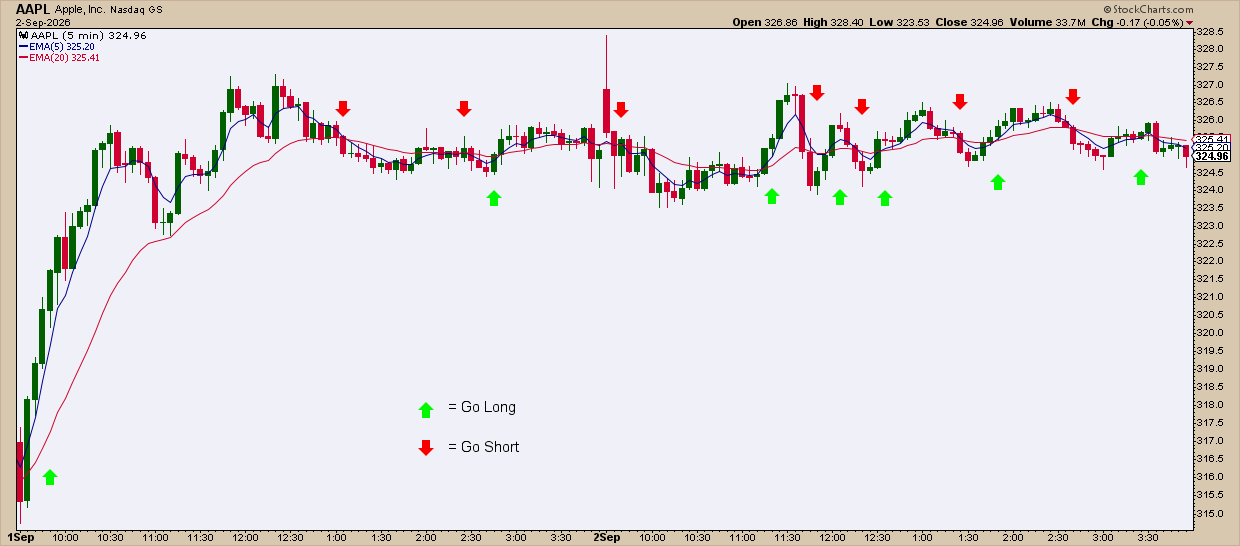
Even if it did backtest well, most wouldn’t survive the drawdowns, whether psychologically or financially.
Anyway, that was an easy example. Let’s take a look at this in greater depth, plus a few others whose erroneous characteristics tend to be a bit more subtle.
Mistake #1 - Trading Crossovers Blind
First off, crossovers don’t work in choppy markets. We just saw this in the example above. Second, the shorter the moving averages—say, a 5-period MA and 20-period MA vs. a 50- and 200-period—the more “chop” you’ll get even in a trending market. Imagine a day trading scenario where you either make very little going in and out or end the day with a loss, despite the stock (or futures contract) exhibiting a clean trend for the entire day. That’s because your MA selection generated more noise than signal.
The Fix: The overriding principle is to avoid market noise as much as possible. It’s harder when trading short timeframes. Even worse if you’re using tight MAs. But, if that’s your thing, be sure to look at the larger market structure. Pay attention to swing points, support and resistance, etc., and don’t just trade crossovers for the sake of trading crossovers. Also, don’t trade crossovers in a sideways market. If you can’t see the wider price action and momentum context, avoid trading MA crossovers in this situation altogether.
Mistake #2 - Charting the Wrong Data
Here’s another mistake. Suppose you’re trading iShares Bitcoin Trust Beneficial Interest (IBIT) as a proxy for bitcoin. You’re following the news, and a couple of things you read about got you confused.
- You see the Death Cross happen in December (see black circle) but you hear that it already took place last month (see magenta rectangle).
- Now, you hear that a Golden Cross is on the verge of forming (rectangle on the right), but you can’t see it.
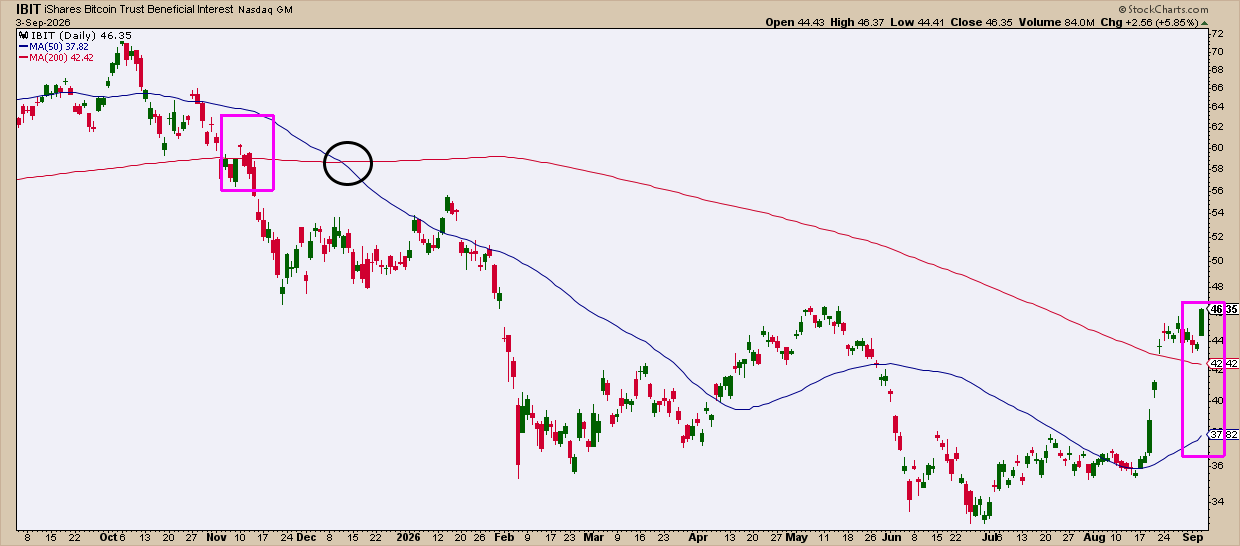
What’s happening? IBIT is an ETF that trades during market hours, Monday through Friday. Bitcoin trades 24/7. So, a 200-day MA on IBIT covers 9.5 months, while a 200-day MA on $BTCUSD covers only 6.5 months. You’re plotting the same average, but the lookback periods are different. No wonder the crossovers aren’t lining up.
Now take a look at the spot price.
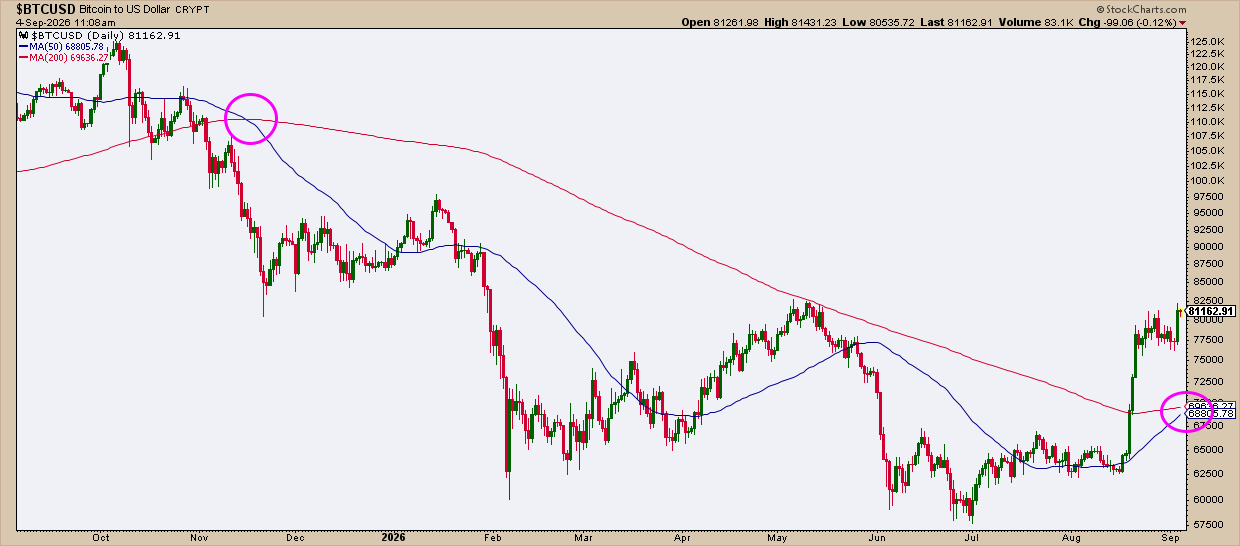
Now you see the difference. IBIT and $BTCUSD: not the same thing. The same applies for other ETFs whose prices drift from the underlying. Think of commodity ETFs that hold futures: fees and the cost of rolling contracts in contango can cause the ETF’s price to deviate from the underlying price over time. The MAs will go along with it.
The Fix: When trading an ETF that tracks a 24/7 asset or any underlying whose prices deviate from the ETF, look at both to get a clearer picture. But don’t confuse one with the other.
Mistake #3 - Ignoring the Lag
Every MA signal, whether MA-to-MA or price-to-MAs, has a lag. If you think about it, the averaging process = lag. You can shorten it with exponential or weighted MAs or with shorter periods, but you may pick up more noise than signal. Less lag, more whipsaw; more smoothing, more lag. That’s the tradeoff.
The Fix: This becomes problematic when using MA signals for trade entries. They don’t time entries well. They often come in late, and that’s not necessarily a bad thing. If you treat MAs as one component of confirmation rather than a short-term trade signal, then you might get better results. For instance, a rising 50-day or 200-day might indicate that an uptrend is still intact. Might you buy when price nears the 50-day or 200-day MA? Possibly. But it depends on the context. In other words, use the MA’s lag to your advantage by allowing it to filter out noise. This means you need to understand the larger context behind the averages and the price action.
Mistake #4 - Mismatching Timeframes
Plotting a 50-period SMA cross against the 200-period SMA on, say, a one-minute chart isn’t the same as a Death Cross or Golden Cross on a daily chart. Yet many trading tutorials (and influencers) still apply those terms to intraday charts. That’s a mismatch example centered on language and concept.
Then there's a mismatch that's easy to fall into without realizing it. Some call it the micro-trend blindness trap, or a trend-illusion trap (same thing).
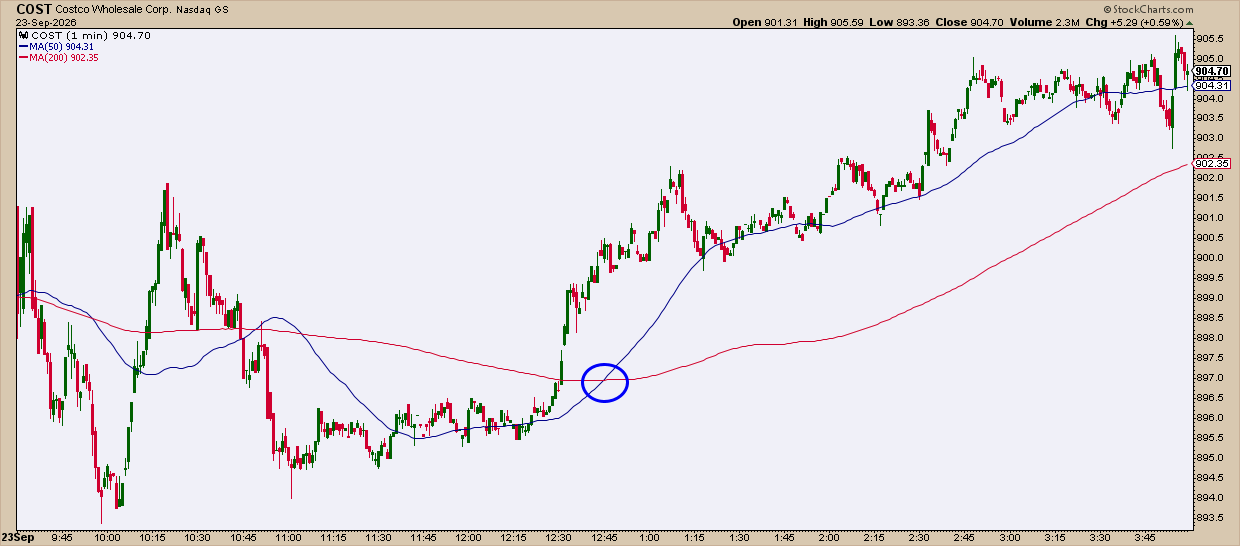
There’s a breakout and a rising micro-trend. It looks like the potential beginning of an uptrend, but that’s because you can’t see the larger context. The 50-period crossed over the 200-period SMA. That’s not a Golden Cross. And although it appears that price is being supported by the 50-period SMA, how much of that is noise—due to the actions of very few traders or perhaps just pure randomness—disguised as a viable pattern of support?
Here’s the daily picture.
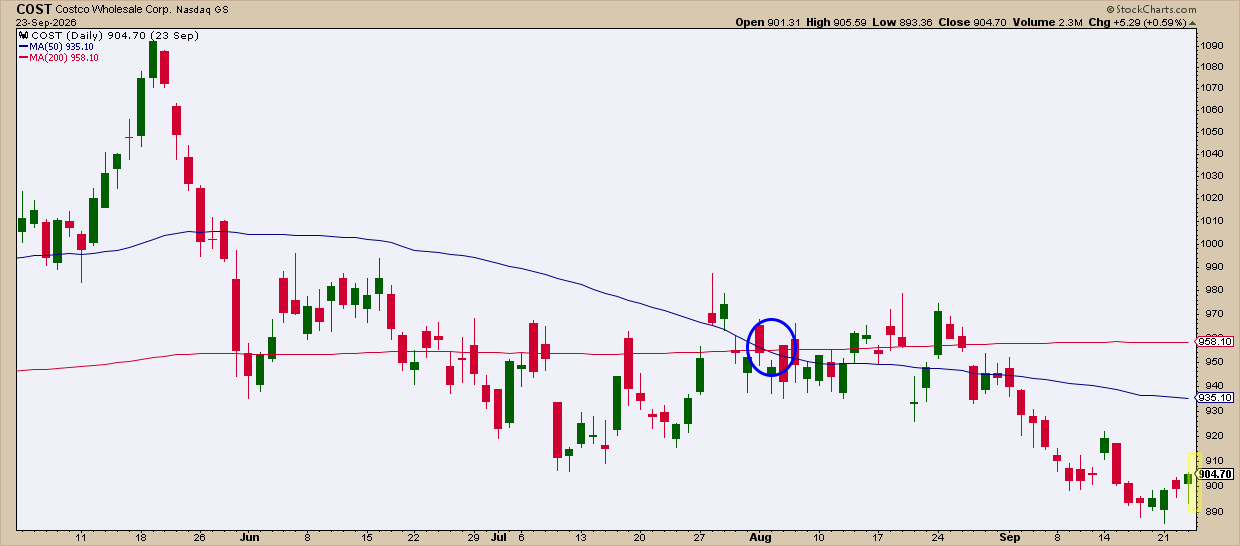
Everything in the previous chart took place in the last candle (see yellow shading). See the SMA crossover? That’s a Death Cross. And even if COST began reversing its downtrend (which it didn’t in the following sessions), you wouldn’t want to be in this stock anyway until it cleared resistance above its last swing high, or, better yet, started trading above its 200-day SMA.
The Fix: There are a few lessons here:
- Know that the same MAs in different timeframes yield different signals and have different functions.
- When using MAs to gauge trend, beware the trend-illusion trap, especially when using smaller timeframes to fine-tune trades intended for a longer time horizon.
- If you plan on using an MA from a different timeframe, adjust it to match. For example, if you want to follow the daily 50-day and 200-day moving average on the weekly chart, you’d adjust it to the 10-period and 40-period. On an hourly chart, the daily 50-day becomes a 325-period MA (based on regular trading hours). And so forth…
And That’s a Wrap
Moving averages are simple tools. But the simple part is what can make them either helpful or dangerous. None of these mistakes are generated by the MA itself. They come from asking the indicator to do something it wasn’t designed to do. There’s a common thread that runs along these mistakes and toward all technical indicators: understanding the larger context of market structure is key. While MAs can tell you something about the market structure, you must also look at market structure to tell you something about the MAs.
These are the lessons for the day. A useful five minutes of your time?
Disclaimer: This article is for educational purposes only, not investment advice.