StockCharts Insider: A 5-Step Filter for Telling Bargains From Falling Knives
Before We Dive In…
You know the parable about giving someone fish versus teaching someone how to fish? Well, if you taught them to fish but also gave them the net, that would be even better. The corollary? I can hand you a bunch of undervalued stocks in every sector that just happen to be down over the last month. But you’d be better off with the ‘net’ and the know-how so you can do it yourself, pretty much any time you want. So that’s what you’ll get in today’s Insider post.
There Are Actually Many ‘Nets’ to Choose From
I covered a bunch of them in a previous article. If you haven’t read it yet, check it out. But here we’re going to focus on one set of criteria. We’re also going to do a deep dive with a few examples.
Here’s my idea of a quick undervalued stock workflow. I’m looking for technical strength, fundamental strength, and a relatively deep decline that’s hovering above the stock’s 200-day simple moving average (SMA). I also want to keep things quick and simple. So, here’s something that I think matches what I’m trying to accomplish:
Screen combo:
- Index Membership: S&P 500.
I want the big, established names. No unknown microcap stocks where a ‘dip’ can mean people just stopped trading it. - Price Performance: Down Past 1 Month.
This is the whole point. It’s about finding stocks that took some hits. - SCTR Value: Above 60.
Technical strength is a must here. I’m looking for readings above 70. That keeps me away from a falling knife, at least most of the time. - 200-Day Simple Moving Average: Price Above.
I want a dip that's decidedly within an uptrend. Besides, nothing good happens under the 200. But you still have to watch the SMA slope and the overall price structure. - EPS Growth (TTM): Over 10%.
A stock can get ‘cheap’ for many reasons. If it’s because the company's struggling, I don’t want it. This filter makes sure the company’s earnings growth looks decent enough to consider.
You see the logic behind the selection? Now, let’s see what it comes up with.
Insider Tip #1: This Combo Doesn't Catch Valuation Slopes.
SCTR and EPS Growth (TTM) are key criteria for this combination. Still, neither can catch the sentiment or direction of valuation. An 80 SCTR may be rising from 60 or falling from the high 90s. A stock that’s down from a high can still be considered fundamentally overvalued. The screen results are snapshots without directionality. Be sure to check the movement behind the numbers.
What the Screener Caught
The Screener caught 66 names just now. Here’s a fraction of what I see on my screen:
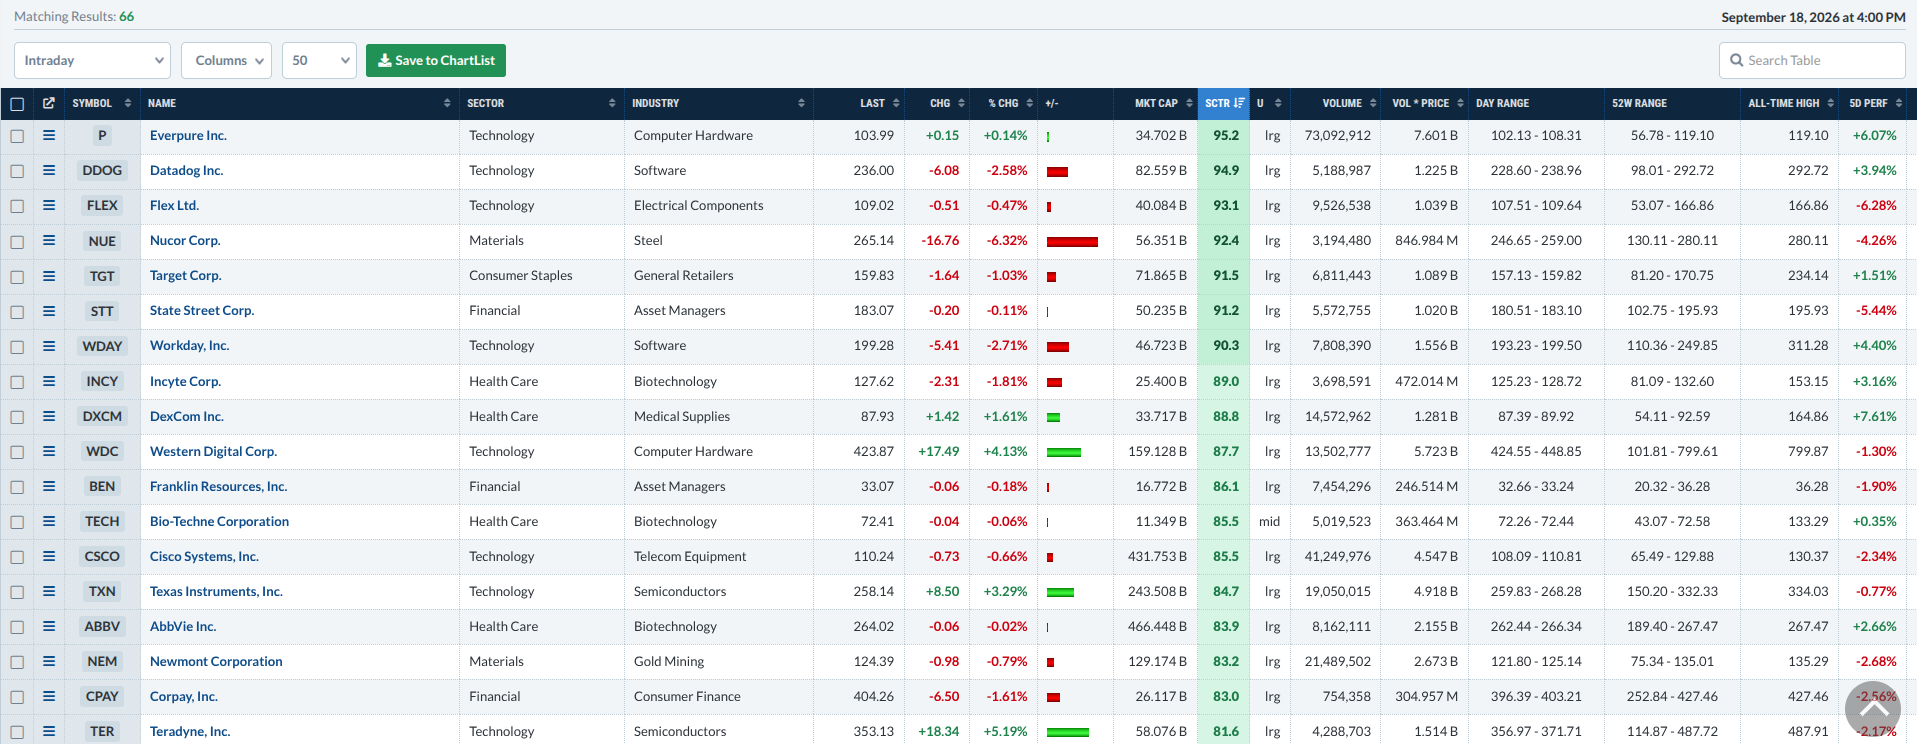
To be clear, not every stock in this list is going to look favorable once you zoom in. And this is where the bulk of your work takes place. The stocks may have the same characteristics, but their conditions can greatly differ. For this reason, I keep MarketCarpets open with a 5-day look back just to see which sectors are more green (bullish) or red (bearish).
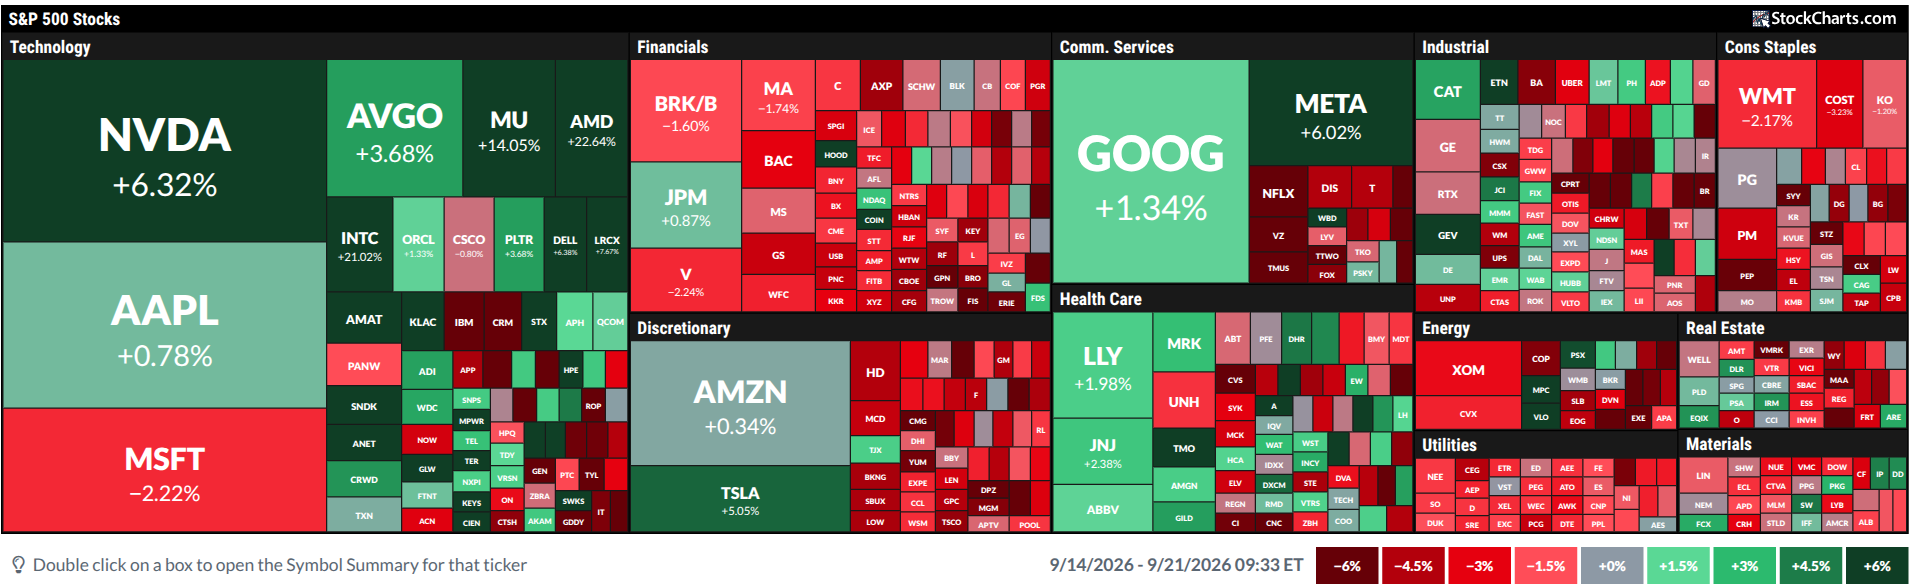
I use this just to see how the different sectors are performing. I prefer this view over the sector ETF view because it gives me more visual detail and nuance. I wouldn’t necessarily decide on stocks based on sector strength (sometimes you want a stock that’s bucking the trend), but it just feels less uncertain to have this heatmap as a reference.
Insider Tip #2: Slope Gives Meaning to Position
The “Price Above” the 200 only tells you where the stock’s trading relative to that average. It doesn’t tell you whether the average itself is looking bullish, bearish, or sideways. So be sure to eyeball the slope.
At this point, I’m looking through each stock, and I’ll highlight a few that caught my eye.
Disclaimer: I’m not giving you stock picks or trading advice. I’m just showing you my thinking with regard to a few stocks that stood out.
Bucking the Trend?
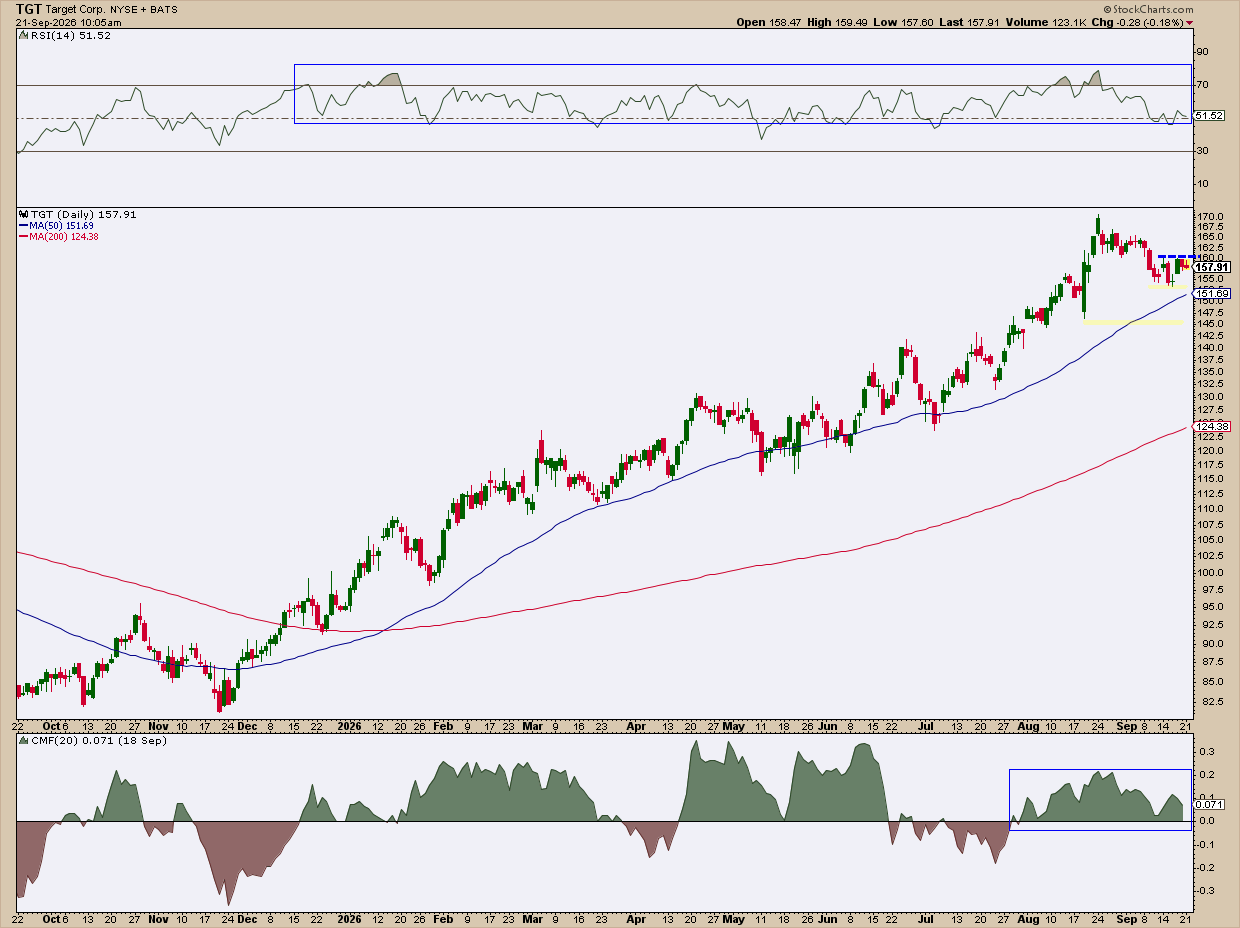
Take a look at Target Corp. (TGT). Remember the MarketCarpets chart? Staples hasn’t performed well over the past week. But TGT appears to be bucking the trend.
My quick assessment:
- It’s been trending up steadily since December 2025.
- With the exception of a dip in May, the Relative Strength Index (RSI) has been cycling between 50 - 70+. This indicates bullish momentum.
- The Chaikin Money Flow (CMF) is above zero, meaning more money is flowing into the stock than out of it.
If I wanted to buy this, I’d probably look for a breakout above $160 with a stop at either $153-ish (an aggressive stop) or at $145, the most recent swing low. Also, I’d anticipate resistance at the $170 range (or a possible break above it).
Time Correction?
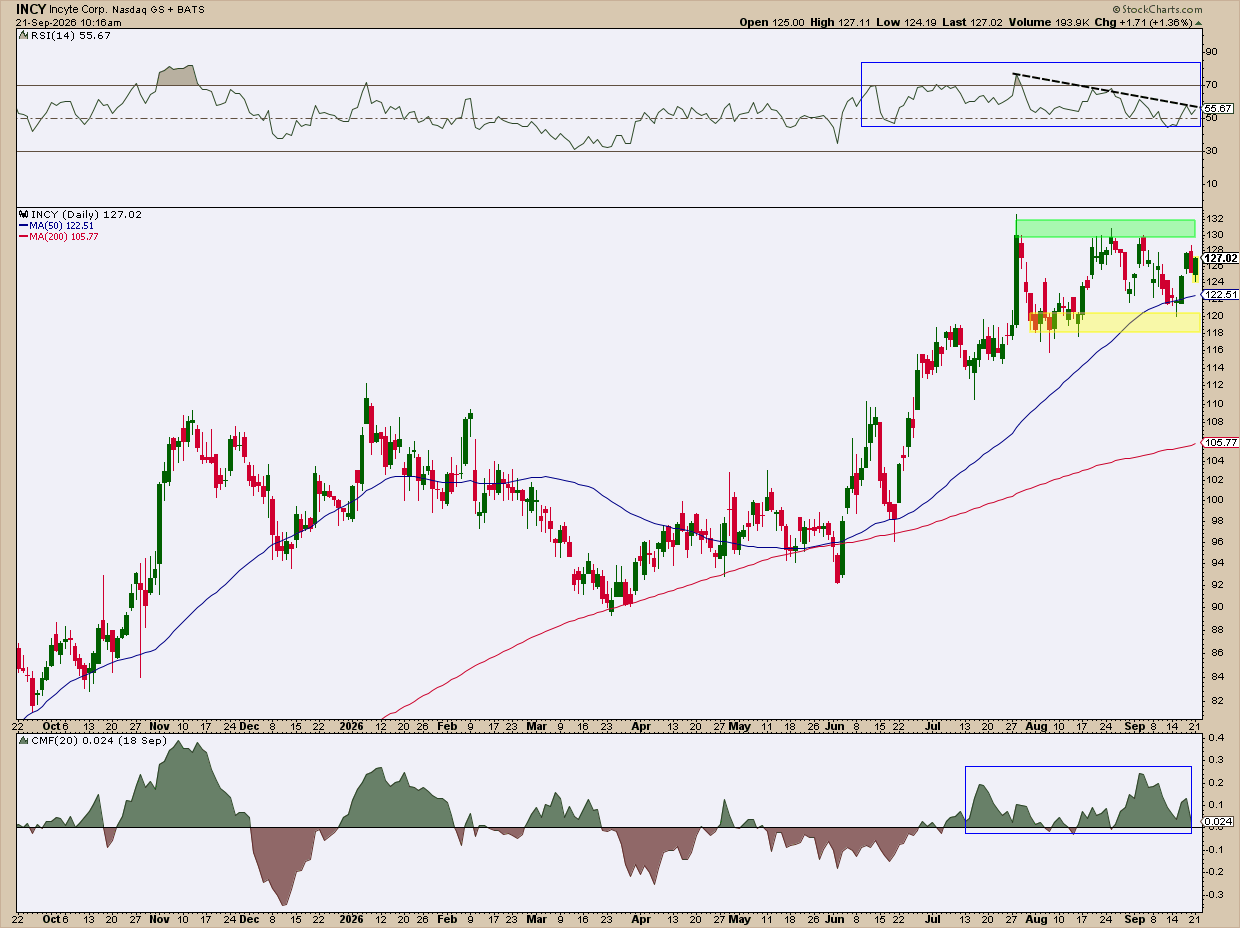
A bunch of names in the Health Care sector seem to be performing decently. Biotech company Incyte Corp. (INCY) happens to be one of them, with a strong SCTR value of 89.
My quick take:
- INCY looks like it’s undergoing a time correction of sorts (more of this in a forthcoming article, BTW).
- RSI is maintaining a bullish range, while momentum appears to be in a bit of a downward slope. Is buying pressure draining away?
- Money flow, according to the CMF, still looks decent.
With decent earnings and relatively strong technicals, INCY is waiting for a catalyst of sorts. There are many key reasons behind a time correction. But the main point is that it’s going sideways. It’s either going to break out or break down. That’s why I highlighted the support and resistance levels (green and yellow shaded areas). These are the levels to watch. They’re also the action triggers for anyone looking to get in, out, or short.
When Down Means Stay Away, At Least For Now
Here’s another dip: Bank of New York Mellon Corp (BNY). As a company, it’s a little confusing. There’s no earnings miss. No guidance miss. No downgrades. So, it’s a good dip to buy, right?
Well, not so fast. It can bounce. It can also fall much further. Either way, it’s a strong stock. But the timing’s premature for any buying action.
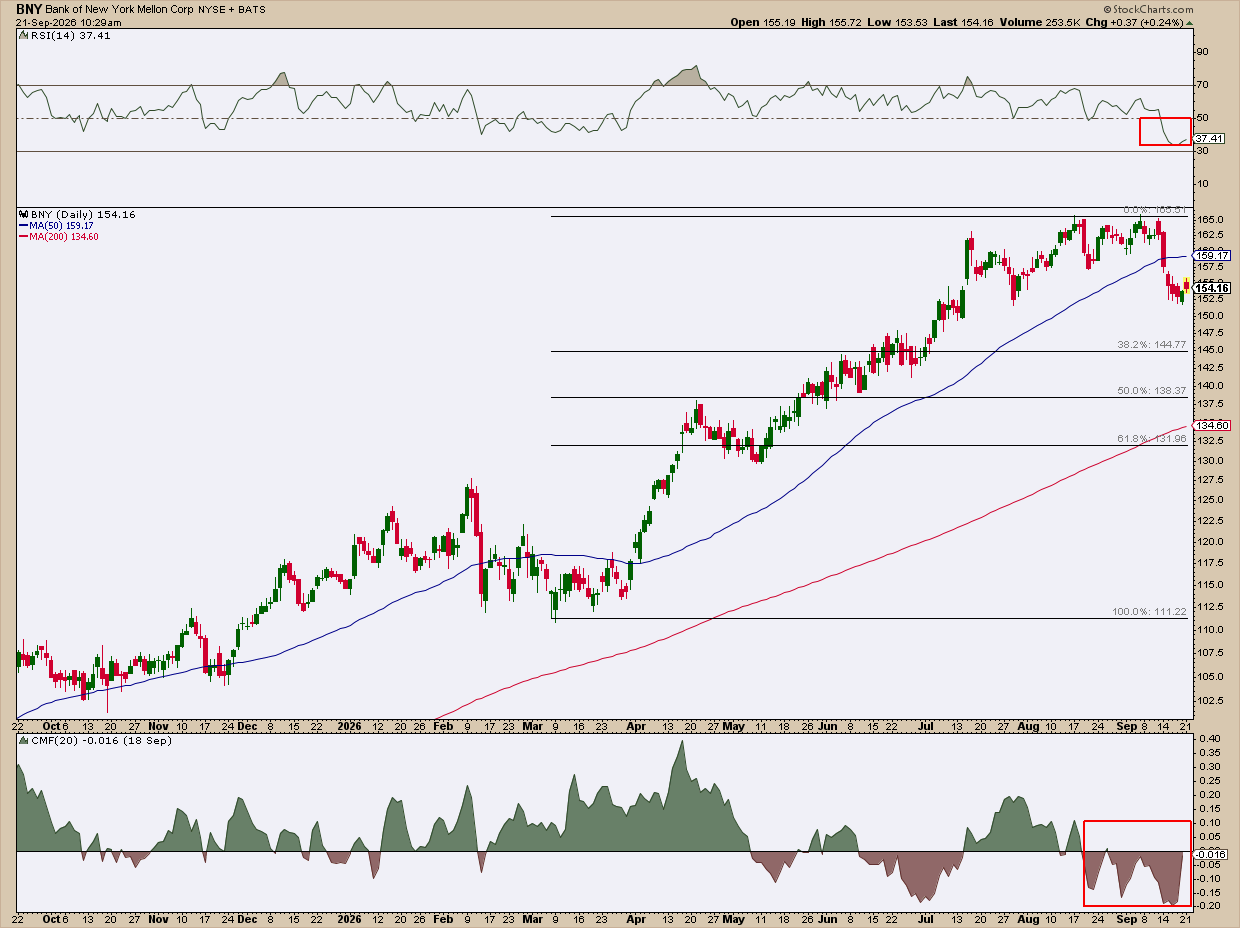
Let's look at some of the red flags. Clearly, BNY’s dipping. While it can certainly bounce, it can also fall near $144, $138, and $131 ranges. Basically, your Fibonacci Retracement levels (38.2%, 50%, and 61.8%) before buyers step in.
The RSI is nearing the 30 level, which might attract buyers, or it can get stuck in the bearish range around 30 and 50. We just don’t know yet. And the CMF being well under zero is telling us that sellers have taken over, as money flow is increasingly negative.
So, what do you do in a situation like this—a fundamentally strong stock with ugly technicals? You wait. Maybe sellers know something that the official reporting hasn’t caught up with. Or maybe the selling’s exaggerated. In this kind of scenario, wait for confirmation of a reversal.
Insider Tip #3: Let Price Confirm Before Buying a Dip.
A stock that’s fundamentally strong but technically weak or vice-versa is always a tricky call. Both aren’t always in sync. Maybe one has to catch up to the other. Or maybe it’s sounding a warning. Either way, always wait for price to confirm. Look at the structure. When price moves, even if it moves prematurely in the wrong direction, the structure will always give you a setup opportunity to manage your trade and minimize your losses.
And That’s a Wrap
Well, there’s your workflow. Pretty simple. Today, this ‘net’ caught 66 names. Some looked good, others not so much. But they all have the same conditions. And that’s what you should expect when using a screener. A screener hands you the right haystack, but it’s your job to find the needle. Try it yourself. Keep MarketCarpets on the side for context (if you wish) and then drill down to find the ones that present better opportunities.