SpaceX Soars, And New Sector Leadership Emerges in October

Key Takeaways
- StockCharts CandleGlance offers a quick, comprehensive view of S&P 500 sector trends.
- Health Care is busting out to new highs, Industrials shows potential bottoming signals, and Materials flashes renewed momentum.
- With tech earnings in focus and 50 trading days left in 2026, sector analysis can help investors spot year-end alpha opportunities.
SpaceX (SPCX) launched tech (related) earnings season. Shares soared 10% by Wednesday morning, helping to lift the Nasdaq 100 (QQQ), while a bullish revenue preannouncement from Super Micro Computer (SMCI) provided support for the chips space. Meta Platforms (META) and Tesla (TSLA) offer the next volatility catalysts, but, from there, traders may be in a holding pattern until other Mag 7 players and mega-caps serve up Q3 results next week.
It's also a data-light stretch, with the Fed in its blackout period before the October 28 rate decision. At times like this, it's critical to prepare your trading strategy at both a stock-specific and sector level. Enter: the StockCharts CandleGlance page.
Fresh Findings from a Trusty Tool
For OG members and novice users of the site, this is truly old-school, but in a good way. I hadn't looked at it in many quarters until this week.
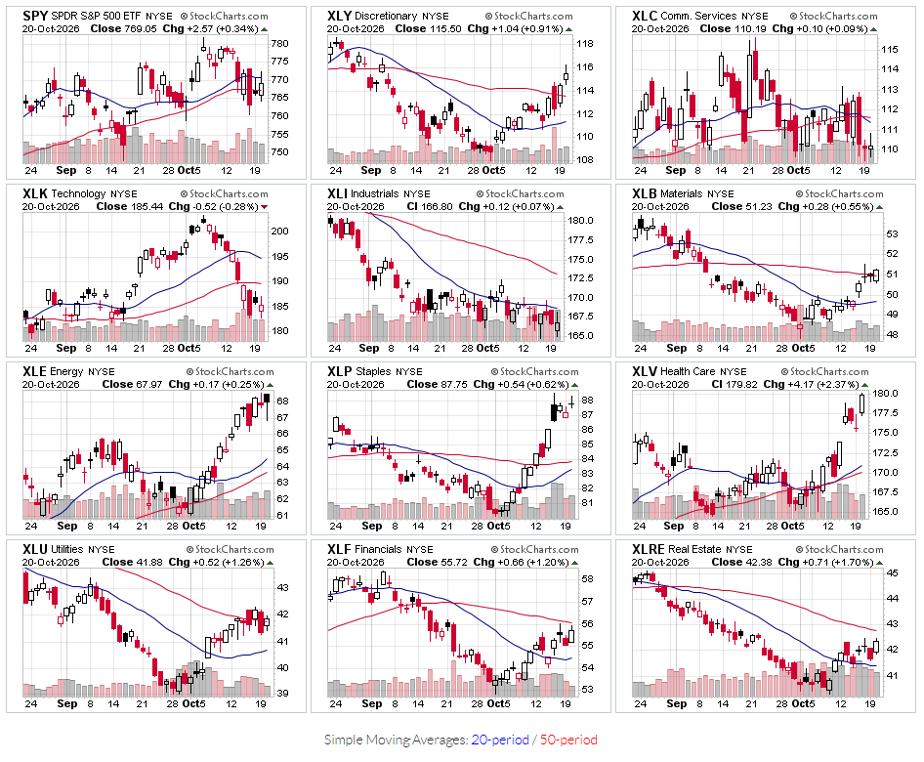
I noticed that Health Care (XLV) was on a heater, notching new highs on the back of record levels tagged by pharma giant Eli Lilly (LLY). The CandleGlance of S&P 500 Sector ETFs is the best single view of sector-level price trends. On one concise page, traders can see which areas are breaking out, breaking down, and doing nothing. That's ideal for swing traders, active investors, and even those seeking to, say, sell calls to generate income.
Let's use the CandleGlance page as a springboard to reveal what's leading the market with just 50 trading days left in 2026.
Health Care Hits New Highs
XLV indeed stands out on the page. The default view of two-month zooms with 50-day and 200-day moving averages plotted says a lot. The Health Care sector ETF scaled new heights this week and is above both moving averages, suggesting bulls control the primary trend. As for near-term volatility catalysts, LLY issues results on Thursday, October 29, BMO, but JNJ and UNH Q3 reports are already in hand.
Zooming out, notice in the chart below that XLV is doing all the right things technically. This week's clean breakout established new support in the mid-$170s (the August peak), while $165 is another layer of potential dip-buying. $160 is longer-term polarity, with the rising 200-DMA coming into the picture there.
What's more, we can calculate a measured-move upside price target based on the depth of the August 2024 to mid-2025 decline and subsequent 2026 breakout. $160 minus $127 is $33. Add $33 to the $160 breakout price, and $193 is our bogey. That means perhaps 7% more upside in the near term. Look to LLY to provide that thrust.
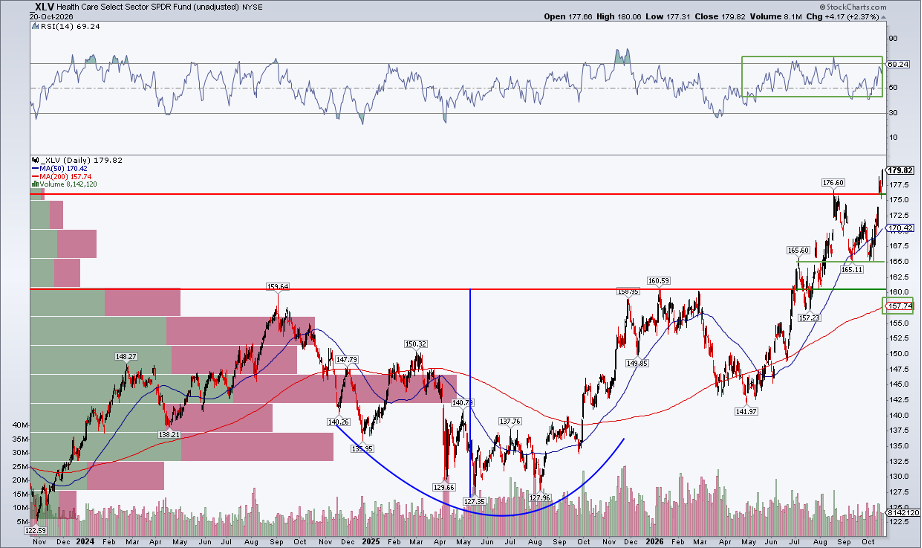
That broad cup-with-handle pattern must be respected, and it coincides with a sanguine RSI signal. The momentum oscillator at the top of the SharpChart ranges in a bullish zone from 40 to 80, confirming the XLV price high. With clear skies above, I expect Health Care leadership through midterms and into year-end.
Industrials Took Its Medicine
There are several compelling stories to be told stemming from the CandleGlance page, but Industrials might not jump out. I think it deserves attention. To be clear, there are plenty of spooky Industrials indicators occurring with Halloween on the doorstep (which is a very bullish seasonal point on the calendar, by the way).
Let's start with the scary stuff. A bearish death cross is imminent; the 50-DMA will slip below the 200-DMA in the coming sessions regardless of whether price keeps drifting lower. The RSI has been sub-50 for almost two months, as well. Furthermore, there are plenty of dead bodies left from the failed August breakout.
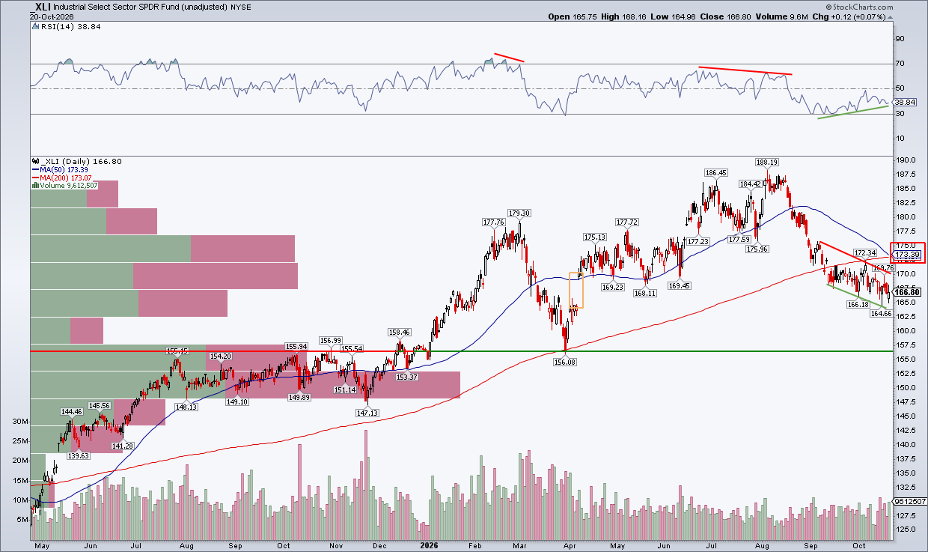
What's encouraging? I see bullish RSI divergence. Also, the current price pattern is not a bearish continuation feature, but is more akin to a bullish falling wedge. And with major long-term support above $155, the downside is likely limited from here. Was the 13% correction enough to satisfy the bears? Maybe. I'd also call out that its April 8 gap was finally filled last week... another possible bottoming flashpoint.
Earnings Season: It's All About Expectations
Elsewhere, as Tech (XLK) and Comm Services (XLC) sag into their major earnings stretch, the bar has clearly been lower. I assert that the market generals may be setting up well. There are parallels between mega-cap Tech and Financials.
Recall that the big banks traded awful ahead of their Q3 reports. What happened? XLF rallied through the reporting stretch, closing Tuesday at a month-to-date high. Lowered expectations are a bull's best friend when it comes to earnings season.
Look Here for Sneaky Strength
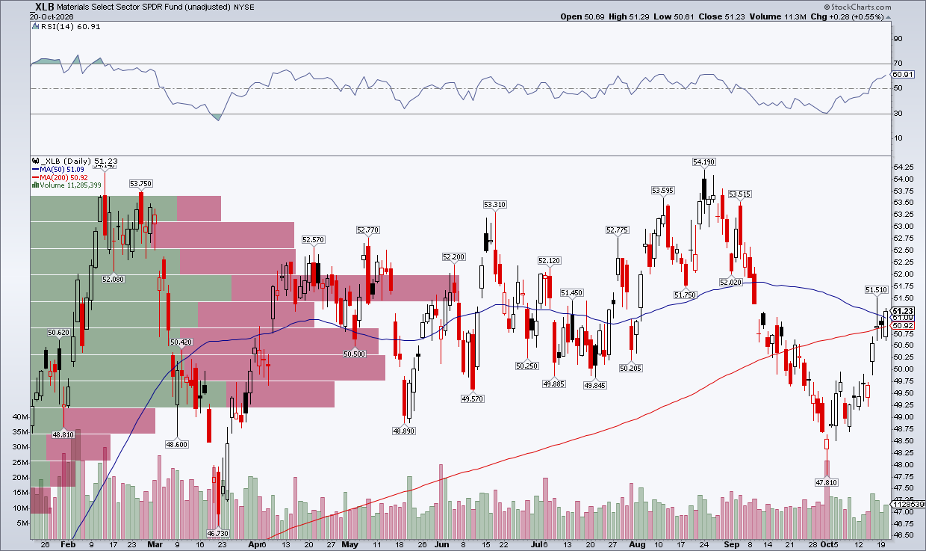
One last point. CandleGlance opened my eyes to a potential V-bottom in Materials (XLB). The resource niche of the S&P 500 has been higher in all but two sessions since October 2. Tuesday's price action featured a bullish marubozu engulfing candlestick, with price hurdling the 200-DMA. Few folks are talking Materials these days, but the small space sports solid absolute and relative strength.
The Bottom Line
Among all of StockCharts' new features, tools, and indicators, sometimes I just revert to what's tried and true. CandleGlance is the best way to view sector (and other areas and asset-class) trends. In a single pane, you can see what's hot and what's not. Technical analysis is often about clearing a chart and just accepting what price says. Trends are loud in areas like Health Care, but also subtle, as seen in Industrials.
Disclaimer: This blog is for educational purposes only and should not be construed as financial advice. The ideas and strategies should never be used without first assessing your own personal and financial situation, or without consulting a financial professional.