StockCharts Insider Investigates: Is Losing the 200-Day Really a Bleak Signal for the Nasdaq and S&P 500?
Before We Dive In…
NOTHING GOOD HAPPENS BELOW THE 200-DAY SMA… so we’ve heard. Well, the S&P 500 ($SPX) and the Nasdaq Composite ($COMPQ) crossed that line. Cue the alarms: “The market’s toast.” “It’s all about caution and defense.” “This is how 2022 started.”
Maybe. Maybe not. Doom-and-gloom vibes resonate. But aren’t you curious? How many times have these two indexes slipped below the 200-day, and what happened next? StockCharts’ Historical Price Data can tell you.
You know…this page:
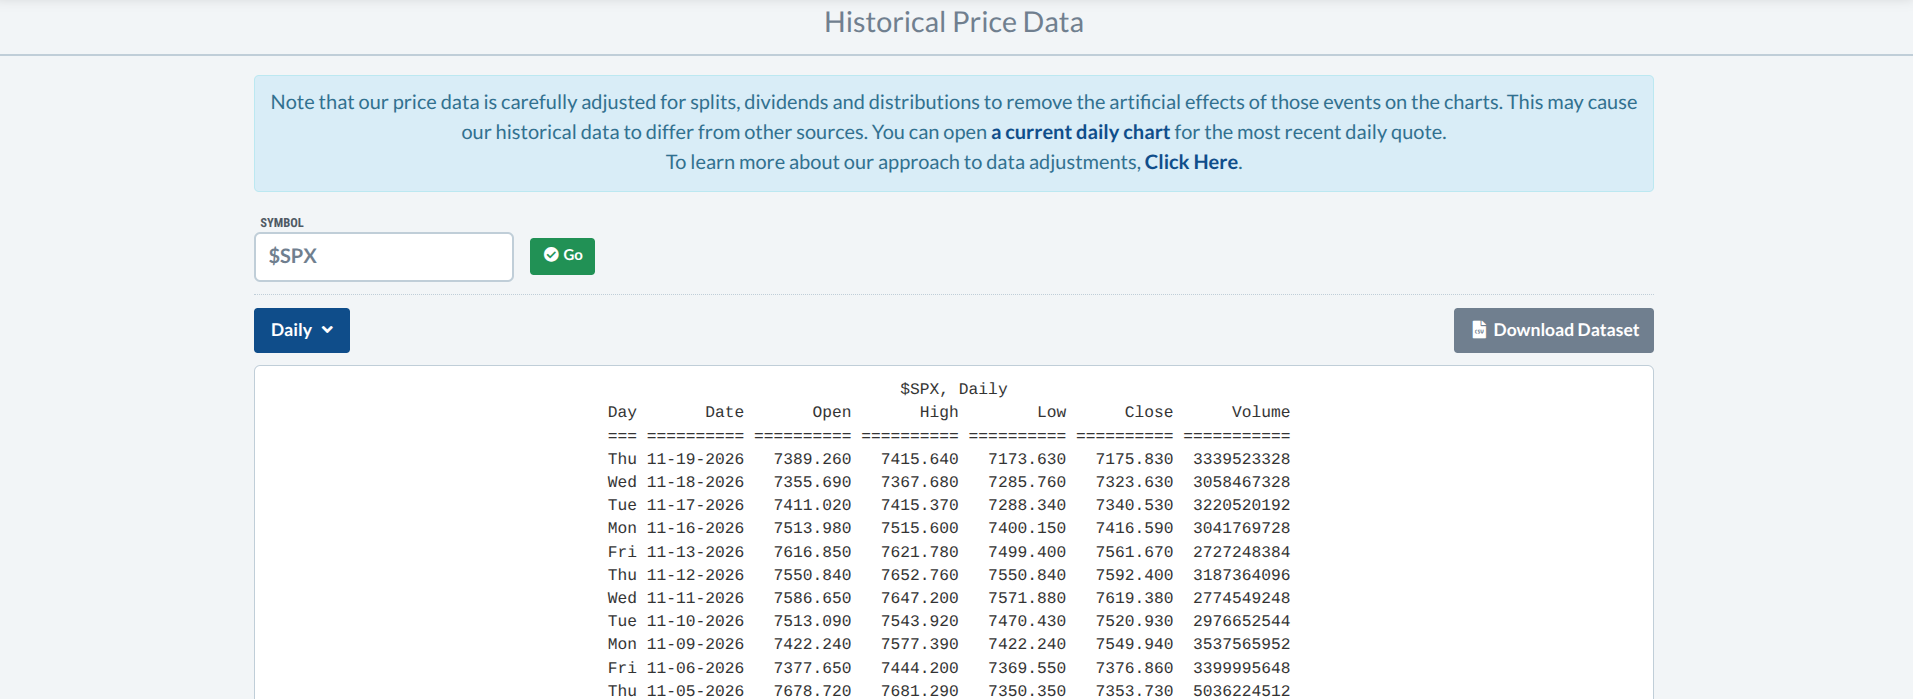
So, let’s cut past the alarmist rhetoric and get to the data. Of course, this doesn’t predict anything, but it gives you a clear picture of what happened before, plus a few cues for when things might be going south fast.
Editor’s Note: Written November 20, 2026. Levels reflect that date.
Plot Twist: The Dip Usually Got Bought
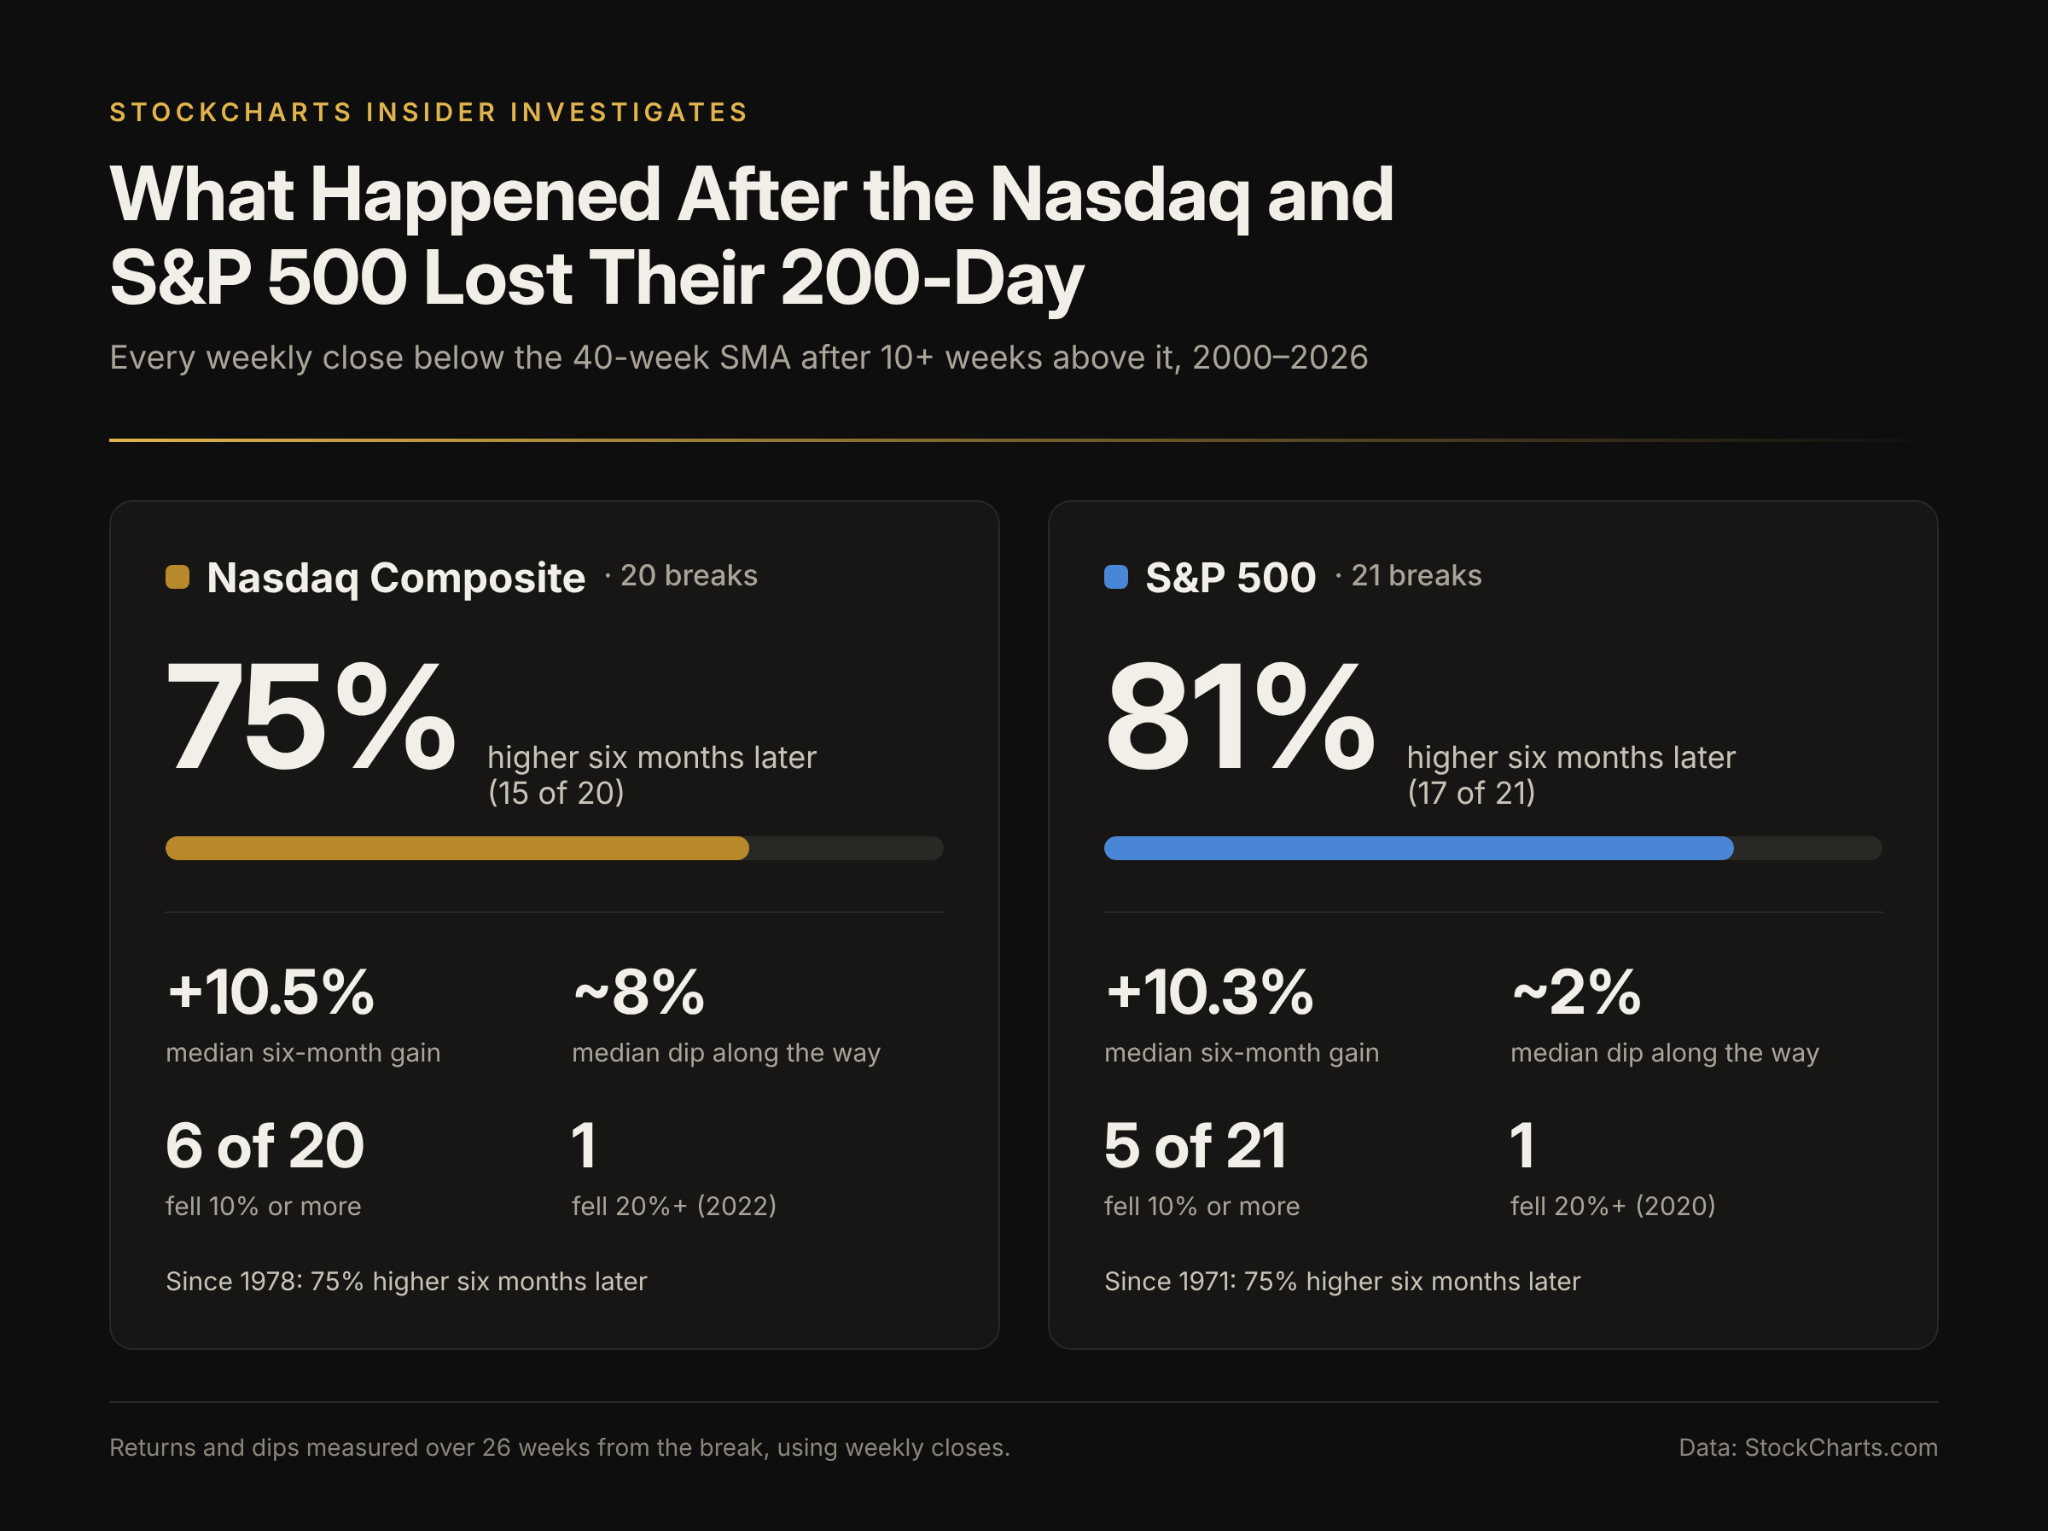
Since 2000, the Nasdaq slipped under the 200-day line 20 times. Fast forward six months and 15 of those slips recovered. The median gain was 10.5%. Go back to 1978 and it's the same story. Of all the slips, 75% were higher six months later.
In short, what felt like a cliff turned out to be a deep pothole.
The S&P is pretty similar. It’s calmer, though. Since 2000, the S&P lost the line 21 times, but 17 of those dives were higher six months later. Median gain was 10.3%. Five fell 10% or more, and the 2020 crash went past 20%. Since 1971, 75% of S&P breaks were higher six months later.
What does this mean? Well, if you bailed on every break, you would have missed a lot of rallies.
Shakeout or Breakdown? Check Week Four
If you split the 20 Nasdaq breaks by what happened next, you get two different groups:
- Back above the line within four weeks (13 cases): For these, it was a false alarm. Most of the dips weren’t too deep (under 5% median).
- Still below after four weeks (7 cases): This is the danger zone. Five of the seven fell 10% or more. Here’s the roster: 2008 financial crisis, 2018, the 2020 pandemic crash, 2022, and the early-2025 tariff selloff.
The S&P is trickier, as it bounced back almost every time, i.e. 18 of its 21 breaks since 2000. But a quick bounce was no all-clear. In 2011, 2018 and 2022, even after it clawed its way back over the line, it plunged again, 10% or more. So, on the S&P, staying below the line is a warning, but getting back above doesn’t always signal safety either.
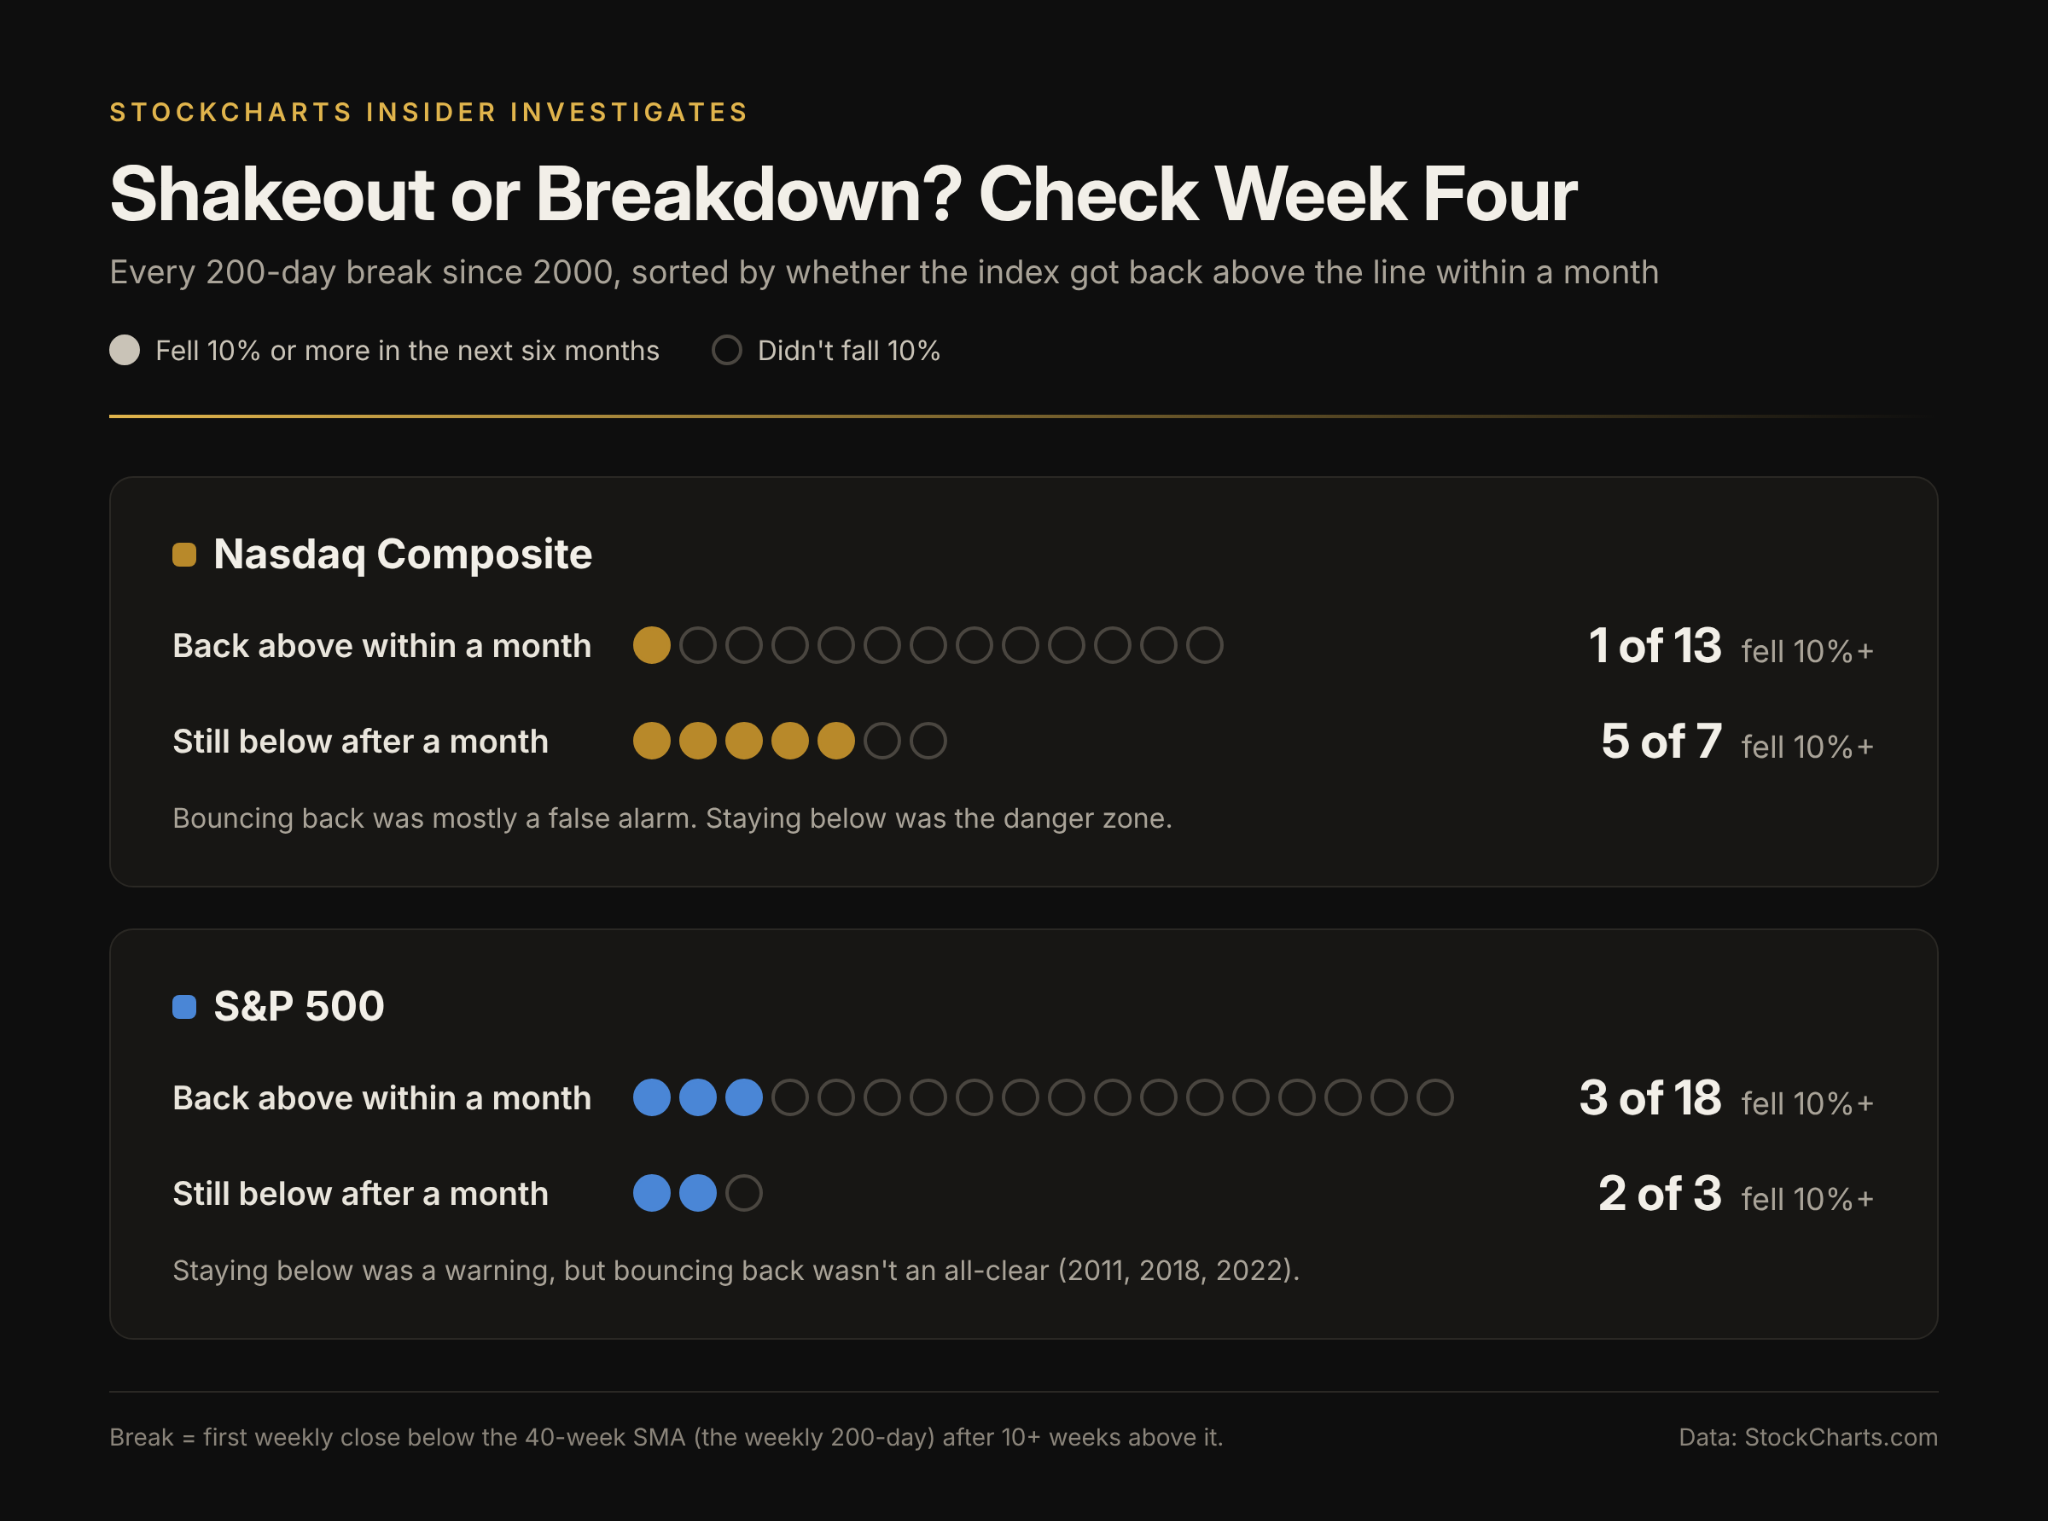
Takeaway: the break tells you zilch. The next four weeks tell you plenty.
Putting the Four-Week Test to Work
So, how do we make this actionable? Next time the Nasdaq or S&P closes below its 200-day SMA, or 40-week line (the weekly version of the 200-day), here’s the drill:
- Mark the break week. That first week is your starting line. Week 1 starts after the break week.
- Count four weekly closes. Your deadline.
- Back above the line? It might be a shakeout, but watch the market structure in case it’s setting up for another leg down.
- Still below? Brace for a rough ride. In this crowd, 10% drops were common.
LOOK: During those four weeks, you’ll probably spot chart patterns, Fibonacci retracements, and shifts in market structure (or, for younger traders, BOS and CHoCH). You’re probably following the news and economic reports, too.
All of it is fair game. Your tools will tell you what to do next. I’m just giving you some history that tells you how often the drop really mattered.
Case in Point: November 2026
Take a look at the Nasdaq.
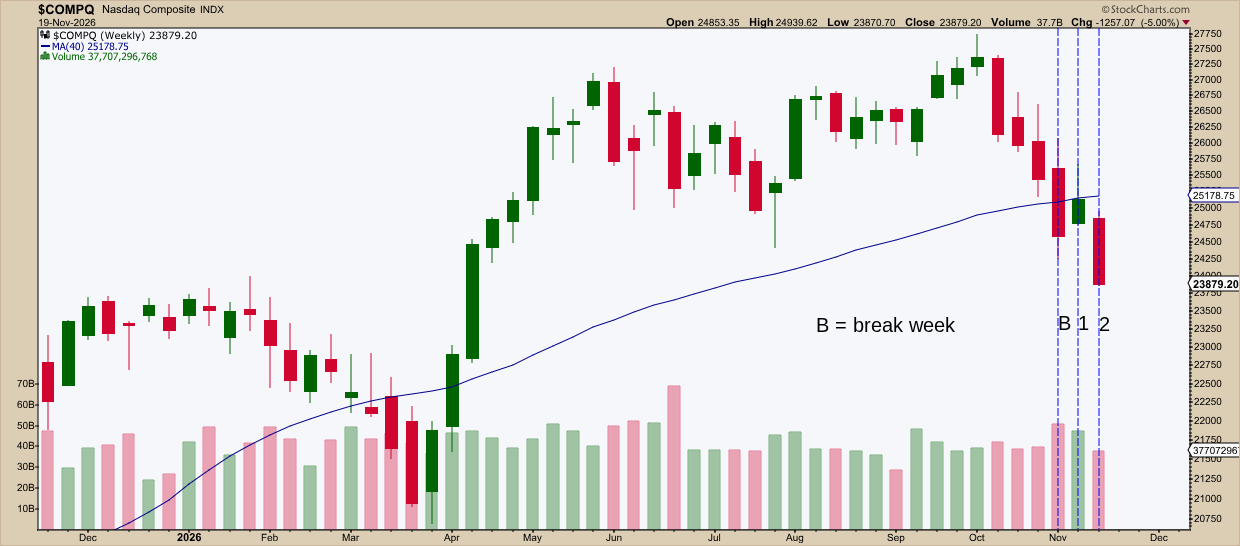
The Nasdaq broke the week of November 6, closing at 24,579. The next week, it bounced, missing the line by a hair. This week, or at the time of writing, it’s down around 5%. Can it get back above its 40-week in the next couple of weeks? It’s possible, but, the longer it lingers down here, the more it’s starting to look like a danger zone.
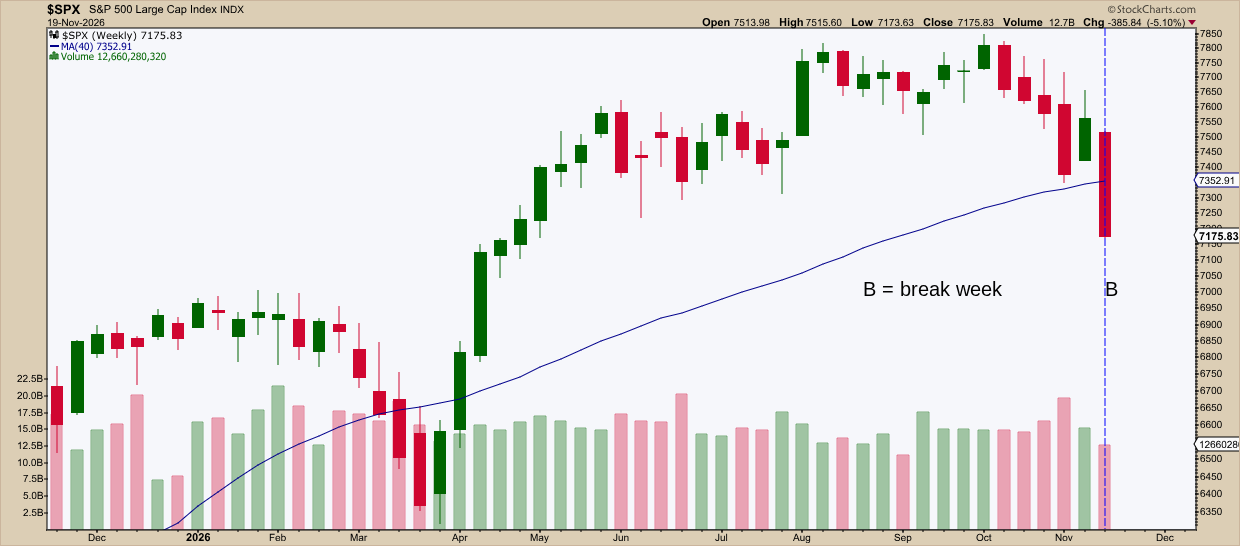
The S&P just broke below its 40-week. If the week’s close confirms it, the S&P’s four-week clock runs to December 18.
How I Tested This
I don’t know if you’re part of the spreadsheet crowd. But if you are, this one’s for you. First, an Insider Tip.
Insider Tip: Use a weekly chart.
Before, we’ve been talking about the 200-day SMA, so why weekly now? Well, when testing on a daily chart, the indexes can slice through their 200-day several times in a few weeks. Weekly closes filter out that noise.
- Data: Weekly $COMPQ closes since 2000 (cross-checked back to 1978) and weekly $SPX closes since 2000 (cross-checked back to 1971).
- Line: The 40-week simple moving average.
- Signal: The first weekly close below it after 10+ straight weeks above.
- Measured: Check the return six months later, the deepest decline along the way, and whether the index closed back above the line within four weeks.
If you want, try it yourself using StockCharts’ Historical Price Data resource.
And That's a Wrap
For many investors, a drop below the 200-day (or 40-week) sounds like a smoke detector going off. But is there a fire, or is it just picking up your burnt toast? Check the kitchen and house. You know the drill. Good luck!
Disclaimer: This article is for educational purposes only and isn't investment advice. Past performance doesn't guarantee future results.