What RRGs Reveal About Small Caps vs. Large Caps

Key Takeaways
- The Invesco S&P SmallCap Health Care Sector ETF (PSCH) shows strong positive rotation, signaling potential upside.
- Both small-cap consumer sectors are moving into the leading quadrant, indicating a relative uptrend.
- The Invesco S&P SmallCap Energy ETF (PSCE) is weakening, with high odds of moving into the lagging quadrant.
- The small-cap technology sector is in a relative downtrend, with potential for further decline.
Exploring Small-Cap Sector Rotation with Relative Rotation Graphs
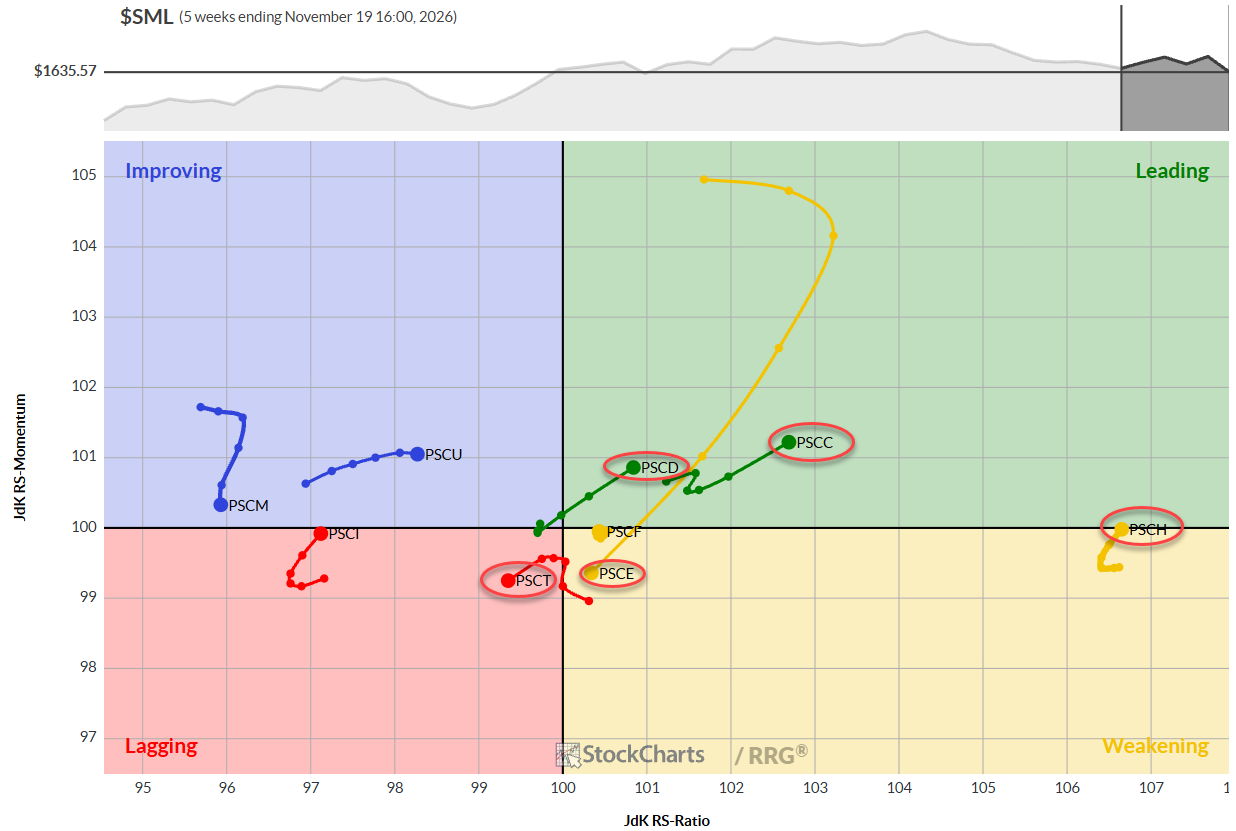
When most investors think about Relative Rotation Graphs (RRGs), they often picture the classic visualization of the 11 S&P sectors, typically using the SPDR sector ETFs from State Street. However, RRGs can reveal much more than just the relationships among large-cap sectors. One particularly interesting application is to examine the small-cap equivalents, represented by a series of sector ETFs managed by Invesco. These Invesco S&P Small Cap sector ETFs let us plot and analyze small-cap sector rotation, offering fresh insights distinct from their large-cap counterparts.
Comparing Small-Cap and Large-Cap Sector Rotations
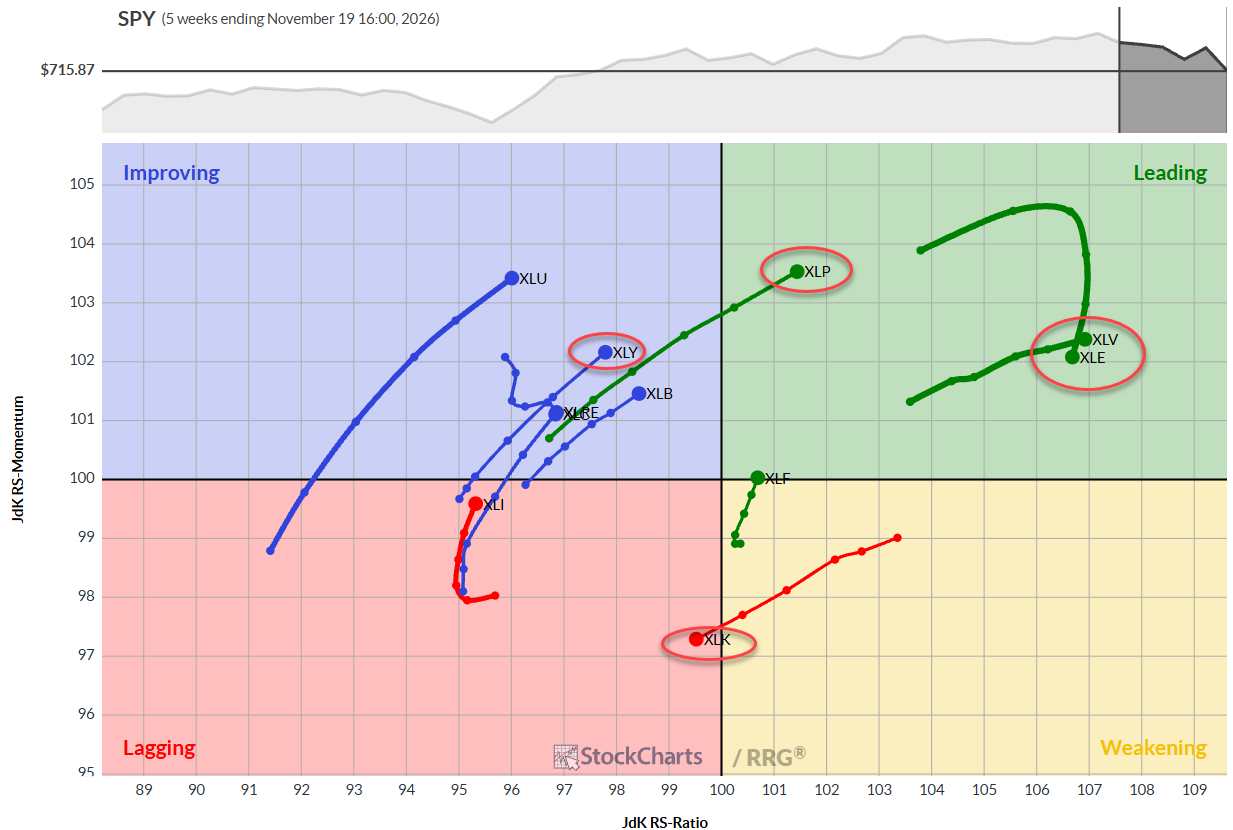
For reference, I have added the large-cap sector RRG below. Comparing this RRG with the small-cap RRG above reveals that there are significant differences between the positioning and the rotations of the various sectors. I have highlighted the same sectors on both RRGs.
Key Observations from the Small-Cap RRG
Health Care Sector (PSCH): The most striking observation is the Health Care sector's position. PSCH is positioned far to the right, indicating strong relative strength. It has just completed a rotation from leading through weakening and is now moving back into the leading quadrant with a positive heading—a very bullish sign. On the large-cap RRG, XLV is pushing further into the leading quadrant; it has not yet made a rotation leading-weakening-leading.
Consumer Sectors: Both Consumer Staples and Consumer Discretionary sectors are showing strong, positive rotations. This is particularly interesting because these sectors often move in opposite directions—Staples are considered defensive while Discretionary is considered offensive. At the moment, however, they are moving in tandem on both RRGs. On the Large Cap RRG, Staples is already inside leading, while Discretionary is still inside improving. The small-cap equivalents are both comfortably inside the leading quadrant and pushing further into it, suggesting a continued relative uptrend for both sectors.
Technology and Energy Sectors: In contrast, technology (PSCT) and energy (PSCE) are showing much weaker tails. Technology is firmly in the lagging quadrant, having failed to regain relative momentum, and is now pushing further into negative territory. PSCE, with the longest tail on the small-cap RRG, has rapidly rotated from leading to weakening and is now heading toward the lagging quadrant. The length and direction of the tail suggest a powerful move, and the odds are high that PSCE will soon cross into the lagging quadrant. On the large-cap RRG, XLE is still deep inside the leading quadrant. The sector lost some relative momentum but is still at a very high RS-Ratio reading.
Sector-Specific Chart Analysis
Healthcare (PSCH)
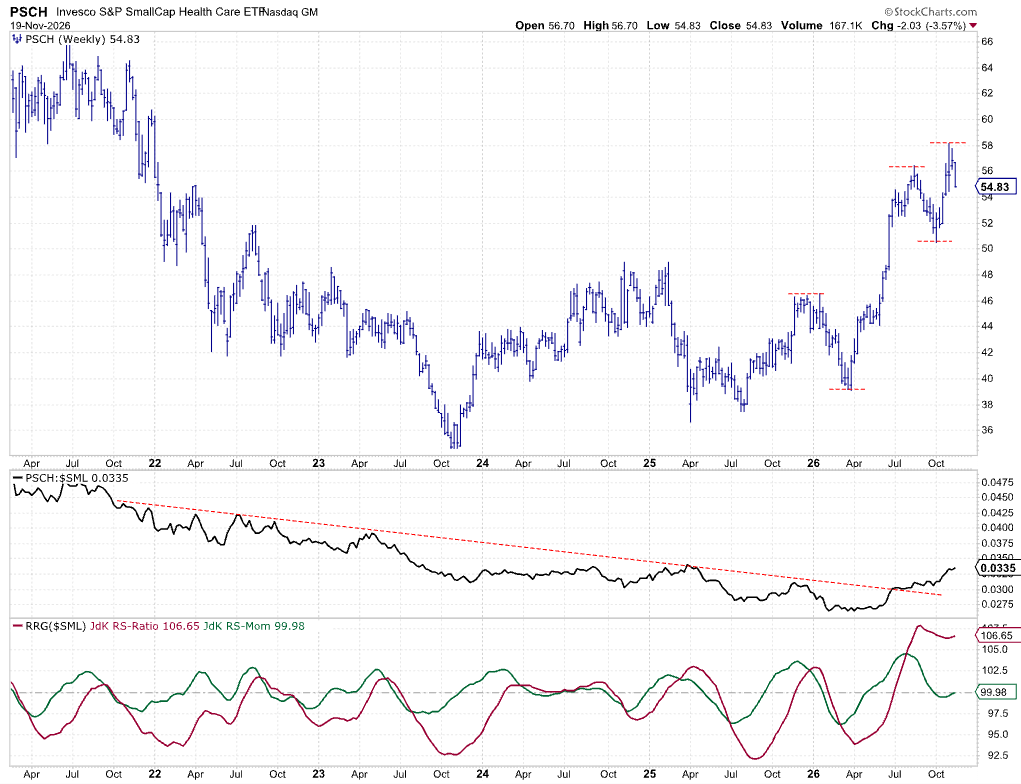
The small-cap healthcare price chart recently hit a new high, maintaining a pattern of higher highs and higher lows. Although there has been a slight pullback this week, it follows a strong rally and is not yet a cause for concern. The most compelling signal comes from the relative strength charts: the Raw RS line broke out of a four-year downtrend in July, and both the RS-ratio and RS-momentum lines are now moving higher. This points to continued relative outperformance for healthcare in the coming weeks.
Energy (PSCE)
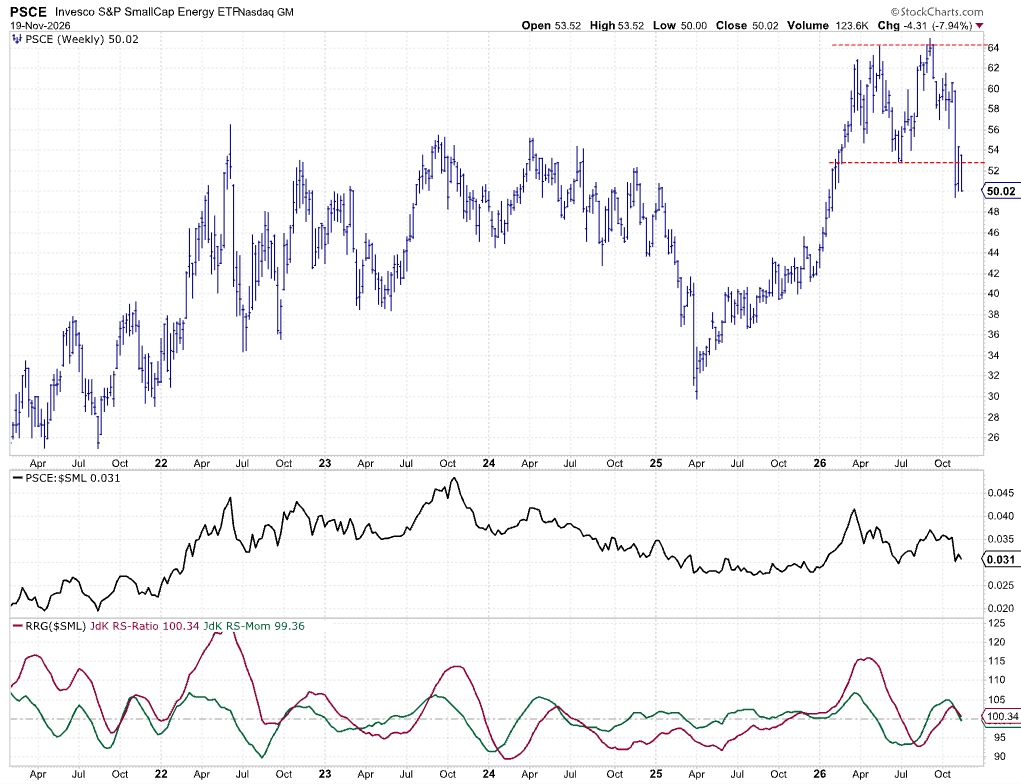
Energy tells a different story. The price chart shows a completed double top, with prices now trading below this bearish pattern. The measured move from the double top suggests a downside target around $42, aligning with some previous support and resistance levels. The Raw Relative Strength line is holding above its previous low but, if it breaks, further downside acceleration is likely. Both RRG lines are trending down and are about to cross below 100, which would confirm the sector’s weakness.
Technology (PSCT)
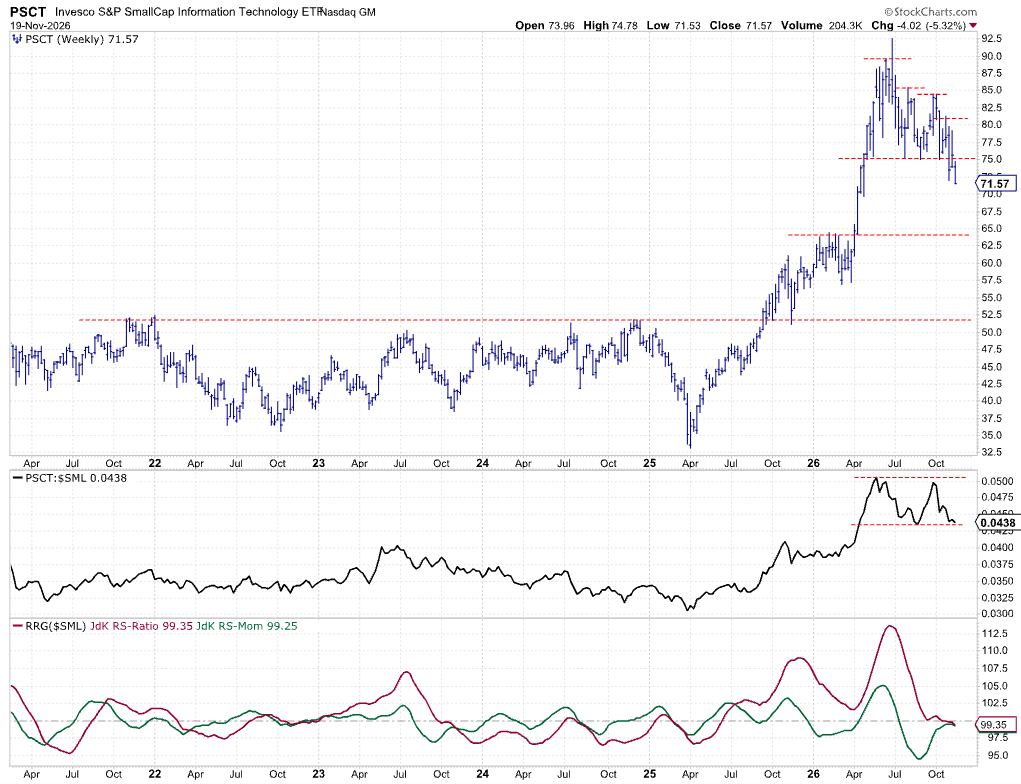
Small-cap technology has been forming a topping pattern since mid-year, with a clear series of lower highs. Support around $75 was broken two weeks ago, and prices are now moving toward the next support cluster near $64. The Raw Relative Strength chart hints at a developing double top, and a break below the previous low would likely trigger further relative weakness. The RRG lines have already started to move lower, pushing technology deeper into the lagging quadrant.
Conclusion: Where to Focus in Small-Cap Sectors
The current rotation among small-cap sectors highlights healthcare (PSCH) and both consumer sectors (staples and discretionary) as areas of relative strength and potential opportunity. In contrast, caution is warranted for energy (PSCE) and technology (PSCT), both of which are showing signs of further weakness. By leveraging RRGs to analyze small-cap sector rotations, investors can gain valuable insights into where relative strength (and weakness) is emerging within the market; compare these rotations with large-cap sector rotations to help steer shifts to a different market-cap tier.
#StayAlert, --Julius