Can a Bullish Breadth Thrust Save This Market?

With the S&P 500 ($SPX) failing to find support through a week of potential AI catalysts, as well as market breadth conditions continuing to deteriorate, equities appear to be confirming a bearish posture going into the end of the week. Investors have been left to watch the bright red glow of the StockCharts MarketCarpet, searching for any signs of optimism as the situation grows more dire.
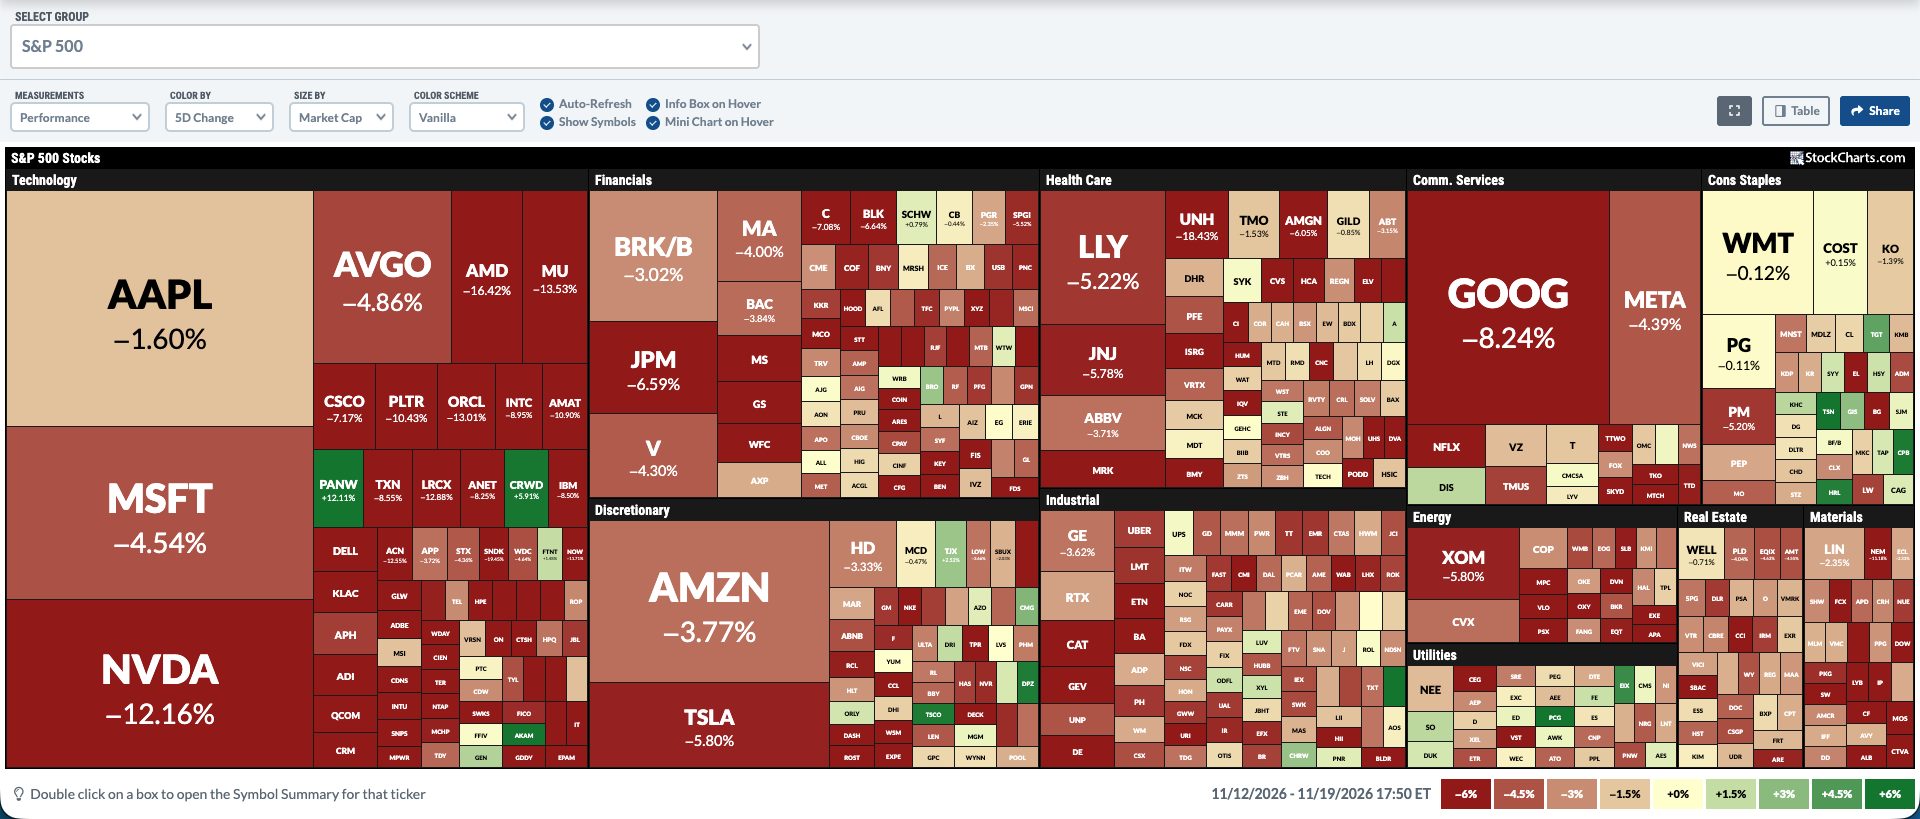
While most market breadth indicators are confirming the current downtrend phase, a quick study of previous market corrections reveals one breadth indicator that has a fairly strong track record of confirming a major low. While that doesn't help investors today, it means that this chart is a key one to watch in the days and weeks to come.
Weaker Breadth Means Weaker Markets
We’ve been covering the S&P 500’s breakdown of moving average support on our daily market recap show, but the most concerning downturns I’ve observed are in measures of market breadth. That's because if mega-cap growth stocks are struggling, but key stocks in other sectors remain strong, then the benchmarks will tend to remain relatively stable.
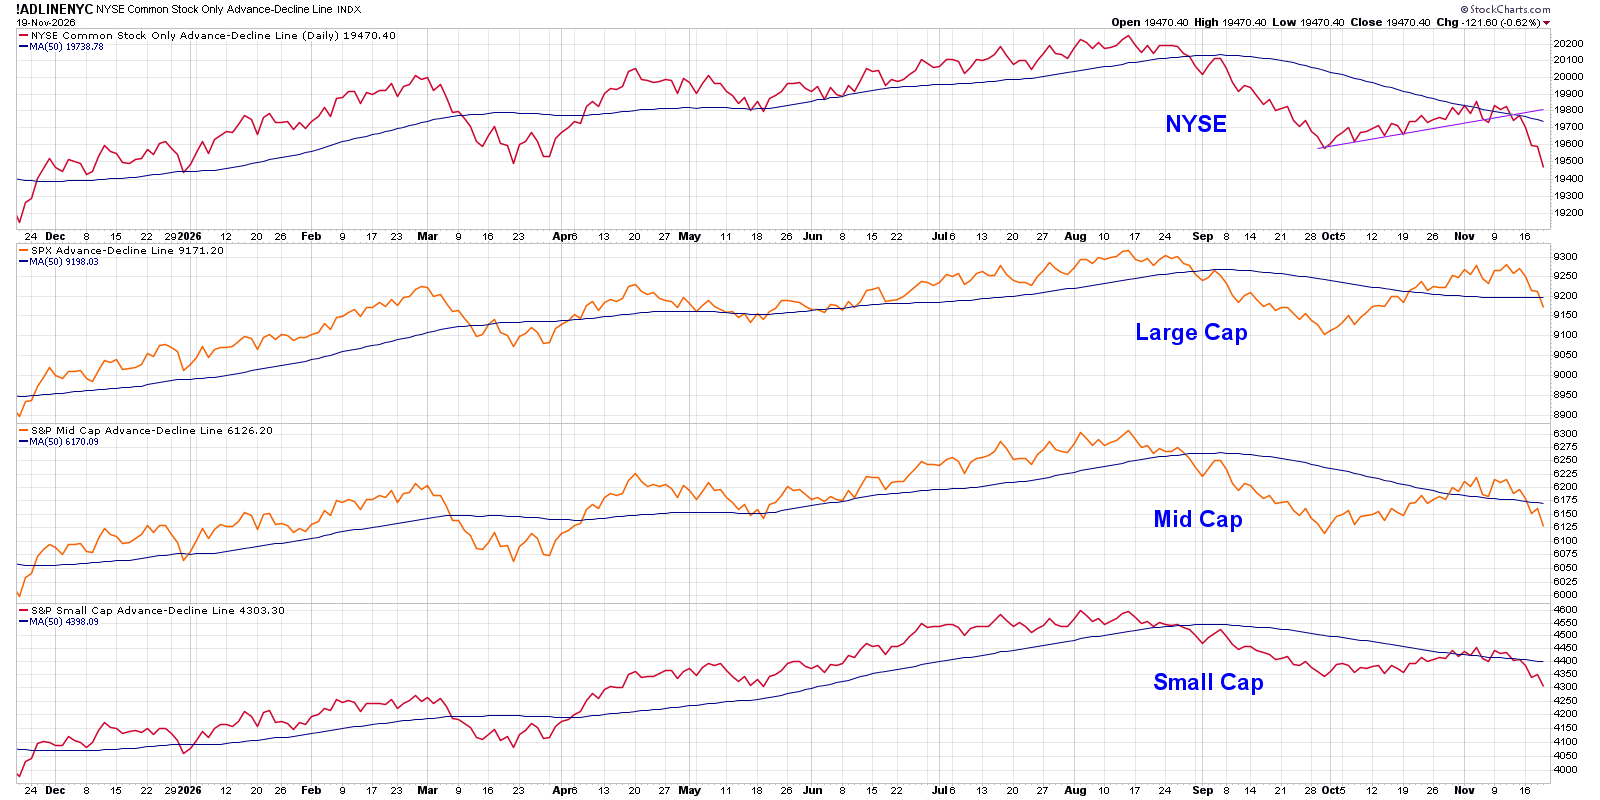
But as the cumulative advance-decline line for the New York Stock Exchange fails to regain its 50-day moving average and then makes another new three-month low, I’m seeing this as a more broad decline with downside participation across the board.
A Breadth Thrust Would Suggest an Influx of Buyers
When market breadth conditions begin to hit extremely negative levels, I’m inclined to watch for a “breadth thrust” off the lows. During a breadth thrust, what essentially happens is that the breadth conditions go from very negative to very positive in a very short window of time. There are a number of versions out there, but I tend to favor the one credited to legendary market strategist Marty Zweig.
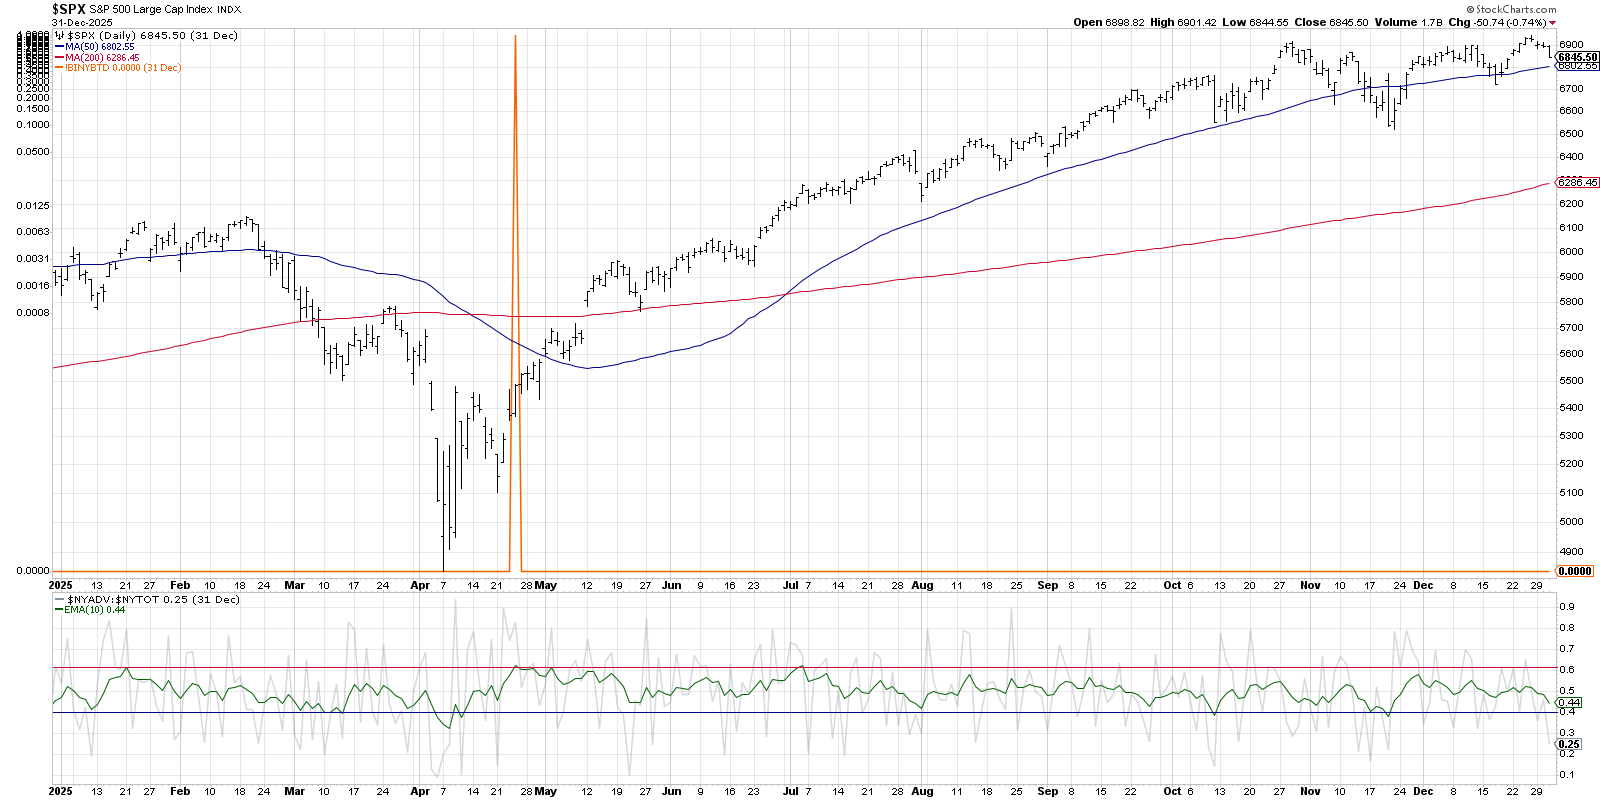
Coming off the April 2025 “tariff tantrum” low, we experienced a Zweig Breadth Thrust signal after an influx of buying power. Basically, the 10-day exponential moving average of NYSE advancers as a percentage of total NYSE listings moved from below 40% to above 62%. And the key to the indicator is that this bullish rotation needs to occur in 10 trading days or less.
A Zweig Breadth Thrust is a rare occurrence. It’s difficult for the breadth to rotate from such a negative value to a strong positive reading unless there’s a huge influx of willing buyers to push prices back higher.
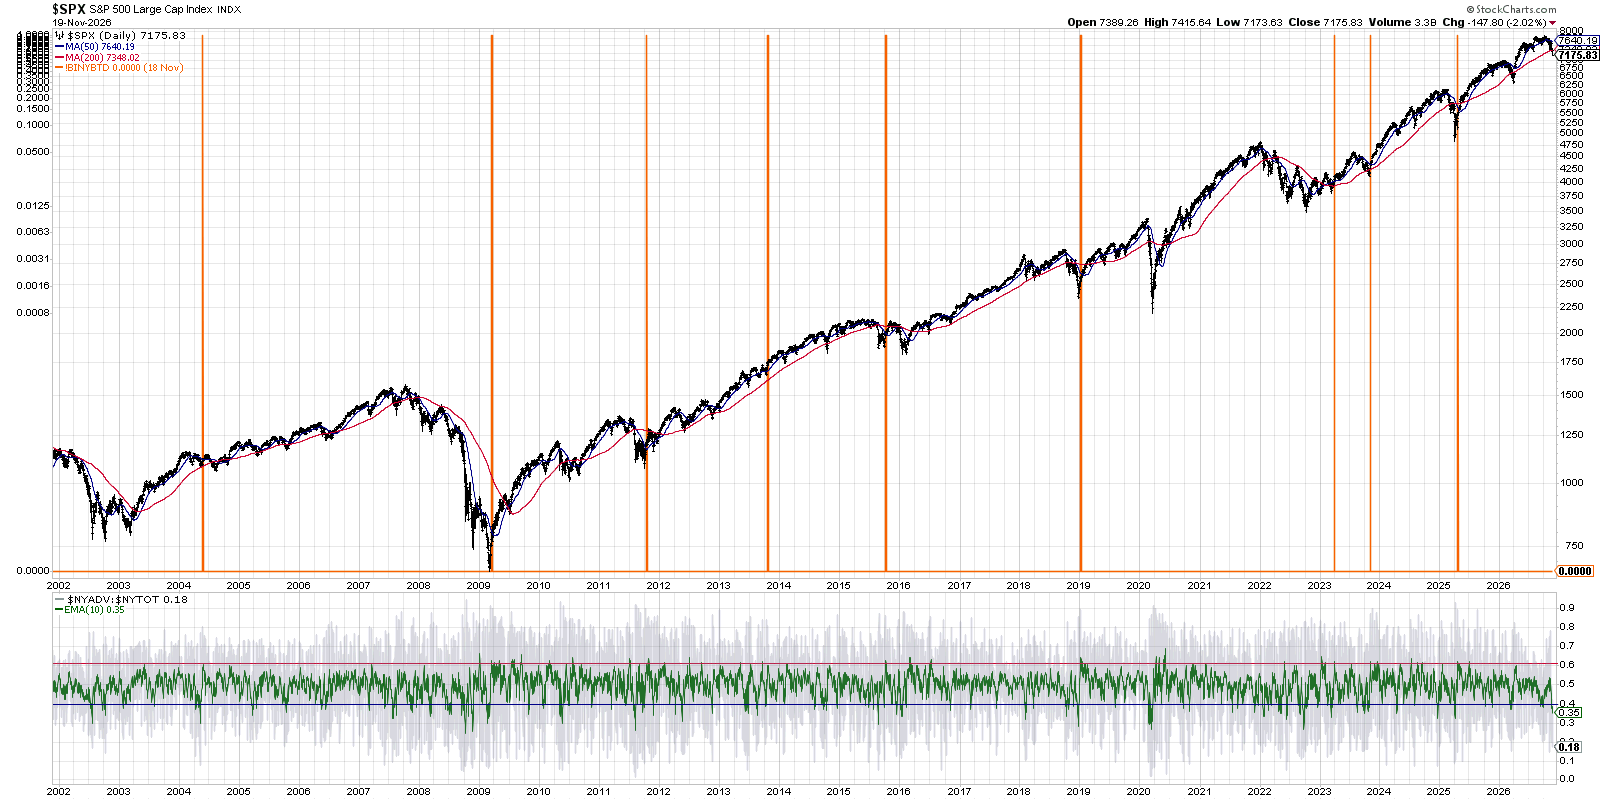
Going back to the 2002 market low, we can observe nine confirmed Zweig Breadth Thrust signals. In just two occurrences (2015 and 2004), the S&P 500 made a lower low before resuming an uptrend phase. And in all nine instances, the S&P 500 was higher 12 months later.
The Zweig Breadth Thrust Has Initiated, But Not Confirmed
So where does this leave us in November 2026? Basically, the breadth thrust has been initiated, as the indicator is down to 35% as of Thursday’s close. This means that, between now and early December, the indicator would need to rotate back up to 62% to confirm the influx of buying power.
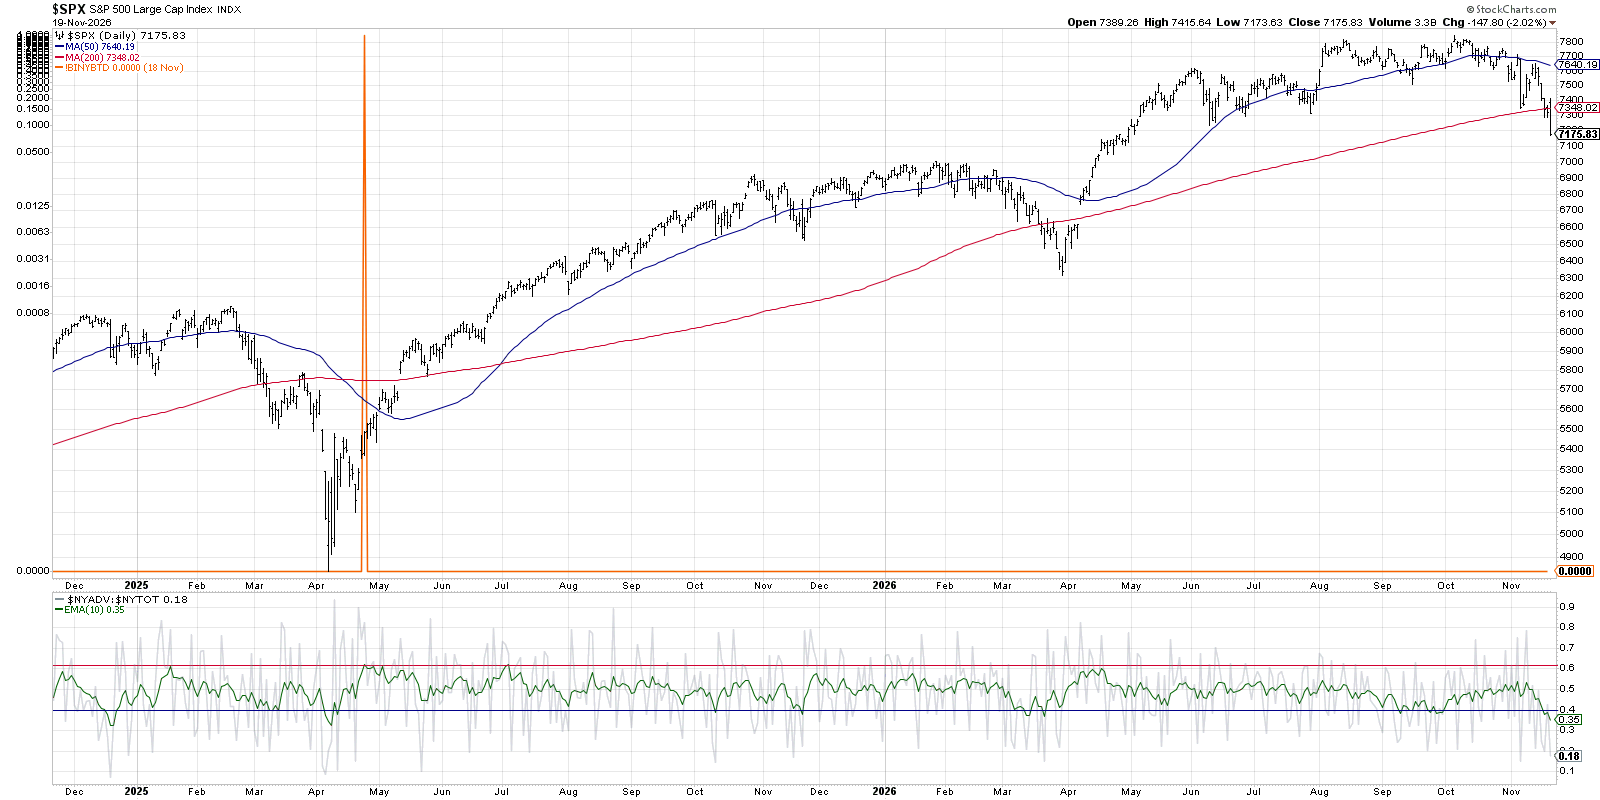
Now, not all major lows necessarily involve a breadth thrust. Coming out of the March 2026 market low, there just wasn’t enough improvement in breadth to validate the indicator. But, given the success rate of this market indicator, I’ve found that watching for a positive signal can provide a fantastic confirmation that the market has found its bottom and equities are bound for much further upside.
RR#6,
Dave
P.S. Ready to upgrade your investment process? Check out my free behavioral investing course!
David Keller, CMT
President and Chief Strategist
Sierra Alpha Research LLC
marketmisbehavior.com
https://www.youtube.com/@DKellerCMT
Disclaimer: This blog is for educational purposes only and should not be construed as financial advice. The ideas and strategies should never be used without first assessing your own personal and financial situation, or without consulting a financial professional.
The author does not have a position in mentioned securities at the time of publication. Any opinions expressed herein are solely those of the author and do not in any way represent the views or opinions of any other person or entity.