What Could Go Wrong? Ask the Equal-Weight S&P 500 ETF, Yield Spreads, and Junk Bonds
Key Takeaways
- S&P 500 EW ETF stumbles as double top takes shape.
- Yield spreads show stress in credit markets.
- Junk bonds, the canary in the bond market, extend lower.
What a difference a week makes. Last Friday, the Invesco S&P 500 Equal Weight ETF (RSP) was around 1% from its 52-week high, with some 65% of S&P 500 ($SPX) stocks above their 200-day simple moving averages (SMAs). Following a sharp decline the last five days, however, this ETF is now closer to its 200-day SMA, with breadth also taking a hit. Today's report will look at the double top taking shape in RSP, the downtrends in the major index ETFs, and signs of risk aversion in the credit markets.
RSP Stumbles as Double Top Takes Shape
RSP was leading the market with a new high in early November. In fact, it was the only one of the major index ETFs to hit a new high this month. The SPDR S&P 500 ETF (SPY) and Invesco QQQ Trust (QQQ) didn't hit new highs in November, nor did small-caps (IWM) or mid-caps (IJH). The S&P 500 EW ETF was alone, which means we needed to ask ourselves what could go wrong. Answer: the S&P 500 EW ETF could join the others with a downturn.
The chart below shows RSP hitting a new high on November 4/5 and then falling around 5% (based on Thursday's close). With this sharp decline, RSP broke support from the early November low and reversed the short-term upswing. This is the first step towards something bigger going wrong.
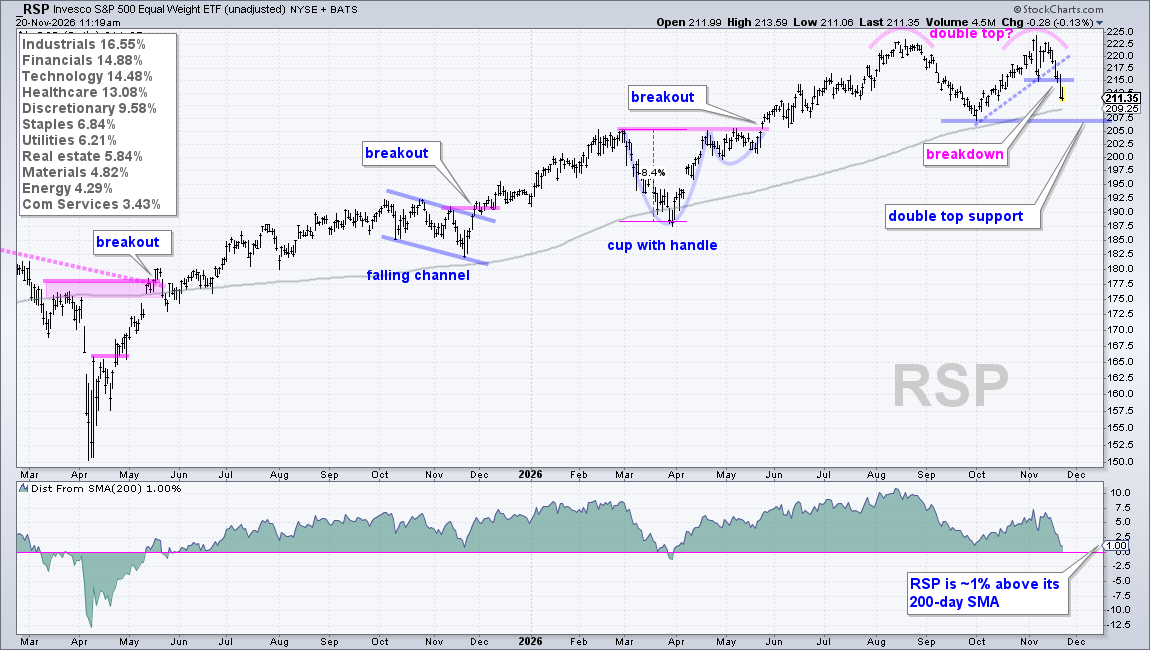
The long-term trend is still up, but a double top is taking shape with support at 207. Double tops are bearish reversal patterns that form with two relatively equal highs and an intermittent low. A break below the intermittent low confirms the pattern and signals a downtrend. With the support break at 215, RSP is now headed for a test of double-top support.
Note that RSP is the last of the major index ETFs standing. It's the only one still above its 200-day SMA, and is the only one showing a gain since October. The CandleGlance charts below show nine major index ETFs (as of Friday at 10:30AM). The blue circles show RSP above its 200-day and with a positive 37-day Rate-of-Change. It is not a pretty picture for the others, with eight below their 200-day SMAs (pink circles).
Special Reports at TrendInvestorPro Next Week
Note that we will publish two special reports next week (Tuesday/Friday)
- Testing the 200-day Cross and TrendTrio Signals for the Major Indexes
- Using Sentiment and Capitulation Indicators to Identify Extremes
Click here to sign up and get full access.
Yield Spreads Show Stress in Credit Markets
Tech stocks came under pressure in October, which is when yield spreads widen and stress increases in the credit markets. The yield spread is the difference between the corporate bond yield and the comparable US Treasury bond yield. Credit markets show confidence when these spreads are narrow, and stress when these spreads widen. Widening spreads mean that bond traders are demanding a higher premium to hold the riskier bonds. Yield spreads started widening in late September, and continued to widen in October–November. Note that TrendInvestorPro tracks these spreads as part of our Market Regime page, which includes breadth models for market timing.
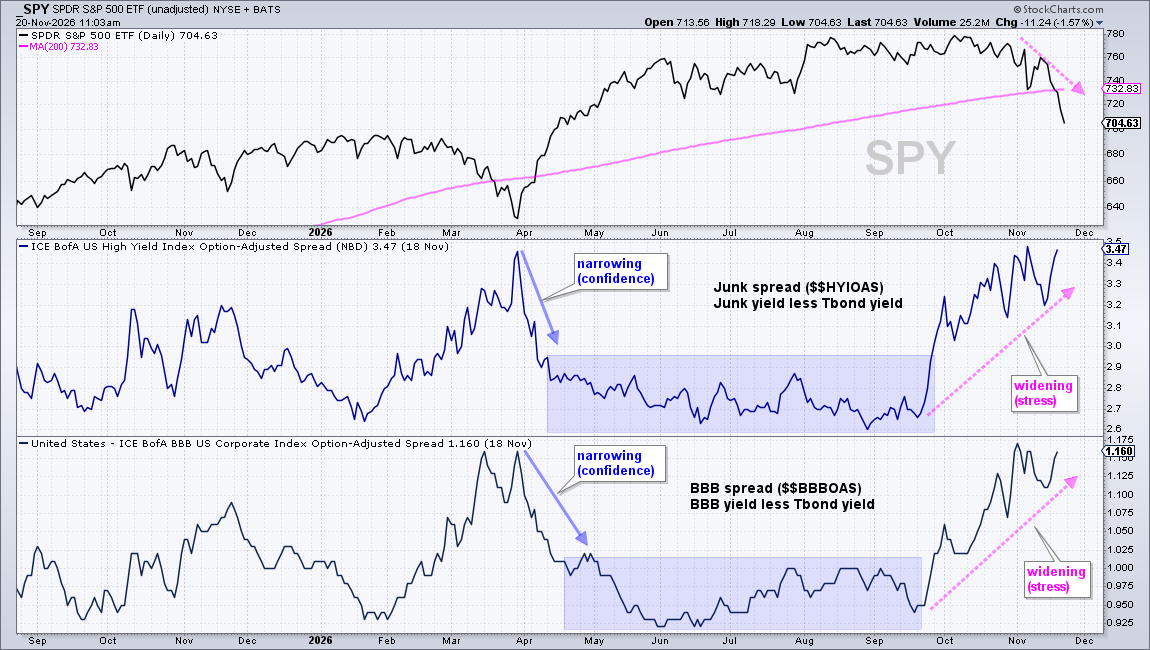
In the middle window, the Junk Bond Spread began widening in late September and moved to its highest levels since April (pink arrow-line). In the lower window, the BBB spread turned up in late September and also widened further into November. Both are back near their late March levels, which was also a stressful period for the markets. Credit market stress is negative for stocks (risk assets) because it furthers the argument for risk aversion in the market.
The Canary in the Bond Market Extends Lower
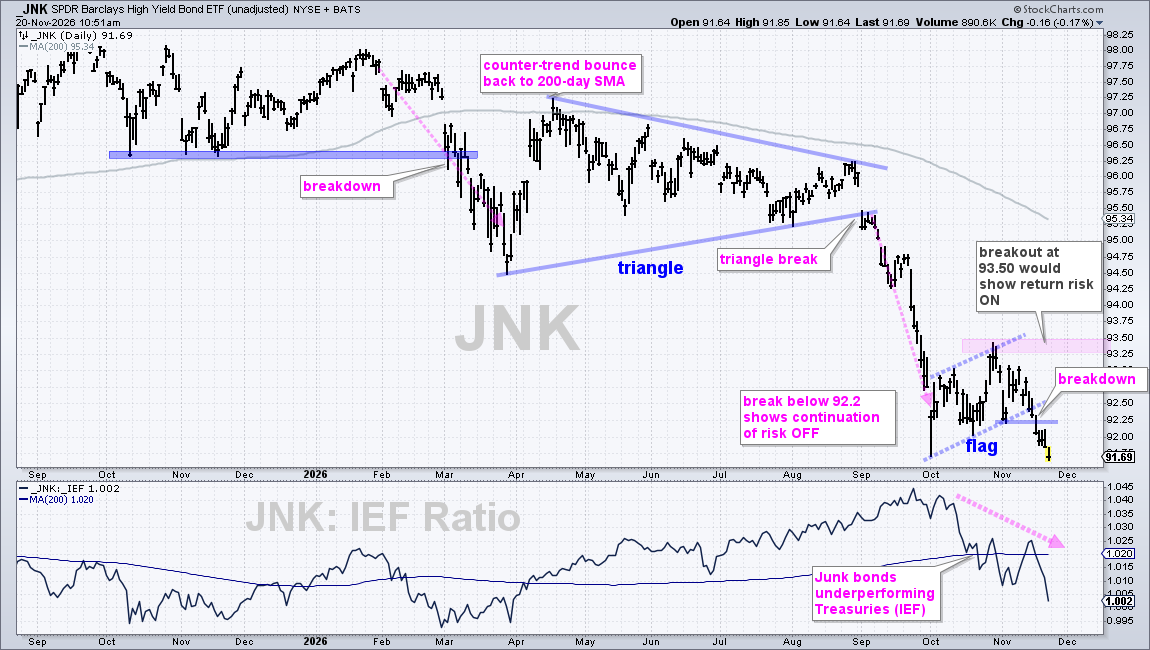
Junk bonds are the canaries in the coal mine because they represent the riskiest credits (closest to default). Money moves out of junk bonds when traders are risk-averse and into junk bonds when traders embrace risk. Money has been moving out of junk bonds all year, and that pattern continued in November. After a sharp decline in September, the SPDR Barclays High Yield Bond ETF (JNK) formed a rising flag and broke flag support this week. This signals a continuation of the September decline and reinforces the risk-off trade.