StockCharts Insider: Measured Moves and the Art of Setting Price Targets
Before We Dive In…
You spot a clear market pattern. Maybe it’s a smooth upswing and pullback. Maybe it’s a symmetrical triangle, or a rectangle pattern. It’s ideal for a swing trade. You jump in. But once your position’s open, how far can it go? Where’s your profit target? After all, a swing trade needs three things—an entry point, a profit target, and an exit point.
If you don’t know how to answer those questions, this might be one of the more important posts you’ll read. It’s about setting targets using a measured move principle. Haven’t heard of this before? Stick around.
What is a Measured Move?
A measured move is a technical analysis technique where traders estimate how far a stock might run by using the size of a previous price swing or chart pattern as a roadmap for the next move. In simple terms, you use the previous price swing or height of a pattern to estimate your profit target.
This assumes consistency. Are markets really that consistent? Sometimes, yes. Sometimes no. Take a look.
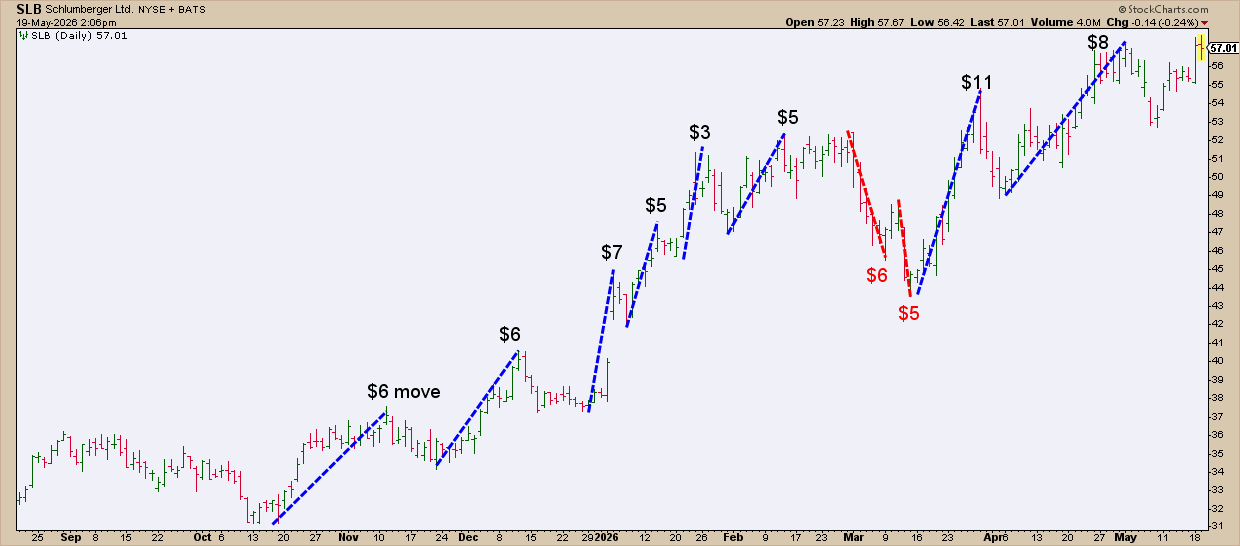
Here’s a chart of Schlumberger Ltd. (SLB). Take a look at the dollar value of each leg up (blue lines) and the two legs down (red lines).
Are the market swings consistent in dollar value? Well, they’re sort of consistent. Enough to project the next move up in each consecutive swing? Probably, even though you might not get 100% of the move. But let’s talk about this.
Measuring a Move is More “Qualitative” Than “Quantitative”
Yes, to measure is to count, calculate, or quantify. Still, there’s a huge qualitative gap.
How measurements are made remains subjective. Two traders can look at the same chart and measure different things. Traders apply measured moves to different time frames—15-minute, 1-hour, 4-hour, daily, or weekly charts. When measuring a move for profit targets, some will shoot for a 100% move, while others will settle for a 60% move. The targets are all over the place. You probably get it now.
More art than science, measuring a move is an important skill.
Applying the Measured Move to Chart Patterns
Measured moves show up in almost every major chart pattern. The basic idea is simple: measure the height of the pattern and project that same distance from the breakout point to estimate how far the next move might run. There are variations to this calculation, of course, so do your homework before applying this to any pattern.
Take a look at this chart of Salesforce.com, Inc. (CRM).
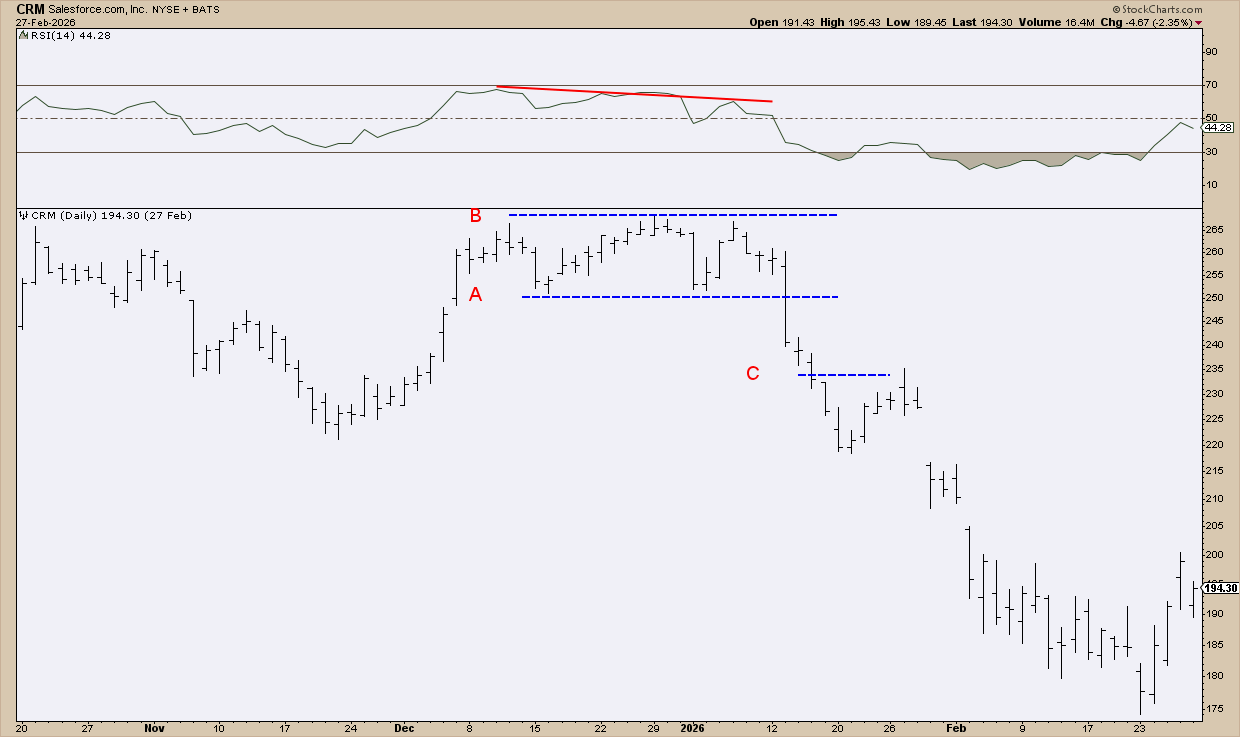
See the triple top? As it formed, the RSI indicated a bearish divergence in momentum. A trader looking to take advantage of this breakdown on the short side would have measured the height of the pattern by subtracting the price at the top (B) from the bottom (A).
Leaving out the cents, the difference between $268 (B) and $251 (A) is $17. For a 100% measured move target, designated C, you’d subtract $17 from $251, which would give you a downside target of $234.
There’s another measured move a more aggressive trader might have made.
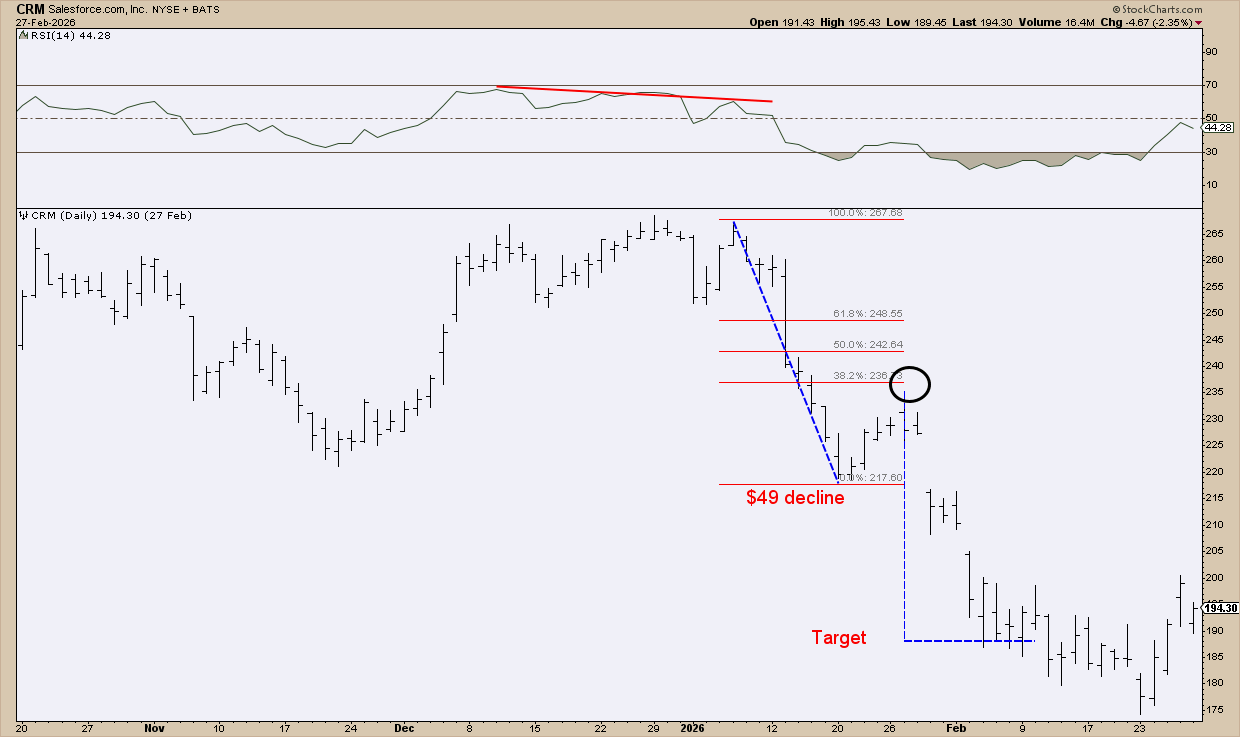
Measuring the full leg of the decline, which was $49, a more aggressive trader might have gone short once price approached the 38.2% Fibonacci retracement (placing a stop-loss well above the 61.8% retracement). To generate a profit target, the trader would have subtracted $49 from the correction high of $235, giving a target of $186.
Here’s another one.
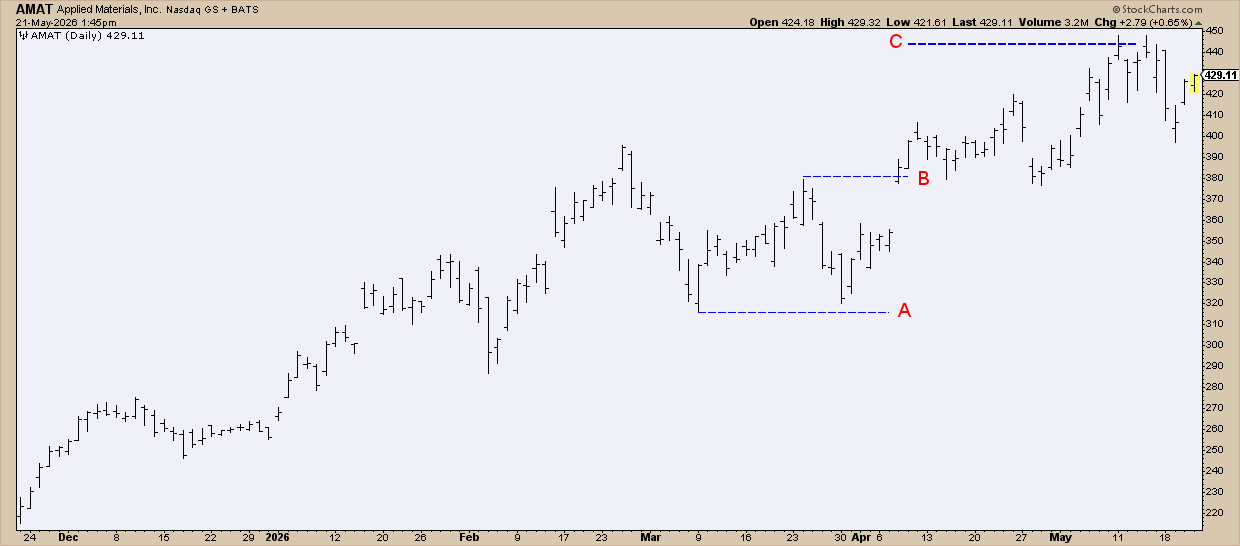
This chart of Applied Materials, Inc. (AMAT) shows a correction that’s exhibiting a double bottom pattern.
The logic is similar to almost every pattern. Subtracting the lowest valley (A) from the highest peak (B) we get a $63 move. For a 100% measured move, you’d add that to the peak at $379 and your target (C) would be at $442. Not everyone will aim for a 100% measured move, and some may choose to take profits earlier, say above 60% of the measure.
Now that you get the concept, here are a few Insider Tips to consider.
Insider Tip 1: Treat targets as zones. Every critical “price level” should be viewed as a zone. Support, resistance, profit target, etc. Markets are messy. They overshoot, undershoot, or even reverse before reaching a projected level. So, think in terms of zones, not exact prices.
Insider Tip #2: Higher timeframes often produce cleaner targets. Want a cleaner structure? Look at daily or weekly charts. Measured moves tend to work better. Less market noise. The market structure tends to be more reliable.
Insider Tip #3: Not every trader waits for a full measured move. I’ve said this a few times already, but it’s worth repeating. Some traders aim for only 60%–90% of a measured move instead of waiting for a full projection. Why’s that? Because markets don’t always complete the entire move. Partial targets can help you lock in profits before momentum fades.
And That’s a Wrap
That’s the thing about measured moves. They’re not prophecies. Not perfect precision. Just frameworks. Think “estimates.” Sometimes price nails a target. Sometimes it blows right through it. Other times it’ll fall short. What matters is that you have a projection. One based on structure and crowd behavior. Not random guessing. In short, you’re prepared, whether the trade works out or not.