StockCharts Insider: The Hidden Edge Most Traders Miss in the Top Menu
Before We Dive In…
We already covered Market Summary basics in a previous article. So, in this installment, we’re going to talk about creating an ecosystem—wiring together all of the parts to make an even more powerful and customizable tool for your workflow. We can also make this work faster, as our focus will be on the menus at the top navigation bar on the page.

Not surprisingly, most StockCharts users treat the top bar as a navigation bas (like, duh, it is a navigation bar, right?).
That’s functionally correct, but it also yields an advantage for only those who know how to read between the buttons. You see, each tab answers a specific question. But as a sequential unit, they form a filtration process that can help you move from broad market to specific trade candidates with far more precision.
Step 1 — Define the Environment
We’re not going to rehash everything here, but Market Summary is your starting point. At this stage, you’re not looking for setups; you just want to know what state the market is in. Is it risk-on, risk-off, mixed, indecisive, or rotational?
Insider Tip #1: Look for internal disagreement.
If indexes are up but breadth is weak, or if defensive sectors are driving a broader market rally, then the market may be more fragile than it appears on the surface.
Your Goal: Establish context first. Everything else from this point on depends on it.
Step 2 — Track Capital Flows (Sector Drill Down)
Once you see the environment, the next task is to follow the money. What’s it flowing into? This is where the market stops being abstract, as you can see the eleven sectors and how they’re performing relative to one another.
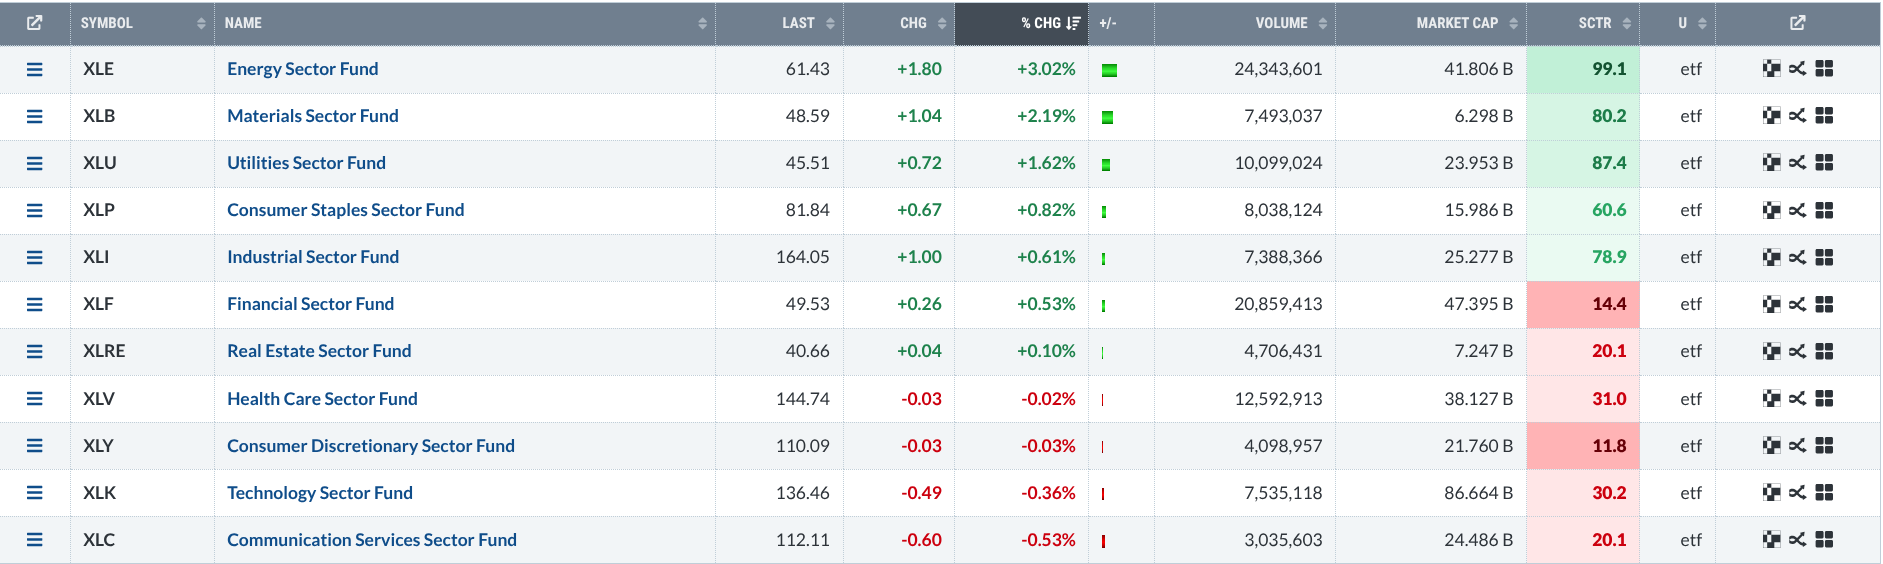
Insider Tip #2: Don’t get fixated on the #1 sector.
Watch sectors moving from the middle of the pack toward a leading position. This is where Relative Rotational Graphs, aka RRG Charts, can come in handy. Comparing short-term vs. longer-term performance can give you a sense of how sectors are trending on a relative basis.
Your Goal: Look for emerging strength. If you spot it correctly, those stocks likely have room to run.
Step 3 — Test the Strength Beneath the Surface (US Industries)
Sectors may help you view the broader market more clearly, but they can still hide a lot of noise. Industries, on the other hand, can expose the real movements driving sectors. Zoom in on the industry level and you can see if sector strength has broad participation or if it’s being carried by a few pockets.
Insider Tip #3: Look for clusters of strong industries.
One standout group of stocks in a sector of tepid industries might signal false strength. Yet, if you see a weak sector with strong industries, you might be able to spot early leadership. It’s a tricky and nuanced thing, but doing the extra work can give you an advantage if you’re looking for opportunities that other traders are missing.
Your Goal: Go beyond the headlines and examine what’s really happening under the hood.
Step 4 — Get to Know the Movers Behind the Indexes (Index Members)
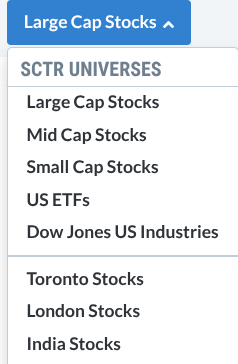
As you know, indexes don’t move. Their underlying stocks do. So, here’s your chance to drill down. You have a wide assortment of indexes to choose from, and you can organize them under several categories like market cap, sector, industry, etc.
Insider Tip #4: Use the SCTR column to find the strongest candidates.
What matters to you is finding the stocks that have the strongest levels of technical strength. If they’ve pulled back, even better. Using the StockCharts Technical Rank (SCTR) column, you can find them across multiple indexes in an instant. You may even discover emerging leaders that aren’t quite household names (yet).
Your Goal: To find the leaders in each index, whether they’re the names dominating the news or the underdogs that get very little to no spotlight.
Step 5 — Separate Noise from Strength (SCTR)
This next tab lets you jump directly to stocks categorized by technical strength. You can categorize them by market cap, ETFs, and some international exposure. You can also view SCTR performance by time frame.
SCTR is not static. It’s a dynamic and comparative measure. This means that a rising SCTR can sometimes be more important than an already high SCTR. This, of course, depends on context.
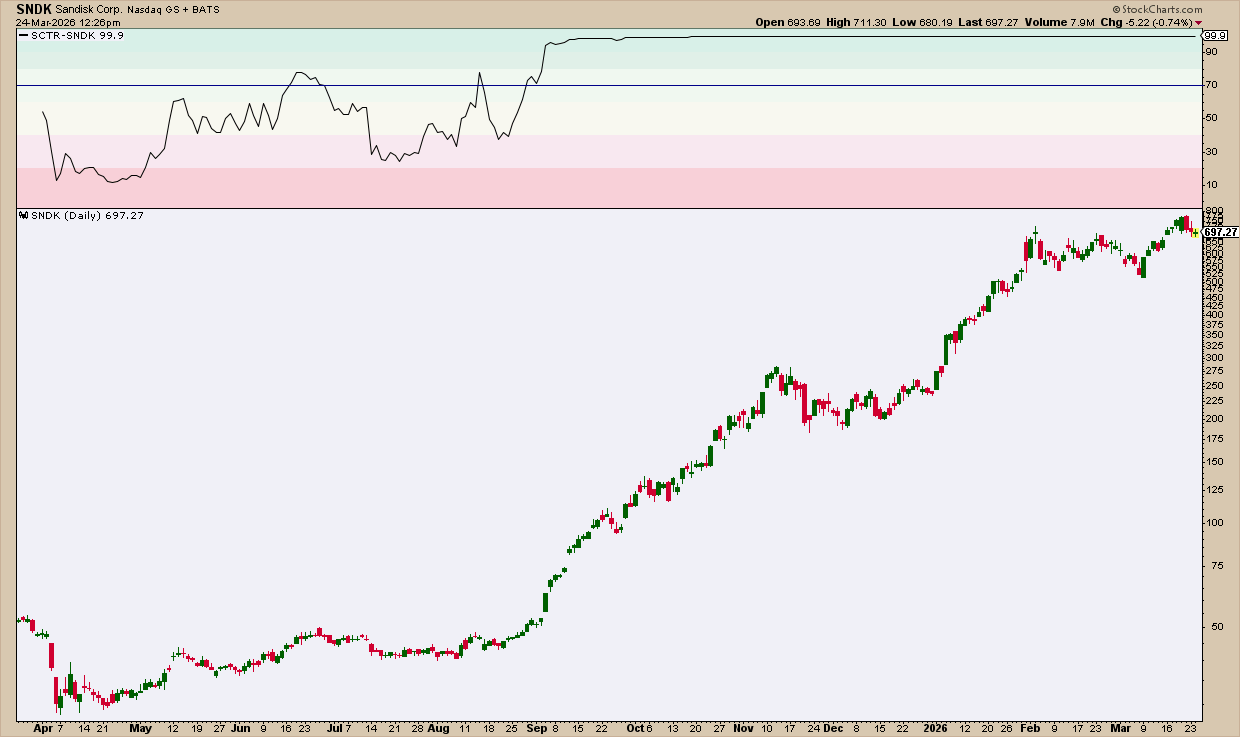
Insider Tip #5: Look for divergence.
If you see price moving sideways while SCTR rises, it can mean quiet accumulation. Also, watch for stocks crossing above 70–75. This often tracks where institutional momentum starts showing up.
Your Goal: Given that technically strong stocks make for strong candidates, your job is to further analyze them using other technical (or fundamental means) to figure out which stocks provide actionable opportunities.
Step 6 — Eliminate Hidden Risk (Earnings Calendar)
It’s always a good idea to ask yourself what could complicate, disrupt, or invalidate your trading tomorrow. At the least, you want to avoid stepping on proverbial landmines that you can easily foresee.
Insider Tip #6: Look for earnings clusters within a sector.
When you find sector earnings grouped together—typically within a week or a period of weeks—it means that volatility is about to expand. Depending on your timeframe, volatility can either signal opportunity (especially for swing trades), or a period to avoid. Post-earnings moves can present cleaner setups. Ultimately, though, that depends on your strategy.
Your Goal: Anticipate potential volatility-based setups by checking the earnings calendar; this is not so much about market structure as it is a matter of timing.
Step 7: Stress-Test The Market’s Risk Appetite (Cryptocurrencies)
Now zoom out a bit by looking at the cryptocurrency market, which arguably represents investors’ risk appetite. Is it expanding or weakening?
Insider Tip #7: Think of crypto as a high-beta extension of equities.
According to the CFA Institute, some analysts compare crypto to high-beta stocks, despite it being a separate asset class. Here are a few general observations to think about (not rules, but tendencies):
- Crypto strength during equity rallies = confirms high-risk participation
- Crypto weakness while equities rise = fragile risk-on (divergence warning)
- Crypto leading (up or down) = early shift in liquidity or sentiment
- Sudden crypto spikes can signal short-term liquidity surges that are not always sustainable
Your Goal: Analyze the market’s general sentiment by using cryptocurrency as a proxy stress-test.
Putting It All Together: A Workflow with an Edge
In a nutshell, here’s your sequence:
1 - Market Summary -> Defines your general environment
2 - Sector Drill Down -> Identifies capital flow
3 - US Industries -> Confirms internal strength within sectors
4 - Index Members -> Identifies stocks driving the indexes
5 - SCTR Reports -> Filters stocks for technical strength
6 - Earnings Calendar -> Anticipates volatility risk (and opportunity)
7 - Cryptocurrencies -> Confirms risk sentiment
Each step lessens the noise and allows you to see the general market environment more clearly. By doing so, each step increases probability (in your favor, of course).
BONUS: Less-Obvious Combos That Traders Can Easily Miss
I’m going to give you a few combinations to think about. I’m not going to explain them at length, but think about them and see if they help.
- Strong Sector + Rising SCTR + Weak Headlines can mean stealth accumulation.
- Weak Sector + Strong Industry + Rising SCTR can help you spot early breakout candidates.
- Strong Stocks + Upcoming Earnings Cluster signal a potential volatility spike (which should interest those who trade volatility-based strategies).
And That’s a Wrap
Your edge isn’t hiding in one tab—rather, it’s in the sequence. Move from context to flow and the market gets a lot clearer as you get faster and more efficient. Stack the tabs, cut the noise, and you’ll gain a time and (market) timing advantage in your workflow.