What’s Really Driving this Stock Market Rally? Start With These Charts

Key Takeaways
- New highs in the S&P 500, Nasdaq, and small-caps suggest strength beyond mega-cap tech.
- Strong corporate earnings are driving the stock market higher.
- Consumer spending remains resilient despite inflation concerns.
And there it goes again.
The S&P 500 ($SPX) and Nasdaq Composite ($COMPQ) closed at new highs, ending April on a strong note. Not long ago, that outcome seemed unlikely. But the stock market can change on a dime, and what happened in April is a reminder of why it pays to follow the market.
It has been a great earnings season so far. With most of the mega-cap tech earnings now behind us, investors seem to be more confident. Some individual names, such as Microsoft (MSFT) and Meta (META), saw their stock prices pull back after reporting results but, overall, the stock market likes what it’s seeing and continues to ride higher.
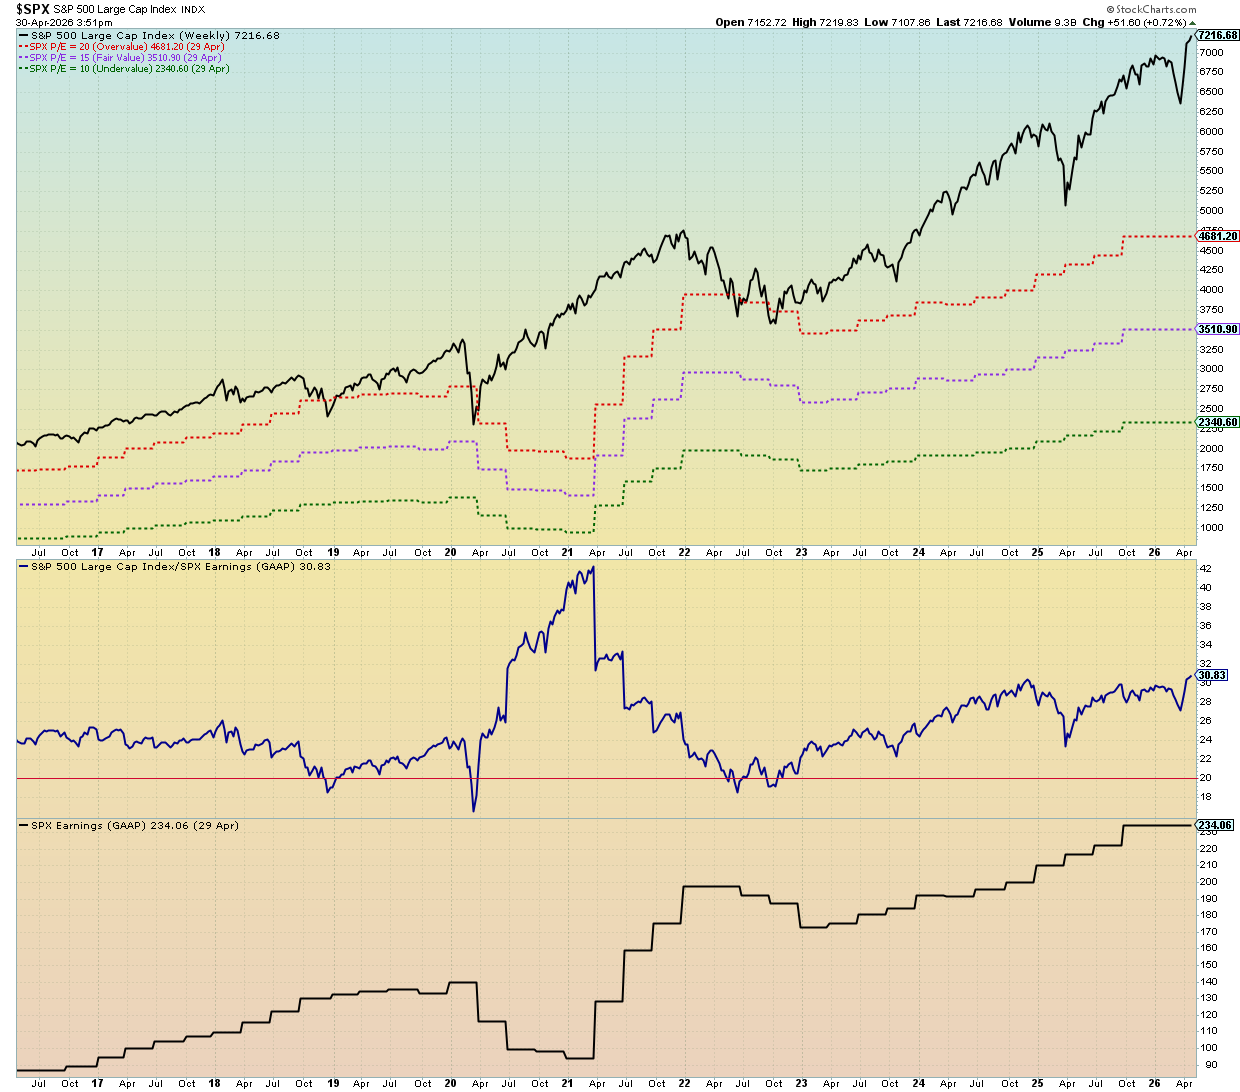
The earnings chart below helps put the strength in earnings into perspective. The middle panel displays the performance of the S&P 500 relative to S&P 500 earnings. It’s at around the level it was in the last quarter of 2024.
It’s Not Just the Heavy Weights
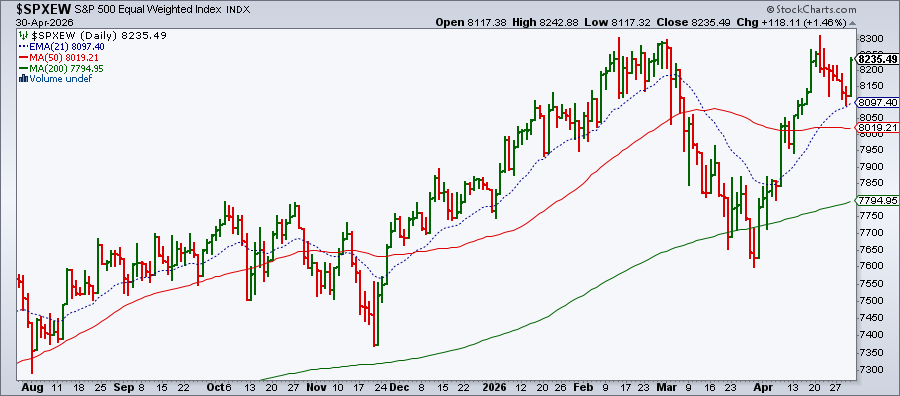
The rally isn’t limited to the heaviest weighted stocks in the S&P 500. The S&P 500 Equal-Weighted Index ($SPXEW), which gives an equal weight to all stocks in the index, also moved higher. This indicates that participation is broadening.
Small-cap stocks are also showing signs of strength. The S&P 600 Small-Cap Index ($SML) also hit a record close, suggesting investors are feeling optimistic about the domestic economy.
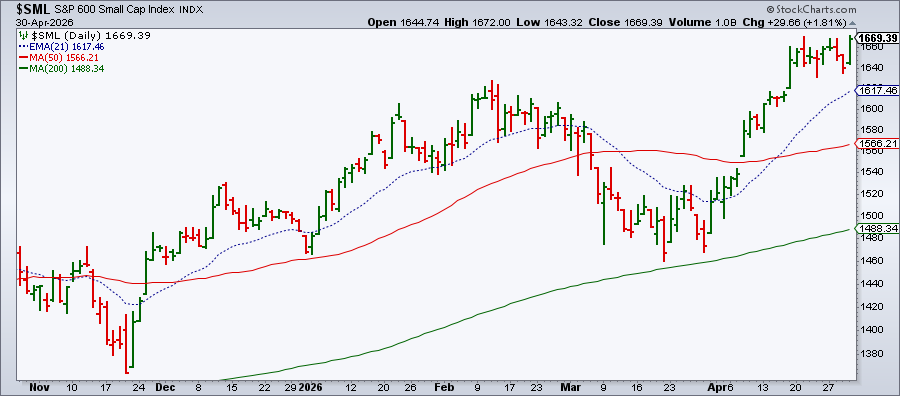
If $SML continues to rise, it could be a sign that investors are looking beyond the large-cap growth stocks. This would bode well for the overall health of the stock market.
Consumers Still Spending
U.S. GDP was up 2% in Q1, most of it attributed to the jump in big tech spending. Consumer spending softened slightly, which shouldn’t be a surprise given rising inflation. We did get a higher-than-expected PCE. Yet earnings from Visa (V) and Starbucks (SBUX) suggest consumers are still spending.
Consumer spending is a key driver of the economy, and as long as the labor market remains stable, consumers will continue to spend on travel, dining, and plenty of packages arriving at the front door.
The S&P 500 Retail ETF (XRT) bounced off its 200-day simple moving average (red line), and momentum looks like it’s getting ready to move higher, as seen by the Relative Strength Index (RSI) and Percentage Price Oscillator (PPO). The RSI has turned higher at around the 50 level and the PPO looks like it may cross back to the upside. Both indicators are displayed in the panels below the price chart.
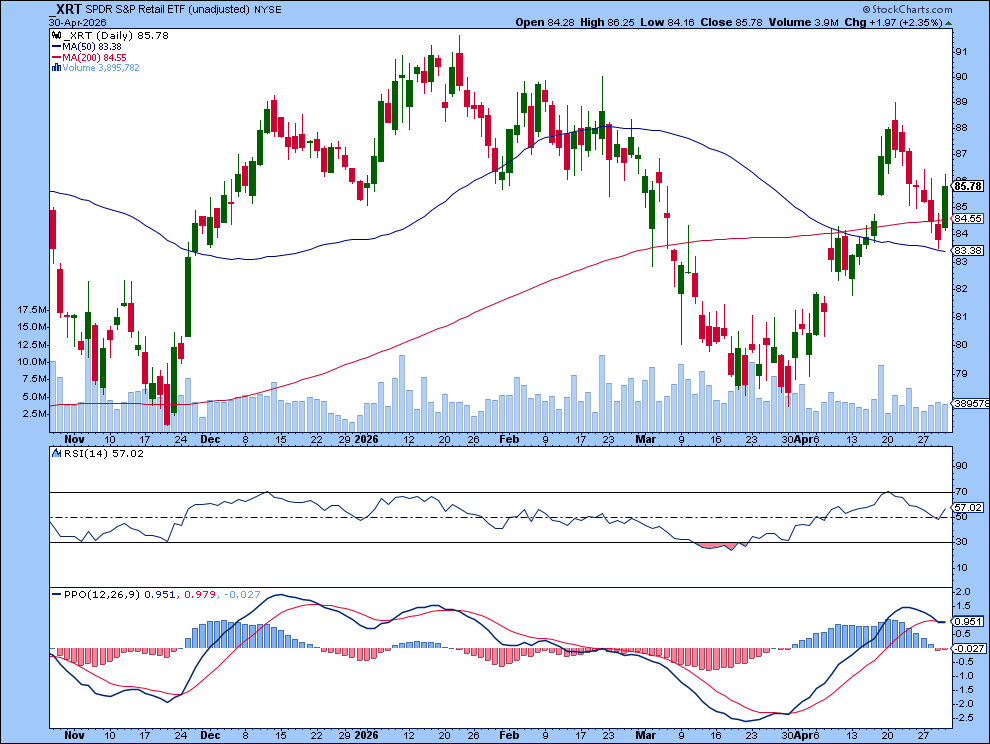
Look to see if XRT can maintain its position above the 200-day SMA accompanied by enough momentum for upside follow-through.
Interestingly, this much optimism is occurring at a time when crude oil prices are elevated. This, along with the Cboe Volatility Index ($VIX) at a relatively low level, seems to suggest that investors aren’t fearful right now, despite what’s going on in the Middle East. The focus seems to be on earnings and economic growth.
What’s Brewing Under the Hood?
Looking beneath the surface, more stocks are participating in the rally than sitting on the sidelines. The percentage of stocks trading above their 50-, 100-, and 200-day moving averages is above 50%, advances are outnumbering declines, and investor sentiment is bullish.
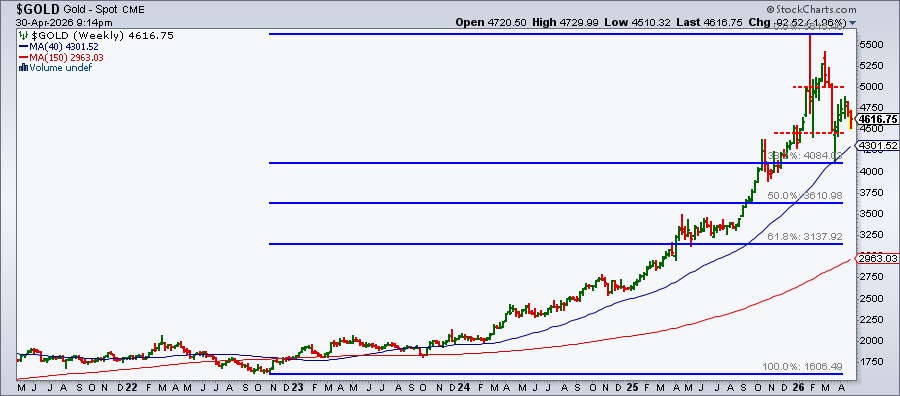
One area that isn’t joining the party is precious metals. Gold and silver prices have lost some of their shine.
The weekly chart of spot gold ($GOLD) below shows the price bounced off its 38.20% Fibonacci retracement level. Will it make its way back down to retest it? That’s something to watch for in the chart below.
Why This Matters
The bull market appears to have extended its stay. A few weeks ago, it looked like the stock market might be getting ready to take a breather. Instead, it came roaring back with major indexes pushing to new highs. For now, the market is less focused on inflation or the U.S.-Iran war and more focused on the strength of the U.S. economy.
News headlines cause swings in the market, which in turn can wreak havoc on your emotions, leading you to make hasty decisions. Instead, focus on the charts, study long- and short-term trends, and let the charts tell you the story.
Disclaimer: This blog is for educational purposes only and should not be construed as financial advice. The ideas and strategies should never be used without first assessing your own personal and financial situation, or without consulting a financial professional.